Proceeding Paper

Cold Response of Digital Vessels and Metrics of Daily Vibration Exposure †

1
Clinical Unit of Occupational Medicine, Department of Medical Sciences, University of Trieste, 34100 Trieste, Italy
2
Department of Mechanical Engineering, Politecnico di Milano, 20100 Milano, Italy
*
Author to whom correspondence should be addressed.
Presented at the 15th International Conference on Hand-Arm Vibration, Nancy, France, 6–9 June 2023.
Proceedings 2023, 86(1), 6; https://doi.org/10.3390/proceedings2023086006
Published: 10 April 2023
(This article belongs to the Proceedings of The 15th International Conference on Hand-Arm Vibration)

Abstract

:
The cold response of the digital arteries in a cohort of vibration-exposed workers was related to measures of daily vibration exposure expressed in terms of r.m.s. acceleration magnitude normalised to an 8-hour day, and frequency was weighted according to either the frequency weighting Wh defined in ISO 5349-1:2001 (Ah(8) in ms−2 r.m.s) or the hand–arm vascular frequency weighting Wp proposed in the ISO Technical Report 18570:2017 (Ap(8) in ms−2 r.m.s.). The metric Ap(8), which assigns more weight to intermediate- and high-frequency vibrations (31.5–250 Hz), performed better for the prediction of cold-induced digital arterial hyperresponsiveness in the vibration-exposed workers than the measure Ah(8) derived from the conventional ISO frequency weighting, which gives more importance to lower-frequency vibrations (≤16 Hz).

1. Introduction

Experimental studies have shown that the response of finger circulation to hand-transmitted vibration (HTV) is frequency-dependent [1]. Vibration frequencies ≥ 100 Hz can induce a stronger vasoconstriction than lower frequencies in either the human finger or animal models. Several epidemiological studies have reported that occupational exposure to intermediate- and high-frequency vibration is associated with an increased risk of a secondary form of Raynaud’s phenomenon called vibration-induced white finger (VWF) [2]. These findings are in contrast with the frequency weighting Wh recommended by the ISO 5349-1 standard, which gives more weight to lower-frequency vibrations (≤16 Hz) in the assessment of vibration-induced health disorders [3]. In the Italian arm of the EU VIBRISKS project [4], a supplementary hand–arm vascular weighting (Wp) proposed in the ISO/TR 18570 [5], which assigns more weight to intermediate- and high-frequency vibration (Figure 1), performed better than the ISO Wh curve for the prediction of the occurrence of subjective symptoms of VWF in a cohort of HTV workers.
The aim of the present study was to compare the relative performance of the vibration metrics constructed with either the frequency weighting Wh (ISO 5349-1) or the frequency weighting Wp (ISO/TR 18570) to predict, in addition to VWF symptoms, the cold response of the digital arteries in the VIBRISKS workers.

2. Material and Methods

The VIBRISKS cohort included 249 vibration-exposed workers (215 forestry operators and 34 stone workers) and 138 control men employed at the same companies and unexposed to HTV. They were investigated at baseline and annually in the autumn–winter seasons over a three-year follow-up period. The design of the VIBRISK prospective cohort study, the characteristics of the cohort workers, and the clinical criteria for the diagnosis of VWF symptoms have been described elsewhere [4].

2.1. The Cold Test

The cold test was carried out by means of a strain-gauge plethysmographic technique. The percentage change in finger systolic blood pressure (FSBP) from 30 to 10 °C (%FSBP10°) in a test finger (FSBPt), corrected for the change in systolic pressure in a reference finger (FSBPref) of the same hand, was calculated as follows:
%FSBP10° = (FSBPt,10° × 100)/[FSBPt,30° − (FSBPref,30° − FSBPref,10°)] (%)

2.2. Vibration Exposure

Vibration measurements were obtained from the tools used by the forestry workers (chain saws, brush saws) and the stone workers (grinders, polishers, inline hammers) according to the recommendations of international standard ISO 5349-1 [3]. Triaxial (x, y, z) vibration magnitudes were measured as r.m.s. accelerations over the frequency range 1–4000 Hz using the frequency weightings Wh and Wp displayed in Figure 1.
The vibration total value (av) of the r.m.s. accelerations of tool i frequency weighted according to Wh or Wp (Wf) was calculated as follows:
a v i ( W f ) = a x i ( W f ) 2 + a y i ( W f ) 2 + a z i ( W f ) 2           ( ms 2   r . m . s . )
Daily vibration exposure was expressed in terms of r.m.s. acceleration magnitude normalised to an 8 h day (A(8)), and frequency-weighted according to Wh or Wp (Wf):
A ( 8 ) ( W f ) = i = 1 n a v i ( W f ) 2 T i T 0                           ( ms 2   r . m . s . )
where av is the vibration total value of the r.m.s. acceleration of tool i, Ti is the duration of the ith operation with tool i in hours, and T0 is the reference period of 8 h.

2.3. Data Analysis

Continuous variables were summarised with the median as a measure of central tendency and quartiles as a measure of dispersion. Comparison between unpaired data was carried out by means of non-parametric statistics. The relations of cold test outcome (%FSBP10°) to measures of daily vibration exposure expressed in terms of either Ah(8) or Ap(8) were estimated by maximum-likelihood random-effects regression models for repeated measures over the follow-up period. The Bayesian Information Criterion (BIC) was used to compare the fit of the regression models, including alternative measures of daily vibration exposure [6]. According to the strength of evidence rules for the difference (Δ) in BIC between models, ΔBIC 0–2 suggests no difference in the fit between models; ΔBIC 2–6 tends to give positive support for the model with the smaller BIC; ΔBIC 6–10 provides strong evidence for the model with the smaller BIC.

3. Results

The occurrence of symptoms of white finger over the study period was 7.2% in the controls and 21.7% in the HTV workers (17.7% in the forestry workers; 47.1% in the stone workers). There were no significant differences in age and anthropometric characteristics between groups, while current smoking was more prevalent among the HTV workers affected with VWF (Table 1). Daily vibration exposure in terms of either Ah(8) or Ap(8) was significantly greater in the VWF workers than in the HTV workers with no vascular symptoms (p < 0.001). Baseline FSBPs at 30 °C were similar in the controls and in the HTV workers with or without VWF, while the vasoconstrictor response to cold (%FSBP10°) was stronger in the VWF workers than in the controls and the non-VWF workers (p < 0.0001).
The relation of cold test outcome (%FSBP10°) to measures of daily vibration exposure was investigated by means of two models with different sets of explanatory variables (Table 2). After excluding the controls from data analysis, in all models one unit of increase in Ah(8) (1 ms−2) or Ap(8) (10 ms−2) was significantly associated with an increase in the vasoconstrictor response of the digital vessels to cold (i.e., decrease in %FSBP10°). As expected, VWF symptoms were significantly related to the cold response of finger circulation. The BIC statistic suggests a better fit when Ap(8) rather than Ah(8) was included in the models as a predictor of vibration-induced digital vasoconstriction (ΔBIC 7 for both models).

4. Discussion

In this study, the metric Ap(8) performed better than Ah(8) for the assessment of the vasoconstrictor effect of cold in the digital arteries of HTV workers. This is consistent with our previous epidemiological findings that Ap(8) was a better predictor of the occurrence over time of VWF symptoms in the VIBRISKS cohort compared to the measure of daily vibration exposure Ah(8) recommended by ISO 5349-1 [4]. Vascular investigations have revealed that acute exposure to vibrations with equal frequency-weighted acceleration magnitudes can provoke a stronger reduction in the blood flow of the human finger for frequencies between 31.5 and 250 Hz compared with vibration at 16 Hz [7]. In animal models, exposure to high-frequency vibrations (250 Hz) was found to induce both functional (increased oxidative stress) and structural (arterial remodeling and narrowing) changes in the ventral tail arteries of rats [1]. The results of these pathophysiological and morphological investigations provide biological plausibility to the epidemiological findings of an increased occurrence of VWF symptoms in HTV workers operating power tools generating high-frequency vibration. Overall, the present study and our previous epidemiological surveys suggest that the evaluation of vibration exposure by means of a frequency weighting which assigns more weight to intermediate- and high-frequency vibration (31.5–250 Hz) is more appropriate for the assessment and the prediction of subjective symptoms and objective signs of vibration-related vascular disorders compared to the assessment method recommended by the current ISO 5349-1 standard, which tends to overestimate the vascular effects of lower-frequency vibration (≤16 Hz).

Author Contributions

Conceptualization, M.B. and M.T.; methodology, M.B. and M.T.; software, M.B.; validation, M.B. and M.T.; formal analysis, M.B.; investigation, M.B.; resources, M.B.; data curation, M.B.; writing–original draft preparation, M.B.; writing–review and editing, M.B. and M.T.; visualization, M.B. and M.T.; supervision M.T.; project administration, M.B.; funding acquisition, M.B. All authors have read and agreed to the published version of the manuscript.

Funding

This research was supported by the European Commission under the Quality of Life and Management of Living Resources programme—Key Action 4–Environment and Health–Project No. QLK4-2002-02650 (VIBRISKS).

Institutional Review Board Statement

The study was conducted in accordance with the Declaration of Helsinki, and obtained ethical approval by the Local Health Authorities of the Italian NHS.

Informed Consent Statement

Informed consent was obtained from all subjects involved in the study.

Data Availability Statement

The data presented in this study are unavailable due to privacy.

Conflicts of Interest

The authors declare no conflict of interest.

References

  1. Krajnak, K.; Riley, D.A.; Wu, J.; McDowell, T.; Welcome, D.E.; Xu, X.S.; Dong, R.G. Frequency-dependent effects of vibration on physiological systems: Experiments with animals and other human surrogates. Ind. Health 2012, 50, 343–353. [Google Scholar] [CrossRef] [PubMed] [Green Version]
  2. Bovenzi, M. Epidemiological evidence for new frequency weightings for hand-transmitted vibration. Ind. Health 2012, 50, 377–387. [Google Scholar] [CrossRef] [PubMed] [Green Version]
  3. SO 5349-1; Mechanical Vibration—Measurement and Evaluation of Human Exposure to Hand Transmitted Vibration—Part 1: General Requirements. ISO: Geneva, Switzerland, 2001.
  4. Bovenzi, M.; Pinto, I.; Picciolo, F. Risk assessment of vascular disorders by a supplementary hand-arm vascular weighting of hand-transmitted vibration. Int. Arch. Occup. Environ. Health 2019, 92, 129–139. [Google Scholar] [CrossRef] [PubMed]
  5. ISO/TR 18570; Mechanical Vibration—Measurement and Evaluation of Human Exposure to Hand Transmitted Vibration—Supplementary Method for Assessing Risk of Vascular Disorders. ISO: Geneva, Switzerland, 2017.
  6. Raftery, A.E. Bayesian model selection in social research. Sociol. Methodol. 1995, 25, 111–163. [Google Scholar] [CrossRef]
  7. Bovenzi, M.; Lindsell, C.J.; Griffin, M.J. Acute vascular responses to the frequency of vibration transmitted to the hand. Occup. Environ. Med. 2000, 57, 422–430. [Google Scholar] [CrossRef] [PubMed] [Green Version]
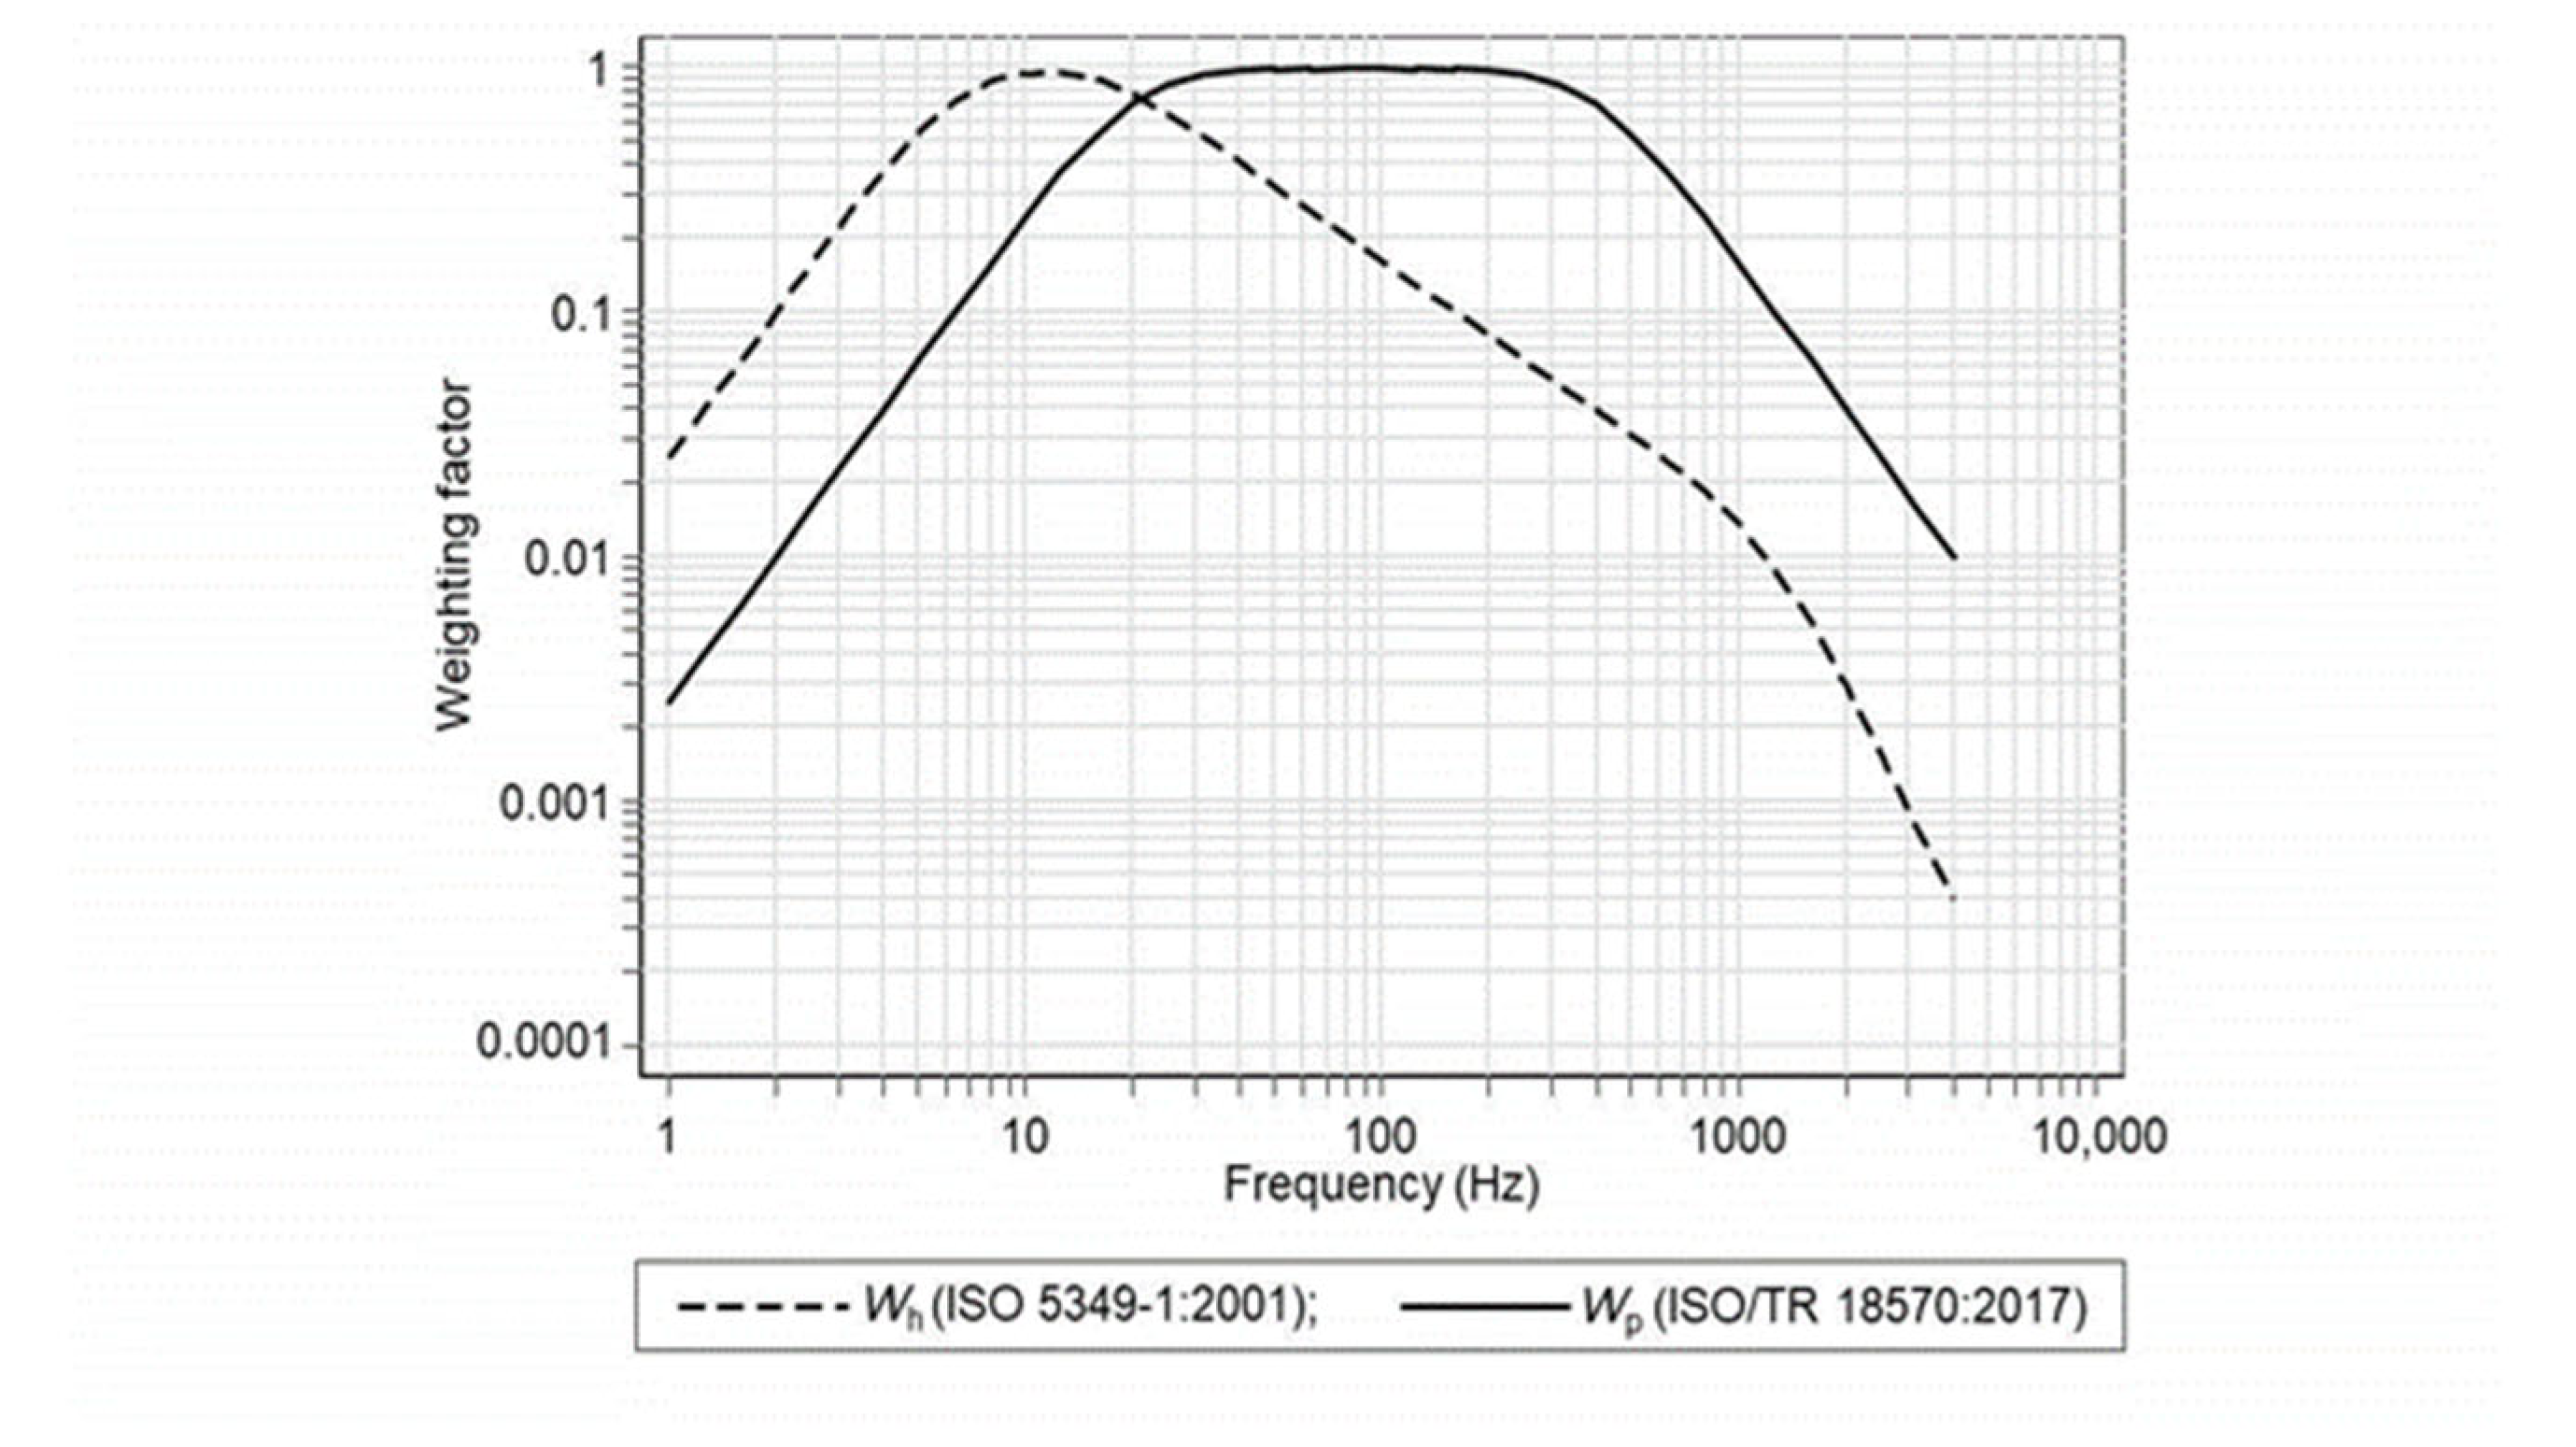
Figure 1. Comparison of frequency weighting functions (W) for hand-transmitted vibration. Wh: frequency weighting recommended in ISO 5349-1:2001; Wp: hand–arm vascular weighting defined in ISO/TR 18570:2017.
Proceedings 86 00006 g001
Table 1. Characteristics of the controls and the HTV workers. The results of the cold test are also shown. Data are given as medians (quartiles) or numbers (%). The HTV workers are divided into two sub-groups according to the occurrence of VWF over the study period.
FactorsControls (n = 138)HTV Workers (n = 249)
Non-VWF (n = 195)VWF (n = 54)
Age (yr)38.8 (34.1–45.9)42.1 (33.6–46.8)43.0 (34.8–52.2)
BMI (kg/m2)24.5 (23.0–27.2)25.7 (23.2–27.4)24.5 (23.2–26.8)
Current smokers (n)29 (21.0)85 (43.6)28 (51.8) *
Drinkers (n)104 (75.4)145 (74.4)47 (87.0)
Ah(8) (ms−2 r.m.s.)-3.59 (2.48–5.21)4.54 (3.44–7.94) **
Ap(8) (ms−2 r.m.s.)-17.9 (12.5–27.4)26.5 (16.1–78.9) **
Duration of exposure (y)-15 (7–21)17 (11–23)
FSBPt,30° (mmHg)120 (110–135)130 (115–140)125 (110–140)
FSBPref,30° (mmHg)130 (118–140)130 (120–140)130 (115–140)
%FSBP10° (%)92.9 (85.7–100)91.7 (81.8–100)81.7 (60.0–94.7) ***
χ2 test: * p < 0.001; Mann–Whitney test (VWF vs. non-VWF workers): ** p < 0.001; Kruskal–Wallis test between groups: *** p < 0.0001.
Table 2. Relation of %FSBP10° to measures of daily vibration exposure expressed in terms of either Ah(8) (ISO 5349-1) or Ap(8) (ISO/TR 18570). Regression coefficients (95% CI) are estimated by maximum-likelihood random-effects regression models for repeated measures over the follow-up period. The likelihood ratio (LR) tests for the significance of the measures of daily vibration exposure and the Bayesian Information Criterion (BIC) for the comparison between models are shown.
FactorsModel 1 aModel 2 b
Ah(8) (×1 ms−2)Ap(8) (×10 ms−2)Ah(8) (×1 ms−2)Ap(8) (×10 ms−2)
Af(8) (ms−2 r.m.s.)−1.23
(−1.63; −0.84)
−1.30
(−1.68; −0.92)
−0.98
(−1.38; −0.58)
−1.12
(−1.52; −0.71)
Duration of exposure (y)--−0.07
(−0.25; 0.12)
−0.03
(−0.22; 0.15)
VWF--−7.59
(−11.1; −4.03)
−7.02
(−10.6; −3.44)
LR test c2 (Af(8)) c34.741.120.426.8
Model fitting (BIC)7746773977807773
ΔBIC77
a Adjusted by survey time and %FSBP10° at baseline. b Adjusted by age at entry, smoking, drinking, BMI, hand trauma or surgery, systemic disorders, daily use of medicines, leisure activity with vibrating tools, survey time, and %FSBP10° at baseline. c p < 0.0001 for Af(8) in both models.
Disclaimer/Publisher’s Note: The statements, opinions and data contained in all publications are solely those of the individual author(s) and contributor(s) and not of MDPI and/or the editor(s). MDPI and/or the editor(s) disclaim responsibility for any injury to people or property resulting from any ideas, methods, instructions or products referred to in the content.