Proceeding Paper

User Satisfaction on Utilization of Human Resources Information System (HRIS) in Public Organizations †

Vocational Education Program, Universitas Indonesia, Depok 16424, Indonesia
*
Author to whom correspondence should be addressed.
Presented at the 5th International Conference on Vocational Education Applied Science and Technology 2022, Teluk Betung, Indonesia, 26–28 October 2022.
Proceedings 2022, 83(1), 32; https://doi.org/10.3390/proceedings2022083032
Published: 27 December 2022

Abstract

:
This study examines the relationship between Human Resources Information System(HRIS) application; system quality, information quality, service quality, and user satisfaction. The conceptual foundation for this paper is the DeLone and McLean information system success model (ISSM). This study contributes to existing research using the DeLone and McLean model applied in an Indonesian context. This research employs a descriptive analysis with a quantitative approach. The research sample consists of the whole utilization of HRIS that represented a division in public organizations exert in the security sector. The author uses the SPSS test in two stages: a validity and reliability test and a multiple regression analysis. The findings reveal that information quality and service quality partially influence user satisfaction.

1. Introduction

In this decade, the utilization of Management Information Systems (MIS) tends to increase the management of information. This activity provided many influences on the improvement of business processes and excellence in operational organization. A computer-based Management Information System is required for the provision of accurate, precise, and prompt data. There are many challenges faced by applying the MIS system in an organization [1]. The information generated by a computerized system can assist public organizations in making the best decisions.
Human resource departments maintain personnel records, including personal background, abilities, and pay, etc. In the past, the company would track employee data using paper records and spreadsheets. This activity takes a long time and causes the existing data to be inaccurate [2]. Human resource development has five main activities: recruitment, training, placement, career development, and retention.
The development of an information system also affects the management of human resources. HRIS systems are computerized and interrelated, allowing a human resource department to go paperless for all or part of its operations. They provide solutions for a variety of tasks, including the management of jobs and skills within an organization, regular interviews and recruitment interviews, professional mobility, the monitoring of working hours and activities, and the administration of paid leave and reimbursements, etc. [3]. HRIS is designed to provide information needed in making decisions related to the development of human resources.
Evaluation of the implementation of HRIS needs to be performed to ensure that the system built is in accordance with the company’s goals. Information systems are not purely technical systems; they are also social systems [4]. The key success factor in the implementation of an information system is user satisfaction.
There are many studies on user satisfaction with Information System(IS). User satisfaction is the most widely used measure to assess IS success because user satisfaction “ is an indicator with a high level of validity.” The purpose of this study is to evaluate the user satisfaction of human resource information systems in public organizations.

2. Materials and Methods

2.1. Literature Review

2.1.1. Human Resource Information System

In several studies related to information systems that focus on managing human resources (HR), it can be concluded that this information system refers two different names; electronic human resource management (e-HRM) and human resource information system (HRIS). Despite the different names, these two definitions mean the same thing. The author takes the definition of Stroimer (2007) e-HRM “as the planning, implementation, and application of information technology for networking which assists at least two individuals or groups in their shared performance of Human Resource tasks” [5]. DeSanctis (1986) defined HRIS as a “specialized information system within the traditional functional areas of the organization, designed to support the planning, administration, decision-making, and control activities of human resource management” [6]. HRIS was defined by Tannenbaum (1990) as a technology-based system used to reliably capture, store, manipulate, analyze, retrieve, and disseminate information regarding an organization’s human resources [7]. In simple terms, it can be concluded that HRIS or e-HRM are technology-based human resource management applications that are connected to the internet or are standalone and can be used for administrative activities or HR policy analysis.

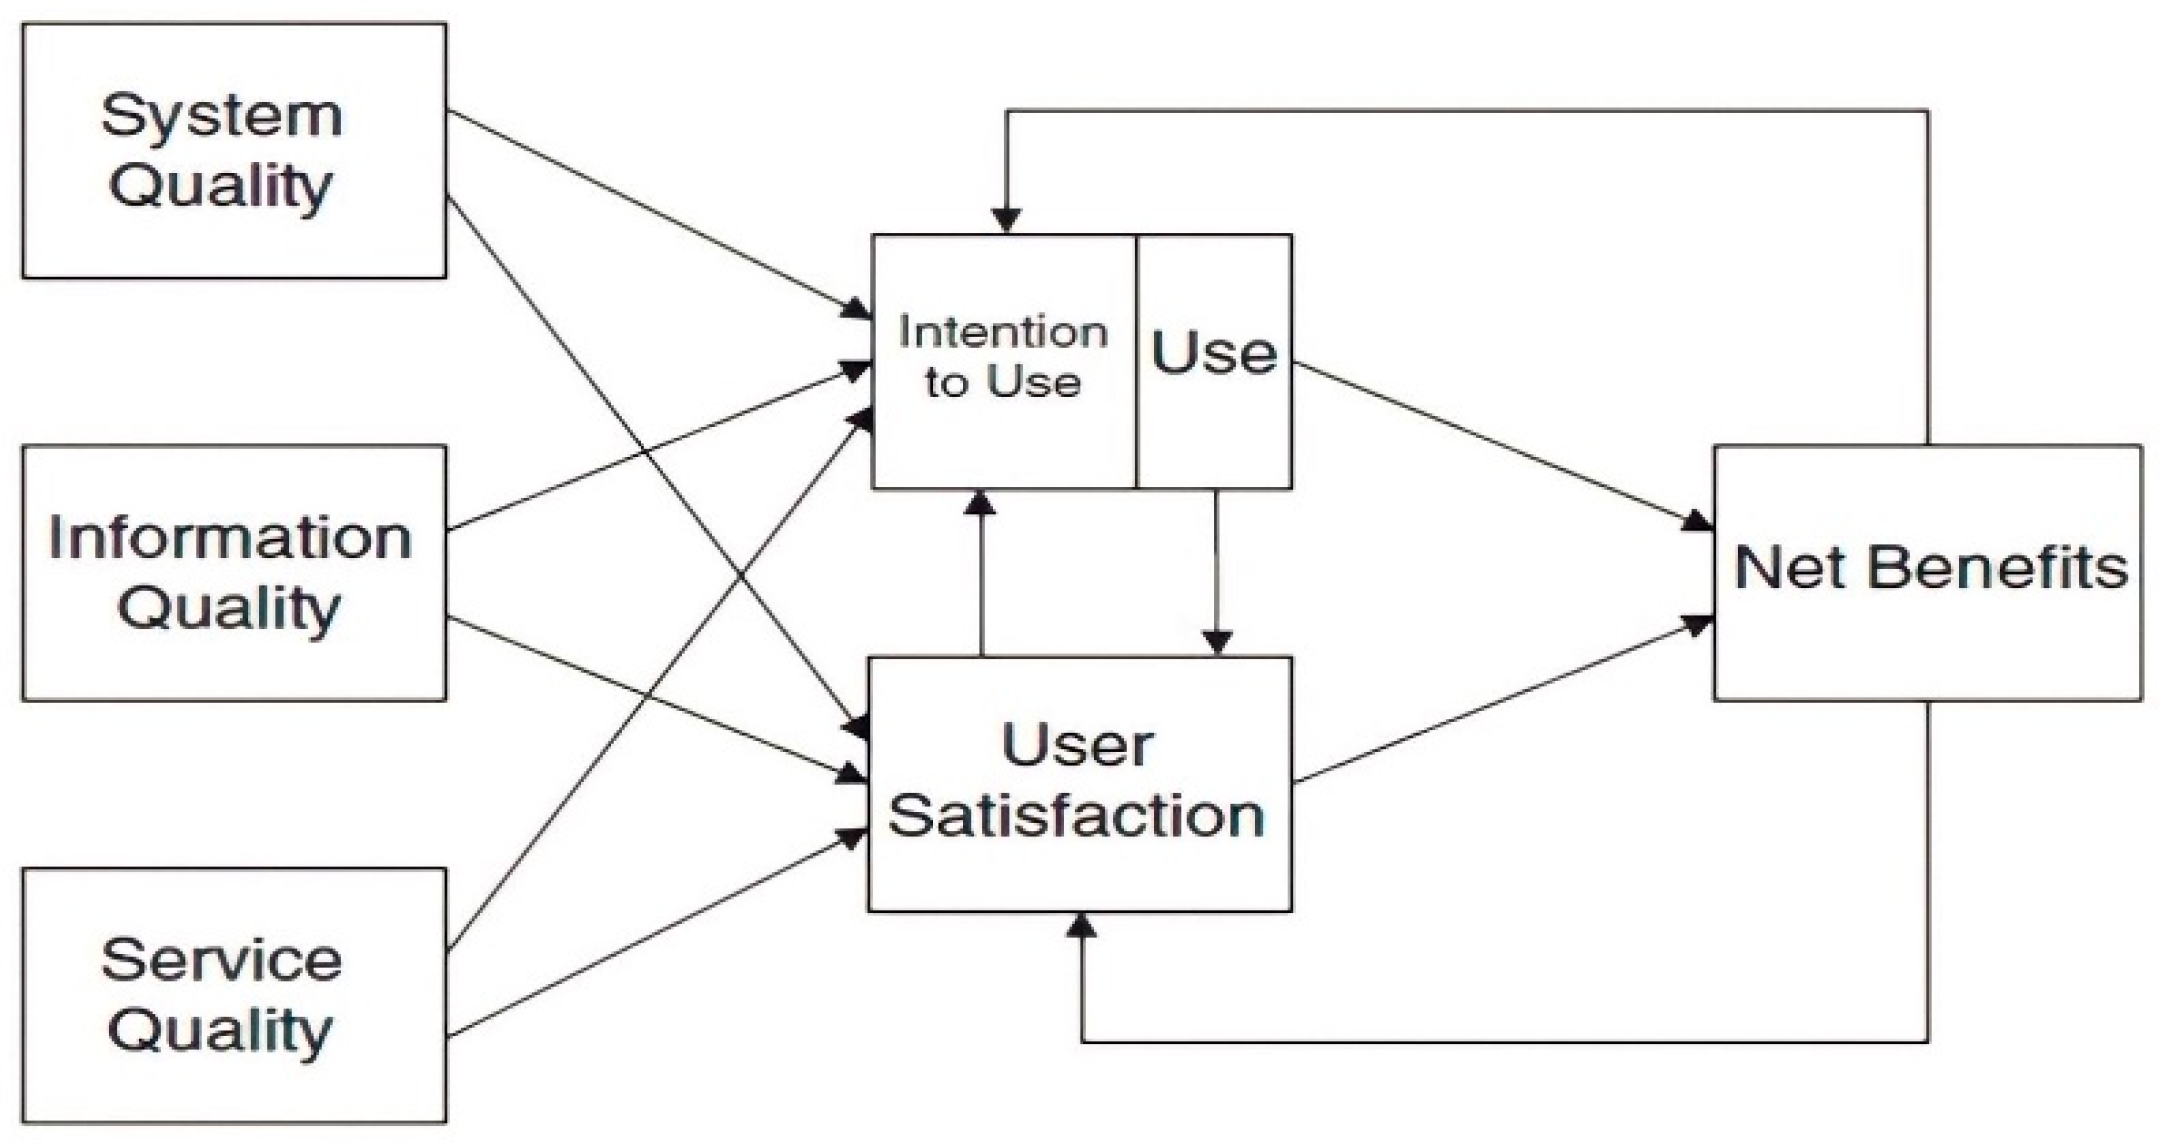
2.1.2. DeLone and McLean Modification

An organization must evaluate the level of success in the implementation of an information system. DeLone and McLean’s information system success model is one of the utilized models. The created model is the parsimony model, which is simple but comprehensive. The DeLone and McLean (1992) model proposed six interconnected variables to measure the performance of IS: system quality, information quality, system use, user satisfaction, organizational impact, and individual impact. According to the DeLone and McLean (1992) model, system quality, information quality, and service quality simultaneously affect “use” and user satisfaction as positive or negative. Use and user satisfaction affect individual impact and subsequently organizational impact [8].
DeLone and McLean (2003) provided a reformed version of their original model, taking into consideration both the evolving nature of IS and some of the critiques leveled against their 1992 model. The objections they take into account pertain to aspects of the quality dimension and the nature of the effects. DeLone and McLean developed their approach by combining all influences (organizational and individual) into a single component: net benefits [9]. Another major difference between the original model of DeLone and McLean (1992) and the updated model (2003) was the addition of service quality. The update model as follows in Figure 1:

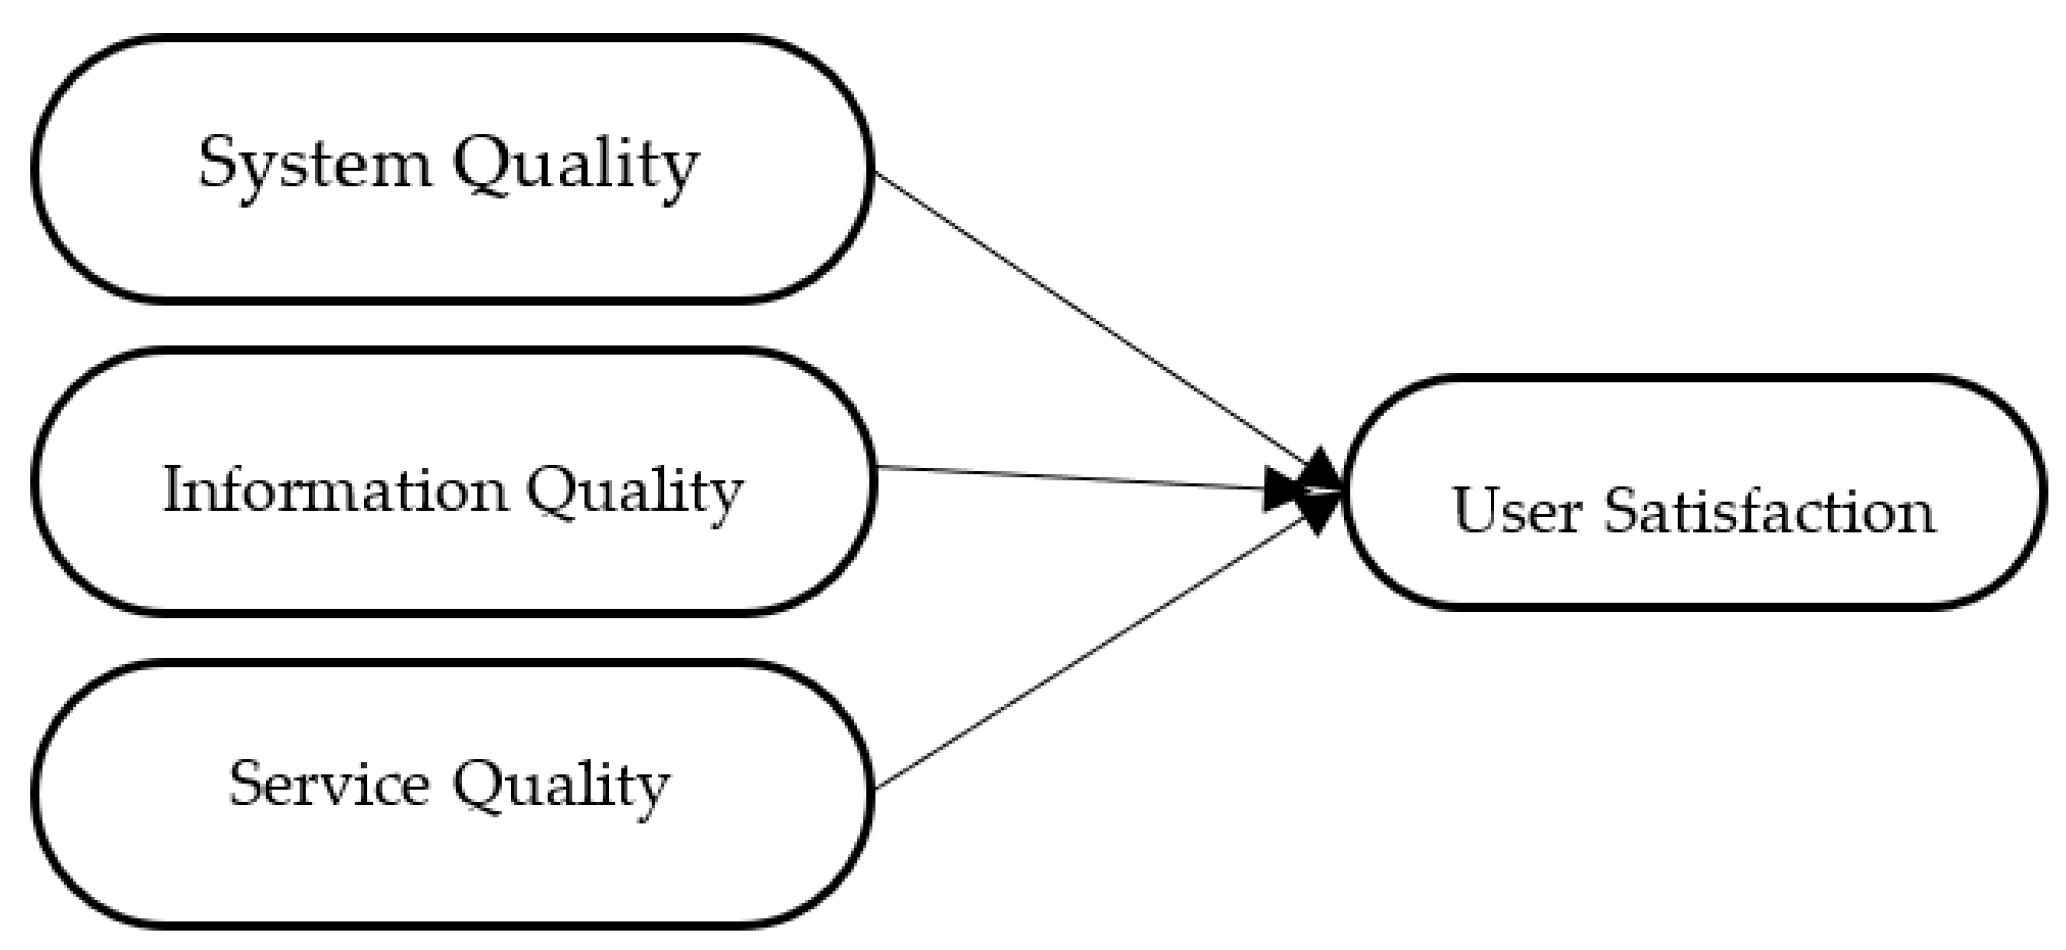
2.1.3. Quality (System, Information, and Service)

The term “quality” refers to the direct characteristic of an object. In this context, “object” might refer to a variety of things, including a product, service, or condition, etc. Elshaer (2012) defined of quality as “a situation when a set of inherent characteristics consistently fulfil the continuously changing requirements of the organization’s customers and other stakeholders” [10]. In other words, a product is considered to be of high quality provided its specifications meet the predetermined criteria.
System quality has attributes such as equipment availability, equipment reliability, ease of use, and response time, which are determining factors as to why system information is used or not used [11]. According to DeLone and Mclean (1992), system quality refers to the combination of software and hardware quality. The focus of system quality is on the performance of the system which refers to how the ability of the hardware and software, policies, and procedures for information systems in providing information to customers [12].
Information quality is defined as “a measure of the quality of (the IS) outputs, namely the quality of the information the system generates in reports and on-screen” (Gable et al., p. 389). The accuracy, completeness, consistency, ease of understanding, personalization, relevance, security, and timeliness of the information were evaluated to determine its quality [13].
Service quality is the user’s perception of the services provided by public and private organizations. Initially, the service quality parameters were aimed at measuring customer satisfaction. According to DeLone and McLean (2003), service quality is more important than other applications because system users are now considered customers and not employees or internal users of the organization [14].

2.2. Methods

This type of research uses a quantitative approach with a survey method. This study aims to describe the relationship between the dependent variable and the independent variable. System quality, information quality, service quality, and user satisfaction were used in this study. This study relates to employee perceptions about user satisfaction on a human research information system (HRIS). Hence, in this questionnaire, the author uses a Likert scale with 4 scales. The Likert scale was used with modification to eliminate ambiguity in respondent responses, i.e., strongly disagree (1), disagree (2), agree (3), and strongly agree (4). The sampling method used in this study is non-probability sampling. Entire HRIS users in division of a ministry in the Republic of Indonesia were used as research samples. This method is known as saturated sampling. The research model in this study adopts research conducted by Montesdioca (2016) [15]. The model used is as follows in Figure 2:
H1. 
HRIS system quality: significant influence on HRIS user satisfaction.
H2. 
HRIS information quality: significant influence on HRIS user satisfaction.
H3. 
HRIS service quality: significant influence on HRIS user satisfaction.
H4. 
System quality, information quality, and service quality simultaneous effect on HRIS user satisfaction.

3. Results

3.1. Respondent Profile

Respondents’ profile can be seen in Table 1.
Table 1 demonstrates that 33 percent of respondents, or 29 individuals, are male, whereas 67 percent, or 58 individuals, are female. Based on Table 1 there were 43 people (49 percent) with a bachelor’s degree, 6 people with a master’s degree (seven percent), eighteen people with a diploma (21 percent), and 20 with a high school (23 percent). Twenty-eight people (32 percent) are between the ages of 20 and 30. Twenty people (23 percent) belong to the age range of 31 to 41 years, whereas 39 people (45 percent) are over the age of 41. The average number of people who have been using HRIS for more than a year is 67 (77 percent).

3.2. Validity and Reability

3.2.1. Validity

Validity test was conducted with a sample of 87 respondents using an SPSS program. An instrument was considered valid if the results were rvalue ≥ rtable.
Based on the Table 2, existing variables produce rvalue ≥ rtable (0.2108). Thus, it can be concluded that all variables can be declared valid.

3.2.2. Reliability

Based on the Table 3, the reliability test value of three independent and one dependent variable is known. It can be concluded that the four indicators are “reliable” or “consistent” because the cronbach alpha value is exceed 0.60.

3.3. Multiple Regression Analysis

3.3.1. F Test

Based on the F test results, see Table 4, it can be seen that the sig value is less than 0.05, indicating that H0 is rejected. In other words, system quality, information quality, and service quality have a significant influence on HRIS user satisfaction simultaneously.

3.3.2. T Test

Based on the t-test results in Table 5, it can be seen that hypothesis 1 has a p value > 0.05, indicating that H1 rejected. It can be determined that the system’s quality has no partial significant effect on user satisfaction. For hypothesis 2, it has a p value < 0.05 and its mean H0 rejected. It can be concluded that the information quality has a partial significant effect on user satisfaction. For hypothesis 3, it has a p value < 0.05, and its mean H0 rejected. It can be concluded that service quality has a partial significant effect on user satisfaction.
The coefficient of determination is seen in Table 6. Based on Table 6 R Square value is 0.765. This value indicates that 76.5 percent of the variance in user satisfaction it can be predicted from system quality, information quality, and service quality simultaneously; 24.6 percent is influenced by other variants.
Based on the test results, see Table 7. The equation regression is written as follows:
US = 1.886 + 0.161 QS + 0.186 QI + 0.313 SQ
Based on equation regression 1 this indicates that user satisfaction (US) is 1.886, assuming system quality (QS), information quality (QI), and service quality (SQ) are indeed 0. The equation regression 1 shows the β1 value = 0.161, a one point increase in system quality (QS), can be predicted increases of 0.161 points in user satisfaction (US). The β2 value equals 0.186, followed by a one point increase in information quality (QI), can be predicted increases of 0.186 points in user satisfaction(US). The β3 value = 0.313, a one point increase in the service quality(SQ), can be predicted increases of 0.313 points in user satisfaction(US).

4. Discussion

Based on Table 5, this study confirms that there are two significant variable, i.e: service quality (SQ) and information quality (QI). The coefficient value of the service quality (0.313, p < 0.05) is higher than other variables. We consider the public organization has been implemented a service excellent to HRIS user. Proven with the helpdesk support and training utilization HRIS applications. This finding is accordance with Widiastuti [16], that service quality influences HRIS user satisfaction. When users are satisfied, the level of system usage increase.
The coefficient value of information quality (0.186, p < 0.05). This study confirms the research of Seddon and Kiew (1996), who argued that quality of information has a positive influence on user satisfaction. The positive influence is because most HRIS users can use the information that is generated by the system and assist users in the capacity of human resources [17]. Based on open questions, it can be seen that this system is considered not to meet expectations due to a slow support network.

Author Contributions

Conceptualization, S.S. and A.F.D.; methodology, S.S.; software, S.S.; validation, S.S. and H.Y. and B.A.; formal analysis, S.S.; investigation, A.F.D.; resources, A.F.D.; data curation, S.S.; writing—original draft preparation, A.F.D.; writing—review and editing, S.S. All authors have read and agreed to the published version of the manuscript.

Funding

This research no received external funding.

Informed Consent Statement

Informed consent was obtained from all subjects involved in the study.

Data Availability Statement

The data presented in this study are available on request from the corresponding author.

Conflicts of Interest

The authors declare no conflict of interest.

References

  1. Al-Dalaien, M.A.A.; Alheety, S.N.Y.; Alzubi, M.M. Role of MIS Functions in Enhance the Business Processes and Operational Excellence of the Banks. Int. J. Res. Sci. Innov. 2020, VII, 154–166. [Google Scholar]
  2. Gupta, B. Human Resource Information System (HRIS): Important Element of Current Scenario. IOSR J. Bus. Manag. 2013, 13, 41–46. [Google Scholar] [CrossRef]
  3. Menant, L.; Gilibert, D.; Sauvezon, C. The Application of Acceptance Models to Human Resource Information Systems: A Literature Review. Front. Psychol. 2021, 12, 1–14. [Google Scholar] [CrossRef] [PubMed]
  4. Sancoko, S.; Shalsabilla, Z.; Al, B.; Yuliawan, R. Evaluation of Employee Acceptance of the IMS Application at PT Sarana Utama Adimandiri: TAM Approach. ILKOM J. Ilm. 2022, 14, 74–79. [Google Scholar] [CrossRef]
  5. Strohmeier, S. Research in e-HRM: Review and implications. Hum. Resour. Manag. Rev. 2007, 17, 19–37. [Google Scholar] [CrossRef]
  6. Chakraborty, A.R.; Mansor, N.N.A. Adoption of Human Resource Information System: A Theoretical Analysis. Procedia-Soc. Behav. Sci. 2013, 75, 473–478. [Google Scholar] [CrossRef] [Green Version]
  7. Aldmour, R.; Obeidat, B.; Masa’deh, R.; Almajali, D. The Practice of HRIS Applications in Business Organizations in Jordan: An Empirical Study. Conf. Proc. 2015, 2, 553–574. [Google Scholar]
  8. Al-Adaileh, R.M.d. An evaluation of information systems success: A user perspective—The case of jordan telecom group. Eur. J. Sci. Res. 2009, 37, 226–239. [Google Scholar]
  9. al Shibly, H. Human Resources Information Systems success assessment: An integrative model. Aust. J. Basic Appl. Sci. 2011, 5, 157–169. [Google Scholar]
  10. “Munich Personal RePEc Archive What is the Meaning of Quality?”. Available online: https://mpra.ub.uni-muenchen.de/57345/1/MPRA_paper_57345.pdf (accessed on 1 October 2022).
  11. Pawirosumarto, S. Pengaruh Kualitas Sistem, Kualitas Informasi dan Kualitas Layanan Terhadap Kepuasan Pengguna Sistem E-Learning. J. Ilm. Manaj. 2016, 6, 416–433. [Google Scholar]
  12. DeLone, W.H.; McLean, E.R. Information systems success: The quest for the dependent variable. Inf. Syst. Res. 1992, 3, 60–95. [Google Scholar] [CrossRef] [Green Version]
  13. Laumer, S.; Maier, C.; Weitzel, T. Information quality, user satisfaction, and the manifestation of workarounds: A qualitative and quantitative study of enterprise content management system users. Eur. J. Inf. Syst. 2017, 26, 333–360. [Google Scholar] [CrossRef]
  14. DeLone, W.H.; McLean, E.R. The DeLone and McLean model of information systems success: A ten-year update. J. Manag. Inf. Syst. 2003, 19, 9–30. [Google Scholar]
  15. Montesdioca, G.P.Z.; Macada, A.C.G. Quality dimensions of the DeLone-McLean model to measure user satisfaction: An empirical test on the information security context. In Proceedings of the 2015 48th Hawaii International Conference on System Sciences, Kauai, HI, USA, 5–8 January 2015; pp. 5010–5019. [Google Scholar]
  16. Widiastuti, R.; Haryono, B.S.; Said, A. Influence of System Quality, Information Quality, Service Quality on User Acceptance and Satisfaction and Its Impact on Net Benefits (Study of Information System Users Lecturer Performance Load (BKD) in Malang State University). HOLISTICA–J. Bus. Public Adm. 2019, 10, 111–132. [Google Scholar] [CrossRef]
  17. Seddon, P.B.; Kiew, M. A Partial Test and Development of Delone and McLean’s Model of IS Succes. Australas. J. Inf. Syst. 2020, 24, 90–109. [Google Scholar]
Figure 1. Updated IS Success Model (DeLone & McLean 2003).
Proceedings 83 00032 g001
Figure 2. Research Model.
Proceedings 83 00032 g002
Table 1. Respondents’ Profile.
CategoryFreqPercent
GenderMale2933%
Female5867%
Education levelS2/Master67%
S1/Bachelor4349%
D3/Diploma1821%
SMA/High School2023%
Age20–30 years2832%
31–41 years2023%
>41 years3945%
Utilize HRIS0 until 1 years2023%
>1 years6777%
Table 2. Validity test.
Indicatorr-Test
Quality Sistem (QS)QS10.700 **
QS20.751 **
QS30.763 **
QS40.642 **
QS50.704 **
Information Quality (QI)QI10.633 **
QI20.633 **
QI30.803 **
QI40.779 **
QI50.785 **
QI60.654 **
Sevice Quality (SQ)SQ10.690 **
SQ20.769 **
SQ30.766 **
SQ40.786 **
SQ50.828 **
User Satisfaction(US)US10.684 **
US20.875 **
US30.836 **
US40.833 **
**. Correlation is significant at the 0.01 level (2-tailed)
Table 3. Reliability test.
IndicatorCronbach Alpha
System Quality (QS)0.745
Information Quality (QI)0.817
Service Quality (SQ)0.824
User Satisfaction (US)0.824
Table 4. F test.
Table 4. F test.
Model FSig.
1Regression38.9520.000(a)
Residual
Total
Table 5. T Test.
Table 5. T Test.
ModeltSig.
1(Constant)1.7370.086
QS1.9220.058
QI2.4050.018
SQ3.7950.000
Table 6. Model Summary.
ModelRR Square
10.765a0.585
Table 7. Regression.
ModelUnstandardized Coefficients
BStd. Error
1(Constant)1.8862.923
QS0.1610.111
QI0.1860.118
SQ0.3130.123
Disclaimer/Publisher’s Note: The statements, opinions and data contained in all publications are solely those of the individual author(s) and contributor(s) and not of MDPI and/or the editor(s). MDPI and/or the editor(s) disclaim responsibility for any injury to people or property resulting from any ideas, methods, instructions or products referred to in the content.

