1. Introduction
Animal feed production in 2020 will grow by around 5–6 percent compared to the realization in 2019. The feed industry players say that the production potential in 2021 could be more than 20.67 million tons. The Chairman of the Association of Animal Feed Entrepreneurs (GPMT) said that the positive projection was driven by the potential for increasing consumption of animal protein from livestock activities. About 70% of the total production cost is the cost of feed and feed supply, which is the main factor in increasing livestock productivity. The feed industry plays an important role in this regard. However, the availability of local feed raw materials is very dispersed with a small supply source capacity, so it is necessary to develop factories on small or medium scales. In addition, the location of ruminant farms is widespread so that the feed industry tends to be decentralized. Based on these things, the small–medium scale ruminant feed industry is considered appropriate to be developed. To maximize these opportunities, the small and medium scale feed industry must manage its production planning properly so that it is efficient and effective. The main goal of feed mills is to make nutritional and safe feed products at the lowest possible cost so as to maximize profits. This is in line with the wishes of consumers who are certainly looking for feed products at low prices but that which provide maximum nutrition for the performance of their livestock. Therefore, feed formulation plays an important role in the feed industry.
In the formulation process, the problem faced is that factories often use information about standard feed raw materials whose availability does not align with the supplier’s ability. Therefore, the amount and type of feed product produced is highly dependent on the availability of supply. There are at least four types of concentrated feed products, namely dairy cattle, beef cattle, heifers and calves.
To overcome these problems, it is necessary to have a production planning model and integrated feed formulation accounting for both supply and demand and to consider variations in the source of feed raw materials. This model supports industrial application with precision production in the feed industry. This model has the following advantage: it can accommodate complexities in the production planning of the feed industry, such as the large number and type of products, the large number and type of feed raw materials, the demand that must be met and the fluctuating supply.
The integration model between production management and feed formulation provides maximum benefits for more consistent feed raw materials, cheaper raw material costs, more accurate planning and better traceability.
The production planning model that was developed is based on mixed-integer linear programming (MILP) with the objective function of maximizing profit and the function of limiting the supply ability of suppliers and the nutritional adequacy requirements of each concentrate product.
Defective products are one of the problems faced by companies. The more defective products produced by the company, the more inefficient and effective the company is. Production that produces defects economically will lead to higher production costs.
In order to integrate the quality improvement of supply chain management in the feed industry, we looked previous examples. The study by [
1] can be an example because it includes formulated feed products using both linear and stochastic programming techniques with various probability levels by knowing the average and standard deviation of each type of nutrition in various suppliers. By using the simulation, it helps suppliers to make quality improvements appropriately. In general, this study shows that the integration between supply chain management and feed formulators will provide the benefits of more consistent feed raw material quality, cheaper raw material costs, more accurate planning, better traceability and improved supplier performance. However, [
1] only focuses on quality aspects and did not describe a production optimization model on a certain planning horizon that is integrated with both distributors and suppliers.
A study on the integrated model of production and distribution planning by considering stochastic was carried out by [
2] in the supply chain of the milk processing industry. The model developed took into account the variability of raw materials for fresh milk and the demand for various dairy products. The model’s two-stage stochastic mixed-integer linear programming can be used as an example in model development. However, the characteristics of feed mills are different from those of the dairy industry because the variability in quantity, type and quality is more in the procurement of raw materials, while the dairy industry is more in the variation of the finished product. In addition, the model is still too complex, so it does not match the characteristics of the small- and medium-sized feed industry.
The study by [
3] compared three formulation methods, namely, least cost, maximum profit and stochastic models, to maximize feed mill profits. The study shows that the maximum profit and stochastic approaches that use variations in production and market data will provide more economical capacity decisions and increase flexibility. However, the research [
3] only focused on profit optimization in the feed factory, which is not yet integrated with supply and distribution in a feed industry supply chain. The authors of [
4] developed a multi-period, multi-product closed-loop chain model with a multi-stage stochastic approach to design and plan supply chains under uncertain conditions. The purpose of the developed model is to minimize costs while maximizing profits. In general, the model developed based on mixed-integer linear programming can be used as an example in model development in the feed industry. Authors of [
5] used linear programming to plan broiler feed production, and [
6] optimized the feed product formula so that raw material costs are low but nutritional requirements are met. The two studies serve as a reference in optimizing the product planning model that considers the product formula.
2. Method
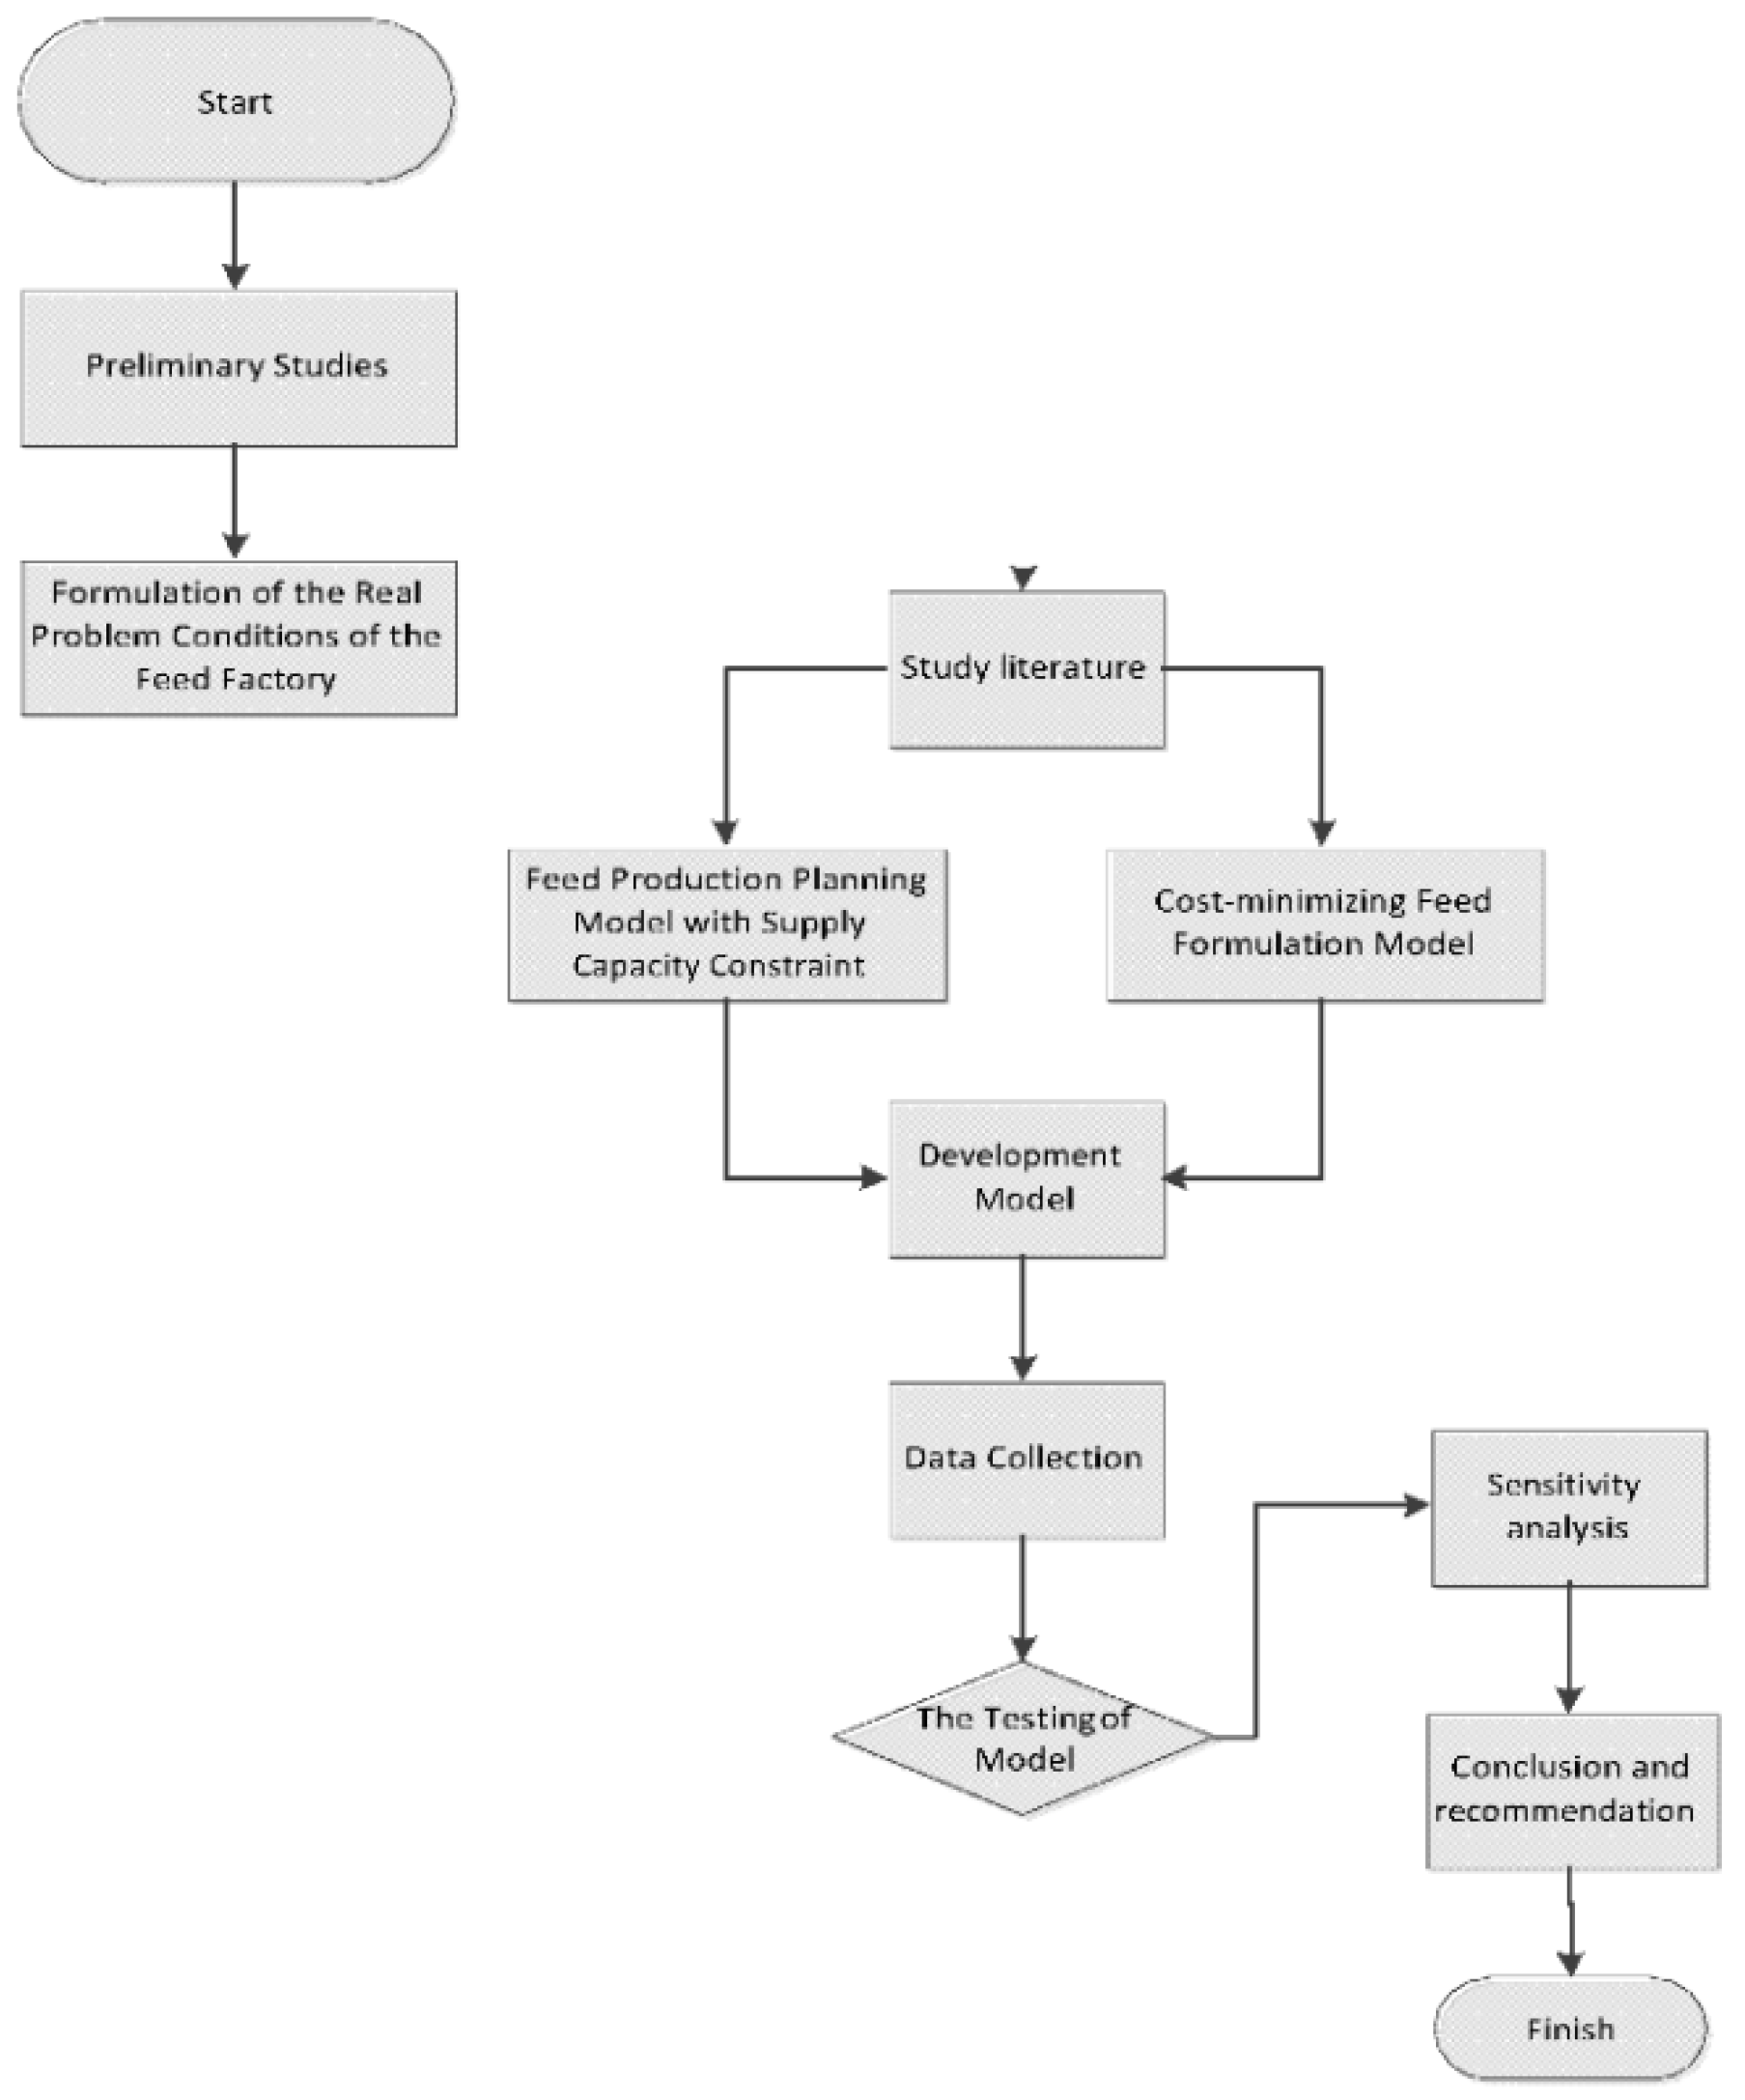
The flow chart shows how the stages of problem solving with the concept or model were developed. The initial stage was to conduct a study with the aim of knowing the relationship between parameters and variables. Here are the steps in detail:
Conduct an introductory study by describing the scope of the research study by collecting data obtained from written documents and direct interviews with feed mills. There are two locations for the feed mills to be sampled for the case study, namely, CV ABC, is located in Klaten. This stage produces a complete picture of the production system in the feed mill. Next, identify the reference model obtained from the literature study and adjust it to the limitations and assumptions used, the cost components used and the decision variables used. To characterize the real system in the feed mill, determine the variables included in the model and formulate a mathematical model. Reference model [
2], which is a production and distribution planning model in the dairy industry supply chain, will be adapted to the case of the feed industry with a feed formulation model from [
3]. This stage produces an influential diagram or rich picture diagram that describes the detailed relationships of each variable. Configure the planning model for the feed industry supply chain with mixed-integer linear programming (MLLP). The output produced at this stage is a mathematical model of production planning that is relevant in the planning period horizon. The model helps make optimal decisions as to what, how much, and when to produce. Conduct a sensitivity analysis to find out how far the changes in production planning and performance criteria are from changes in parameters such as the average and nutritional standard deviation of feed ingredients. The result obtained in this stage is the robustness of the developed model. The flow of this research is explained in the
Figure 1.
3. Result
3.1. Production System in Ruminant Feed Factory CV.ABC
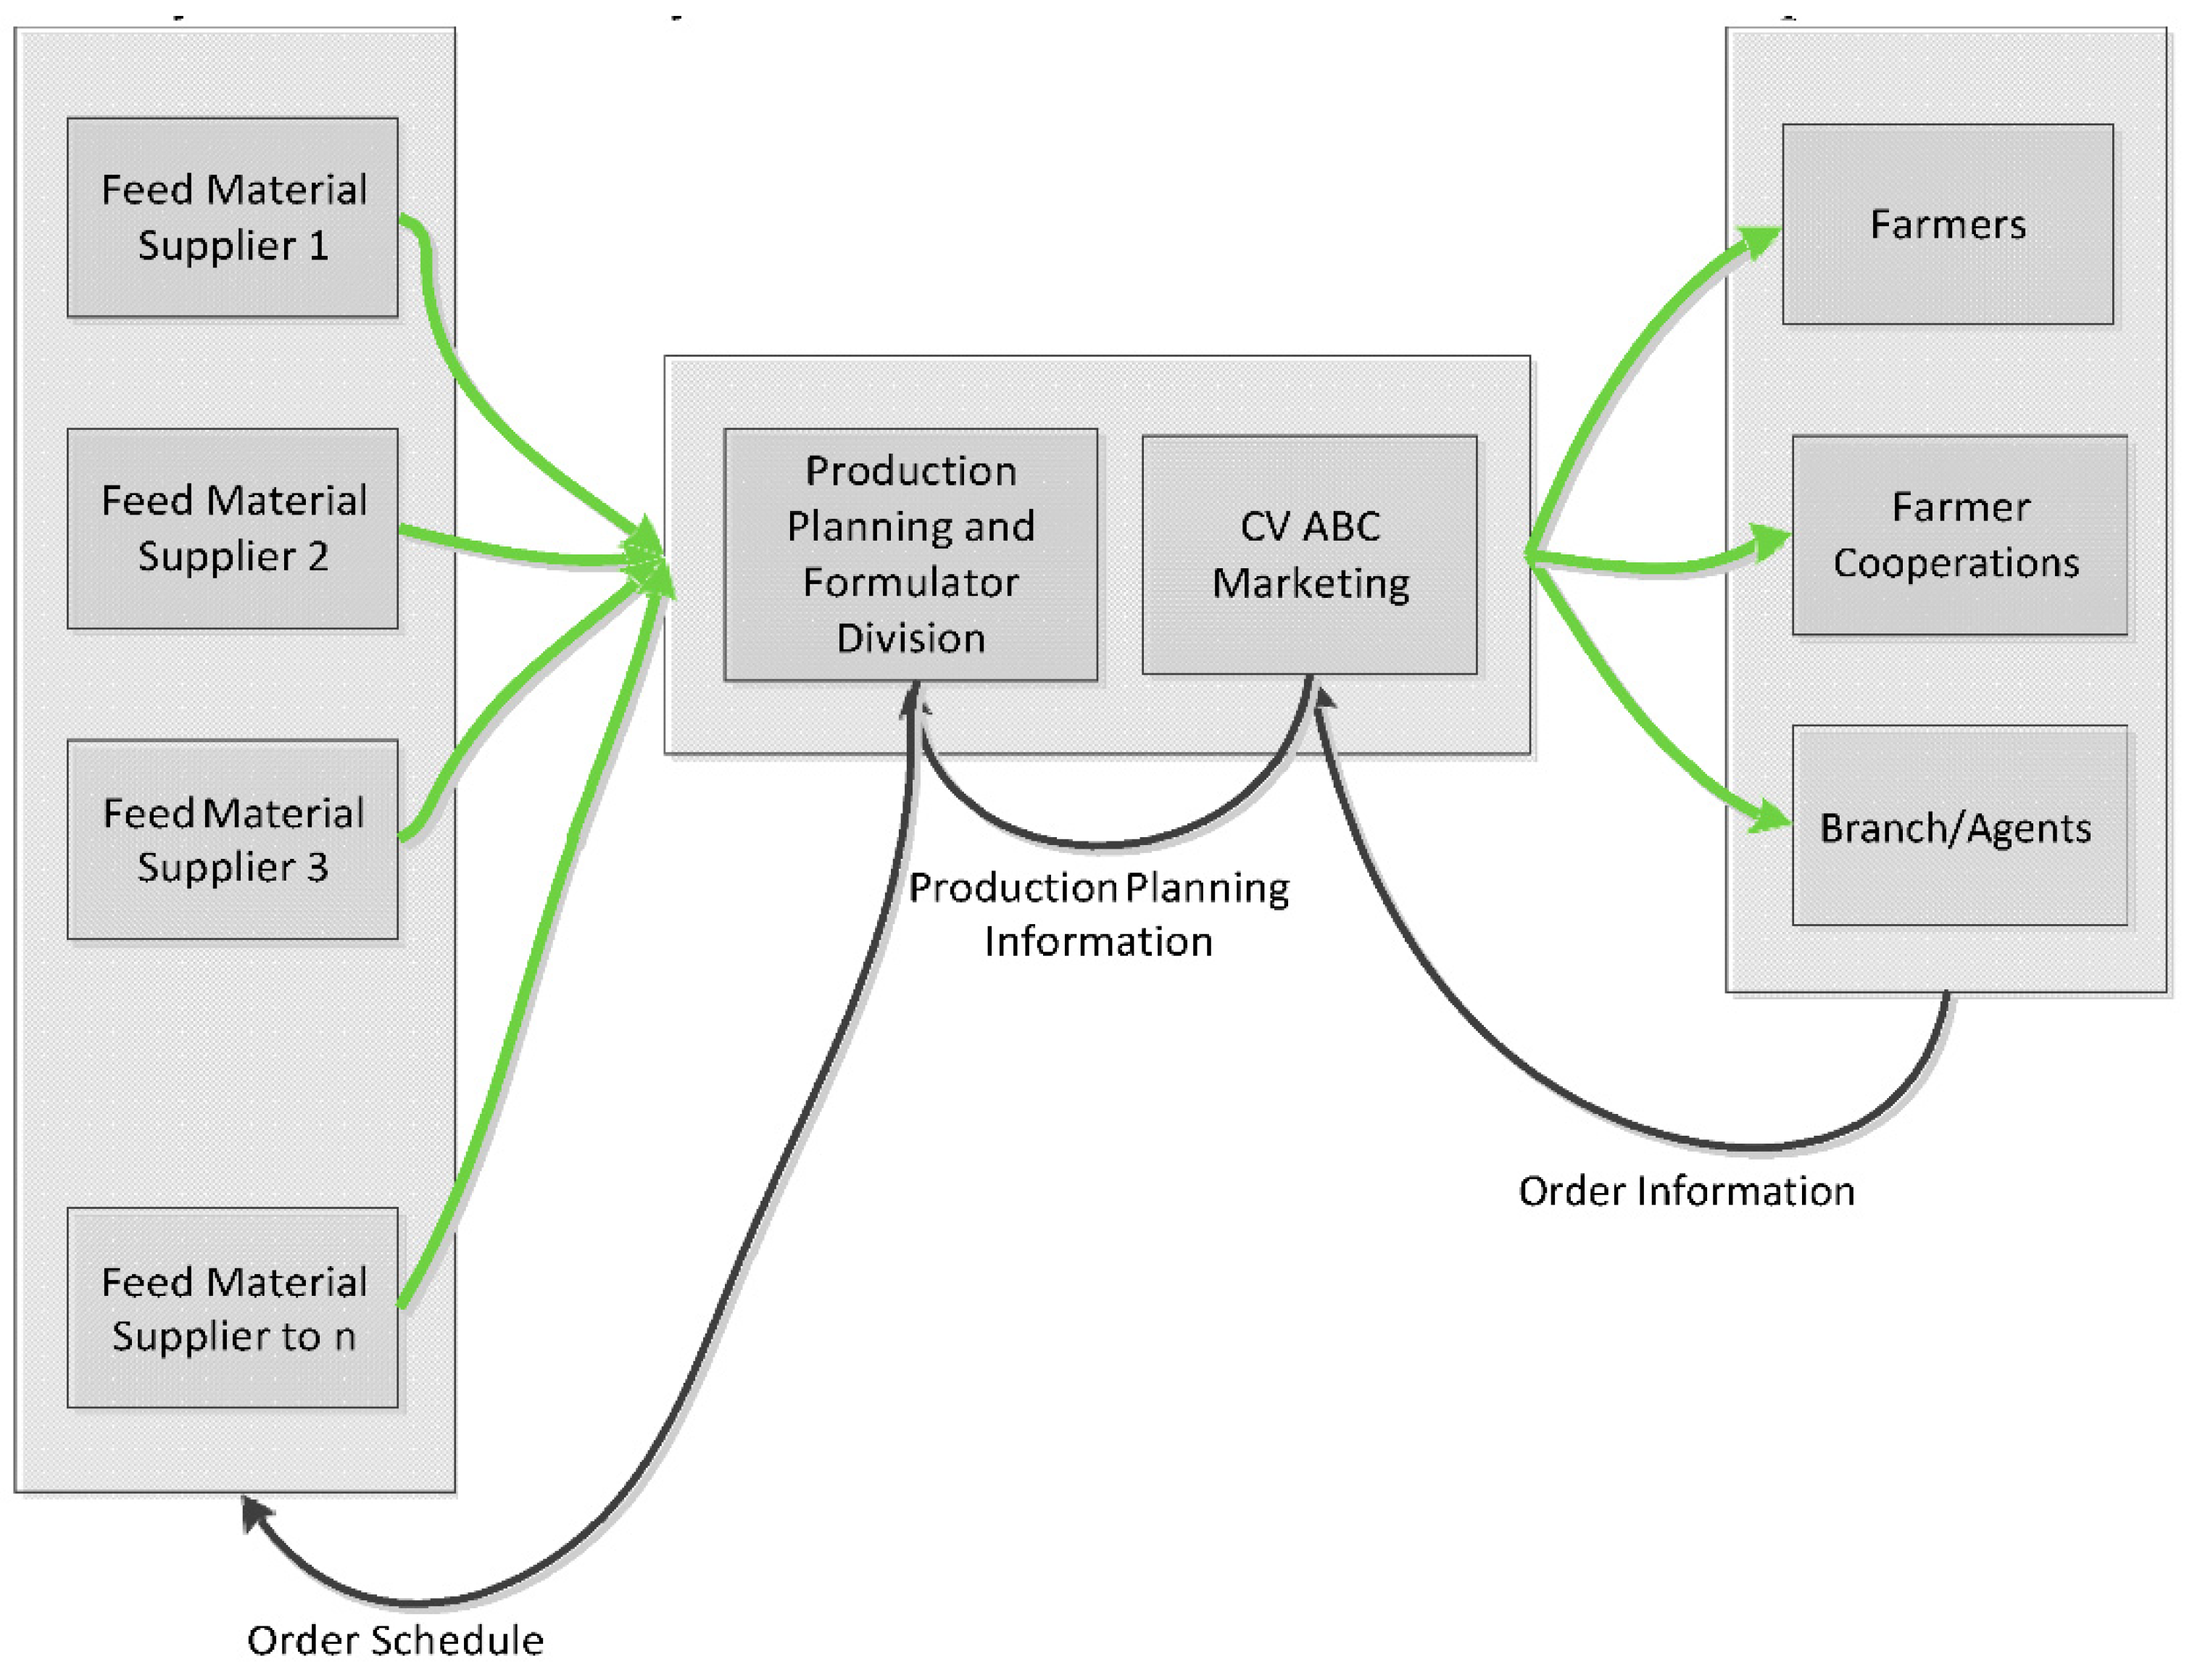
The product is in the form of cow concentrate with two types, namely, beef cattle and dairy cattle. Each concentrate product has certain nutritional adequacy requirements according to the standards determined by CV.ABC, taking into account SNI. Feed raw materials are taken from various suppliers whose capacity is known. Concentrate buyers consist of three categories, namely, direct farmers, farmer cooperatives and branch agents.
Based on the systemic aspect, a mathematical model of production planning was formed which has the structural characteristics of determining the amount of production of each type of concentrate product owned by the industry in a certain period: one processing unit belonging to the cooperative and one scheduling period. The market consists of direct dairy farmers, distributor branch agents and cooperatives for traditional farmers and home industries. The following is
Figure 2, which shows the relationship between actors in the supply system modeled. The relationship between actors is indicated by the flow of money, the flow of information and the flow of products.
3.2. Characterization of Real Systems in Feed Mills
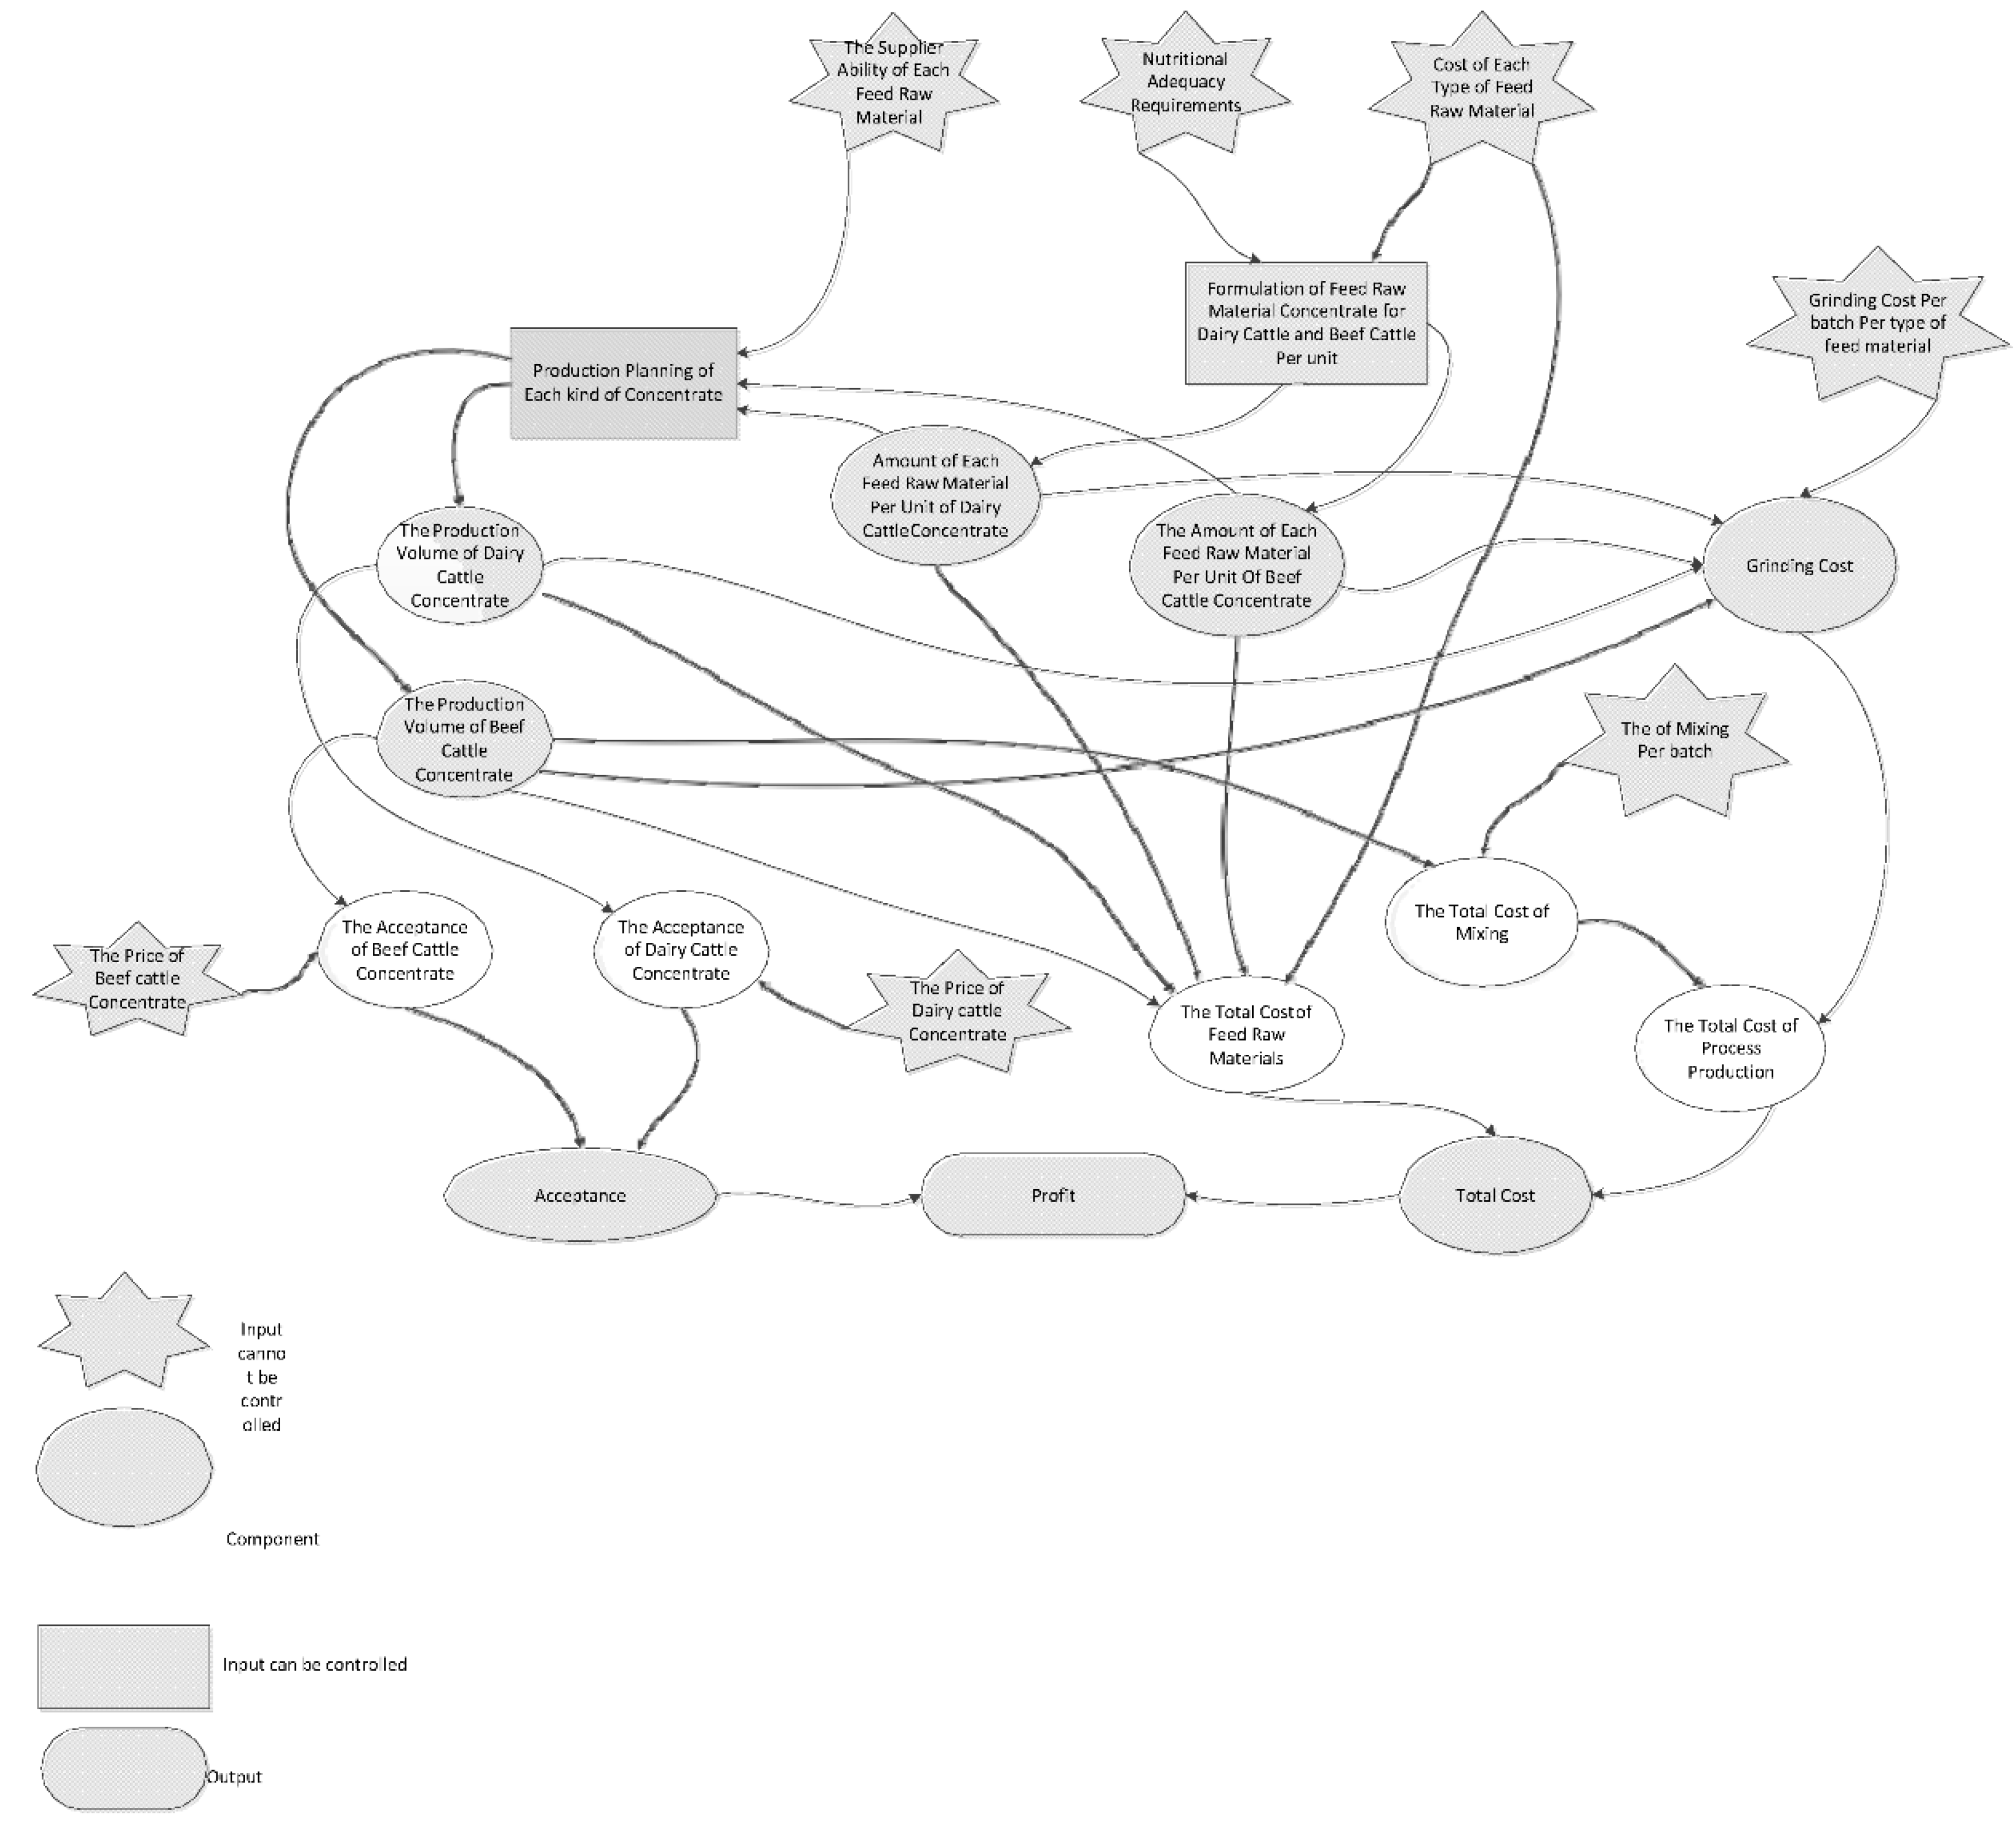
The discussion on characterization includes systemic aspects and components of the model to be developed. Systemic aspects include structural aspects, functional aspects, boundaries and system environment, while the model components consist of performance criteria and explanations of variables that enter the model so that it can determine which are the decision variables, parameters and model limiting equations. To help understand the logical relationship between model components, influence diagrams are used.
CV.ABC determines the amount of each feed ingredient, derived from the annual budget draft (RAB). RAB are taken from estimated marketing orders, then sent to the formulator and planned every month. Then procurement looks for suppliers from anywhere to meet the needs of feed raw materials per month. This process does not involve the capacity of suppliers, so there is the potential for not obtaining materials and having an impact on company profits. Those process are revealed by the
Figure 3.
3.3. Formulation Model
The variables that have been identified and differentiated are controlled inputs, uncontrolled inputs and components; then a mathematical model is formed based on the logical relationship of each variable. In formulating the model and making it easier to achieve a solution, certain assumptions are needed. The model uses mixed-integer linear programming (MILP) production planning. The notations and variables that were used for model development consist of index notation, parameter notation and decision variable notation. Symbols of parameters and decision variables in the model is showed in
Table 1.
The assumption is as follows:
The supplier capacity of each feed ingredient is known with certainty.
Terms of nutritional adequacy using SNI.
The nutritional content of the ingredients is known and is deterministic.
Market demand and prices are known and deterministic.
Planning period in static time.
Mathematical Model
Complete mathematical model that has been developed objective function: Max Z
Supplier Capacity Limiter,
3.4. Model Implementation
In the implementation of the model, data were inputted into the model in the form of supplier capacity of each type of feed ingredient per month, the price of feed ingredients, nutritional adequacy as a measure of CV.ABC quality, the price of concentrate products and production costs. Parameters of supply capability of each type of feed and its price is showed in
Table 2. Parameters of concentrate product prices, process costs and nutritional requirement is showed
Table 3. Parameters of nutrient content and cost of each feed ingredient is represented in
Table 4.
Table 2.
Parameters of supply capability of each type of feed and its price.
Table 2.
Parameters of supply capability of each type of feed and its price.
| J ke- | Symbol | Description | Supplier Capacity
(ton) | Price (Rp/Kg) |
|---|
| 1 | S1 | Coffee skin | 48 | 1000 |
| 2 | S2 | Rice bran | 61 | 2800 |
| 3 | S3 | Wheat bran | 33 | 4600 |
| 4 | S4 | Onggok | 40 | 1900 |
| 5 | S5 | Gaplek | 20 | 3100 |
| 6 | S6 | Oil palm | 250 | 2225 |
| 7 | S7 | CGF | 37 | 3175 |
| 8 | S8 | Drops | 2.3 | 2710 |
| 9 | S9 | Copra meal (coconut meal) | 12.9 | 3825 |
| 10 | S10 | Stir-fried Corn | 207 | 1325 |
| 11 | S11 | Peanut shell | 173 | 1000 |
Table 3.
Parameters of concentrate product prices, process costs and nutritional adequacy requirements according to the quality of CV.ABC in 1 kg of concentrate feed.
Table 3.
Parameters of concentrate product prices, process costs and nutritional adequacy requirements according to the quality of CV.ABC in 1 kg of concentrate feed.
| Production | Product Price (Hi) | Processing Fee (CMi) | Demand (min)
(kg) | K = 1 | K = 2 | K = 3 | K = 4 | K = 5 | K = 6 | K = 7 | K = 8 |
|---|
Dry Ingredients
(Min) | Ash Content (Maks) | Crude Protein
(Min) | Crude Fat (Maks) | Calcium (Ca)
(Min-Maks) | Pospor (Maks) | Coarse Fiber (Maks) | TDN
(Min) |
|---|
Lactation dairy cow concentrate
(I = 1) | 2350 | 10 | 300 | 86 | 13.75 | 13 | 5 | 0.95–1.2 | 0.6 | 16 | 67.5 |
Fattening beef concentrate
(I = 2) | 2200 | 11 | 350 | 86 | 14.6 | 10 | 7 | 0.8–1.2 | 0.6 | 16.2 | 65 |
Table 4.
Parameters of nutrient content and cost of each feed ingredient (Tjk).
Table 4.
Parameters of nutrient content and cost of each feed ingredient (Tjk).
| No | Feed
Ingredients | BK | Abu | PK | LK | SK | BetaN | TDN | Ca | P |
|---|
| 1 | Coffee skin | 70 | 11.3 | 9.94 | 1.97 | 18.17 | 58.6 | 50.6 | 0.68 | 0.2 |
| 2 | Rice bran | 90.2 | 12.4 | 10 | 14.4 | 16.3 | 44.2 | 67.9 | 0.07 | 1.38 |
| 3 | Wheat bran | 87 | 1.8 | 12.6 | 1.7 | 2.6 | 81.3 | 68 | 0.07 | 0.36 |
| 4 | Onggok | 79.8 | 2.4 | 1.87 | 0.32 | 8.9 | 85.5 | 78.3 | 0.2 | 0.1 |
| 5 | Gaplek | 79.5 | 4.69 | 2.6 | 0.7 | 5.67 | 66.3 | 78.5 | 0.17 | 0.09 |
| 6 | Oil palm | 90.9 | 4.6 | 18.7 | 2.8 | 20.2 | 53.7 | 79 | 0.27 | 0.66 |
| 7 | CGF | 94.6 | 4.5 | 32.3 | 10.2 | 17.3 | 35.7 | 75.4 | 0.20 | 0.55 |
| 8 | Drops | 73 | 14.6 | 5.5 | 1 | 0.1 | 78.8 | 70.7 | 0.92 | 0.07 |
| 9 | Copra meal | 89.8 | 7 | 23.5 | 2.8 | 16.8 | 59.9 | 78.7 | 0.07 | 0.65 |
| 10 | Stir-fried
Corn | 88.0 | 9.14 | 8.0 | 2.4 | 11.7 | 68.68 | 51.16 | 0.26 | 0.16 |
| 11 | Peanut shell | 91.6 | 5.20 | 7.0 | 2.0 | 65.9 | 19.90 | 48.0 | 0.24 | 0.07 |
- b.
Solution model
Based on the optimization using Lingo version 19 with the syntax in
Supplementary Materials, the results of the production planning in January 2022 are as follows in
Table 5:
3.5. Sensitivity Analysis
This analysis was carried out to determine changes in profits and the planned amount of production if there is a change in product prices. The effect of price fluctuation on production planning decisions is given by
Table 6 and
Table 7.
Based on the results of sensitivity analysis to the price changes, it can be seen that price changes will affect the production of beef cattle concentrate, while the dairy cattle concentrate does not change the amount of production. This is because it is more profitable to produce beef cattle than dairy cattle. Production of beef cattle concentrate icrease, while dairy cattle concentrate will be kept to a minimum as long as the demand for dairy cattle concentrate is met. However, the feed ingredients used are not equipped with premixes, and vitamins are the only main feed ingredients available, so the real profit will be lower than the results of the optimization calculation. At least the model can describe the relations of production planning to the profits obtained by the small feed industry.


