Abstract
During the transition from neonate to adulthood, brain maturation establishes coherence between behavioral states—wakefulness, non-rapid eye movement, and rapid eye movement sleep. Few studies have characterized and analyzed cerebral rhythms and the sleep–wake cycle in early ages, in relation to adulthood. Since the analysis of sleep in early ages can be used as a predictive model of brain development and the subsequent emergence of neural disturbances in adults, we performed a study on late neonatal and adult wild-type C57BL/6 mice. We acquired longitudinal 24 h electroencephalogram and electromyogram recordings and performed time and spectral analyses. We compared both age groups and found that late neonates: (i) spent more time in wakefulness and less time in non-rapid eye movement sleep, (ii) showed an increased relative band power in delta, which, however, reduced in theta during each behavioral state, (iii) showed a reduced relative band power in beta during wakefulness and non-rapid eye movement sleep, and (iv) manifested an increased total power over all frequencies. Given the mice–human age equivalence, the data presented here might have implications for the clinical context in the analysis of electroencephalogram and sleep-based early and late diagnosis after injury or neurodegeneration.
1. Introduction
Sleep is a state of cerebral activity that is regulated by different brain structures, including the hypothalamus, brain stem, and basal ganglia. The time and depth of sleep is influenced by the circadian rhythm and the duration of previous wakefulness. The sleep–wake cycle is controlled by the suprachiasmatic nuclei (SCN) of the hypothalamus, which aligns a central circadian clock with the light/dark cycle [1]. Sleep plays an important role in neonatal development by promoting learning and memory consolidation [2,3]. Studies in rodents have shown that sleep facilitates neural maturation and prevents apoptosis in developing brains [4,5]. Brain maturation establishes coherence between behavioral states—wakefulness, non-rapid eye movement (NREM), and rapid eye movement (REM) sleep. During development, the time spent in REM sleep slowly decreases, while time spent in wakefulness and NREM sleep increases [2,6,7].
The involvement of NREM and REM sleep in human brain physiology can be inferred by the comorbidity of sleep disorders (SDs) in a great majority of cerebrovascular and neurodegenerative disorders (NDs). Similarly, NREM and REM impairment have been shown to precede the subsequent development of many brain disorders [8,9,10]. For example, in Alzheimer’s disease (AD), the most common cause of dementia in older adults, sleep is highly fragmented, with a circadian disruption leading to daytime hypersomnia and nighttime insomnia. In Parkinson’s disease (PD), it is known that neuronal death in the substantia nigra pars compacta (SNpc) is linked to a reduced amount of time spent in REM sleep [11], which is accepted to be a supportive diagnostic criterion, and increased sleep fragmentation has also been reported [8,9,11].
Changes in the sleep–wake cycle are identifiable by dynamic variations in the electroencephalogram (EEG) band powers. An increase in the low-frequency bands, such as delta (δ) and theta (θ), has been linked to sleep. Specifically, an increase in δ corresponds to NREM sleep, while an increase in both δ and θ corresponds to REM sleep [12]. High-frequency bands, such as alpha (α), beta (β), and gamma (γ), are associated with wakefulness and cognitive function [12]. Abnormal cerebral rhythms have been also found in a variety of NDs. For example, AD mouse models exhibit a decrease in low band frequencies (δ and θ) and an increase in high band frequencies (α and β) [13]. A recent longitudinal study on PD patients suggests increased θ band power and decreased dominant (peak) frequency as biomarkers for disease progression, given their correlation with cognitive decline. PD features an EEG shift to low band frequencies [14].
Sleep disorders might predict the functional outcome in several pathologies, but early EEG/sleep abnormalities might be associated with the initial impairment of neural networks before clinical signs manifest [8,10]. In a pioneer study, poor linguistic ability in early life was translated into poor cognitive function and dementia six decades later [15]. This was hypothetically related to the appearance of subtle neuropathologic changes in early life that conditioned the brain’s evolution towards dementia and AD. Thus, features extracted from brain activity and sleep–wake cycles in rodent models might be relevant as diagnostic biomarkers for neurodegeneration. However, very few studies have characterized and analyzed these features in the neonatal stage, in relation to adult age. Better knowledge concerning the homeostatic EEG rhythms and light/dark-induced sleep–wake cycle in healthy rodents might provide clues during the neonatal–adult transition and help us to understand how specific brain pathologies might impair these homeostatic signals at a very early age before abnormal sensorimotor and cognitive dysfunctions take place under injury and neurodegeneration.
2. Materials and Methods
Animals. Male C57BL/6 mice were housed under 12-h light/dark phases with food and water ad libitum. Mice were manipulated by male and female experimenters. All experiments were conducted with the approval of the Research Ethics Committee at the Universidad Politécnica de Madrid, Madrid, Spain, and complied with local and national ethical and legal regulations regarding the use of mice in research.
Surgery. Neonatal mice received surgery for placement of EEG electrodes at the age of 30 days, and adult mice at the age of 3 months. Starting from the day of surgery, each animal was housed in a separate cage. Surgery was performed under anesthesia (ketamine, an NMDA receptor antagonist; Imalgene, Merial, Lyon, France, 80 mg/kg, i.p.) and tranquilizer (xylazine, alpha-2 adrenergic receptor agonist; Rompun, Bayer, Leverkusen, Germany, 10 mg/kg, i.p.). Once pedal withdraw reflex ceased, the skin was prepared with iodopovidone (Betadine, Avrio Health L.P., Stamford, CT) and alcohol wipes. After a small midline vertical incision to expose the skull was made, small craniotomies were performed at electrode locations (specified below) using a dental drill (NSK, Tokyo, Japan, MIO-230). In total, five electrodes were implanted. Two stainless steel screw electrodes (Plastics One Inc., Roanoke, VA, USA) were implanted into the skull over the left and right frontal cortex (AP +0.5 mm; L ±2.0 mm from bregma) as surface EEG recording electrodes. One stainless steel screw electrode was implanted in the neck muscle as an EMG recording electrode. Two additional stainless steel screw electrodes were placed over the left and right parietal cortex (AP −3.0 mm; L ±2.0 mm from bregma) as ground and reference electrodes, respectively. Once the skull dried, the coated portion of the wires was secured to the skull using gel glue (Henkel, Düsseldorf, Germany, Loctite 454) and was covered with dental cement (DuraLay, Lancashire, United Kingdom, Inlay Pattern Resin Powder and Liquid). The wires were connected to the header (Plastics One Inc., Roanoke, VA, USA, MS363), which was angled towards the ceiling. Mice received buprenorphine (0.05 mg/kg) and recovered in a warmed chamber for one hour prior to returning to a standard housing environment.
EEG and EMG recordings. Longitudinal EEG and EMG recordings were acquired in 24 h sessions and split into 12 h light/dark phases. Mice were transferred to the recording room one week prior to recording sessions to allow for recovery and habituation. Freely moving mice were placed in a circular cage with a standard housing environment with food and water ad libitum. A flexible cable was attached to the header (Plastics One Inc., Roanoke, VA, USA) on the head and connected to single-channel AC amplifiers (Grass, West Warwick, RI, USA, 78D) that included 50 Hz. notch filter for power line frequency removal. Bilateral cortical EEG signals and EMG signal were acquired using the right parietal electrode as a reference and the signals amplified at 8.000X with 0.3–100 Hz. (EEG) and 30–100 Hz. (EMG) band-pass filters (CyberAmp, Axon Instruments, San Jose, CA, USA, 380). Signals were analog-to-digital converted (National Instruments, Austin, TX, USA, BNC-2090A) at a sampling frequency of 500 Hz. and recorded with LabVIEW Biomedical Toolkit software (National Instruments, Austin, TX, USA).
Sleep–wake analysis. Behavioral states (wakefulness, NREM, and REM sleep) were determined by the analysis of EEG and EMG recordings with AccuSleep [16], a mouse-specific, semi-automated sleep–wake scoring algorithm written in MATLAB (The MathWorks, Natick, MA, USA, R2018b). The epoch length was set to 2.5 s. First, 24 h signal integrity and cleanliness (lack of noise) was confirmed. Second, some epochs of each state were scored manually by an expert scorer according to standard criteria. Third, these epochs were used for subject-specific calibration, namely the computation of mixture z-scoring parameters. Fourth, we performed the automated classification of behavioral states with the neural network provided with the package, which was trained and validated on data scored at the same epoch length. Fifth, we revised manually the classification. For spectral analysis, we calculated the power within the 0–250 Hz. frequencies with 375 bin size (the frequency resolution of each spectral line equals 0.666 Hz.).
3. Results
In this work, we analyzed the sleep–wake cycle and characterized the patterns of electrical activity in late neonatal and adult mice [17].We used C57BL/6 mice, a preclinical strain very often used in neurobiology to model several neuropathological conditions, including NDs. For this, we acquired longitudinal EEG and EMG recordings in 24 h sessions, split into 12 h-light and 12 h-dark phases, during two consecutive days per week, for two weeks (Figure 1A). Behavioral states (wakefulness and NREM and REM sleep) were determined by spectral analysis of EEG and EMG recordings in neonatal (Figure 1B) and adult (Figure 1C) mice. Note that neonatal mice showed signal amplitudes that were 2.5 times greater than adult mice, which translated into higher EEG total powers (Figure 1D). In addition, neonatal mice showed increased power in the 12 h-dark phase, compared to the 12 h-light phase. In adult mice, the total power remained constant throughout the recording sessions in both the 12 h-light and 12 h-dark phases.
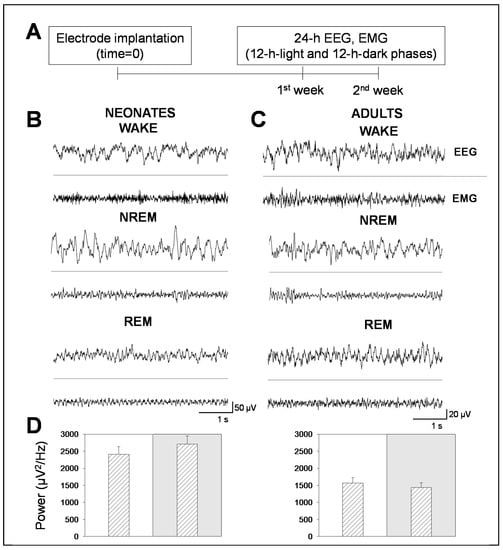
Figure 1.
Electroencephalogram (EEG) and electromyogram (EMG) recordings in neonatal and adult mice. (A) Experimental design for EEG and EMG longitudinal recordings in mice. Following electrode implantation and a post-surgical recovery period, mice were recorded during two consecutive weeks in continuous 48 h recording sessions per week. (B,C) Representative 5 s EEG and EMG traces of behavioral states (wakefulness, non-rapid eye movement (NREM), and rapid eye movement (REM) sleep in neonatal (left) and adult (right) mice. (D) Bars represent the total power within the 0–100 Hz. frequencies in neonatal (left panel) and adult (right panel) mice. White or gray backgrounds represent 12 h-light or 12 h-dark phase, respectively. The graphs below show the total power as a function of the recording time in a 24 h period. Data shown as mean ± SEM of either 18 or 27 recordings retrieved from 6 neonatal or 11 adult mice, respectively.
This difference in total power between adult and neonatal mice might be explained by the greater activity that neonatal mice undergo at night and by their developing brain. In order to prove so, we performed a time analysis of the sleep–wake cycle. We confirmed that the percentage of time spent in wakefulness was higher in neonatal than in adult mice, and the opposite occurred in NREM sleep. We found that neonatal mice spent more time in wakefulness than in NREM sleep during the 12 h-light phase, while adult mice did not (Figure 2A vs. Figure 3A). Remarkably, we found no significant differences, between age groups, in the percentage of time spent in REM sleep, which was independent of the light/dark cycle (Figure 2A vs. Figure 3A).
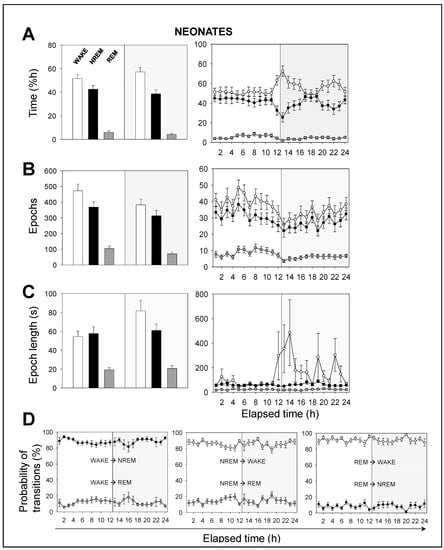
Figure 2.
Sleep–wake characterization in neonatal mice. (A) Percentage of time spent, (B) total number of epochs, and (C) epoch length. White, black, and gray bars represent wakefulness, NREM, and REM sleep states, respectively. Parameters in A, B, and C are calculated during a total of 12 h-light (white background) or 12 h-dark (gray background) phases (left panels) or across the recording time within the 24 h period (right panels). (D) Probability of behavioral state transitions for every hour during the recording session (1–24 h). Left panel: From wakefulness into NREM and REM sleep. Middle panel: From NREM sleep into wakefulness and REM sleep. Right panel: From REM sleep into wakefulness and NREM sleep. White, black, and gray circles represent wakefulness, NREM, and REM sleep states, respectively. Data shown as mean ± SEM of 18 recordings retrieved from 6 neonatal mice.
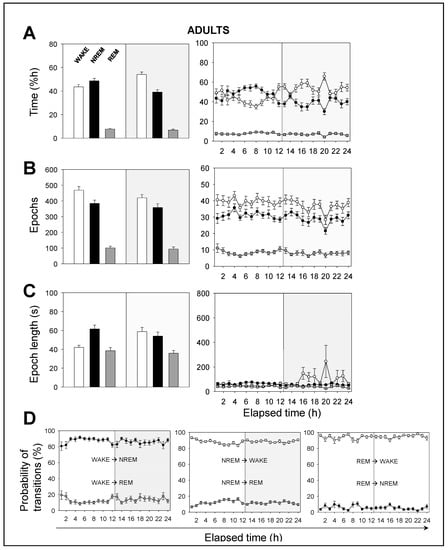
Figure 3.
Sleep–wake characterization in adult mice. (A) Percentage of time spent, (B) total number of epochs, and (C) epoch length. White, black, and gray bars represent wakefulness, NREM, and REM sleep states, respectively. Parameters in A, B, and C are calculated during a total of 12 h-light (white background) or 12 h-dark (gray background) phases (left panels) or across the recording time within the 24 h period (right panels). (D) Probability of behavioral state transitions for every hour during the recording session (1–24 h). Left panel: From wakefulness into NREM and REM sleep. Middle panel: From NREM sleep into wakefulness and REM sleep. Right panel: from REM sleep into wakefulness and NREM sleep. White, black, and gray circles represent wakefulness, NREM, and REM sleep states, respectively. Data shown as mean ± SEM of 27 recordings retrieved from 11 adult mice.
Hourly data trends during the recording session confirmed that both neonatal and adult mice, overall, (i) spent more time sleeping during the 12 h-light phase, and (ii) spent more time awake during the 12 h-dark phase (Figure 2A vs. Figure 3A). This behavior is expected due to rodents being prey and avoiding diurnal predators. Note that the trends slightly shift a few hours before the phase transitions, meaning that the circadian cycle is synchronized with the external conditions. In order to understand these results, we computed the number of epochs and the epoch lengths that corresponded to each behavioral state. In neonates (Figure 2B,C), the number of epochs for each behavioral state, especially for wakefulness, decreased during the 12 h-dark phase. Wakefulness epochs were longer at nighttime than they were at daytime, while those of NREM and REM sleep remained steady. In adults, the number of epochs for each behavioral state tended to reduce during the recording session, showing slightly higher values at daytime than those at nighttime (Figure 3B,C). Wakefulness epochs were longer at nighttime than they were at daytime, contrary to NREM sleep epochs. Note that NREM sleep epochs were prolonged at daytime and were only slightly shorter at nighttime. Collectively, comparing neonatal and adult mice, we noticed that neonatal mice showed longer wakefulness epochs, especially at nighttime, and shorter REM sleep epochs, overall (Figure 2C and Figure 3C). As for the number of epochs, neonatal mice showed a slight reduction for each behavioral state, especially at nighttime, correlating with the phase transition (Figure 2B and Figure 3B).
The probability of transitions in behavioral states was similar in both neonatal and adult mice (Figure 2D and Figure 3D). Hourly data trends during the recording session showed mid-phase (6 hours elapsed time) shifts, which confirmed the higher probability of transitions from NREM sleep to wakefulness than from NREM to REM sleep (86% vs 14%, for neonates), from wakefulness to NREM sleep than from wakefulness to REM sleep (88% vs. 12%), and from REM sleep to wakefulness than from REM to NREM sleep (91% vs. 9%). That is, transitions between behavioral states in mice shift in periods of 6 hours from the start or end of the light phases, reaching mid-phase plateaus. Thus, the sleep–wake cycle slowly adapts to the external changes and prepares for the next state.
Next, we performed a spectral analysis of the sleep–wake cycle in order to examine the behavior of neonatal and adult mice with respect to the patterns of brain rhythmicity. We found brain maturation signs associated with the EEG relative power within the 0–35 Hz. frequencies for each behavioral state during the 12 h-light and 12 h-dark phases (Figure 4A). While intragroup (comparing a single age group) behavior did not differ, intergroup (comparing both age groups) behavior did. Adult mice showed the expected trends for relative power (Figure 4A): wakefulness was predominantly characterized by δ rhythms and a smaller θ component, NREM sleep showed a predominant δ component, and REM sleep featured a strong θ component. The differences between neonatal and adult mice were the following (Figure 4A): in neonatal age, each behavioral state showed (i) a stronger δ component, especially during wakefulness and NREM sleep, and (ii) a reduced θ component, especially during wakefulness and REM sleep. In order to evaluate these differences more closely, we computed the behavioral-state-dependent relative band power for neonatal and adult mice (Figure 4B). There were no remarkable differences in the relative band power between both light phases for any frequency band within either age group. Within the delta (δ) frequency band, neonates were characterized by a greater relative power than adults for each behavioral state. Wakefulness showed the greatest relative power, followed closely by that of NREM sleep. Within the theta (θ) frequency band, we found the opposite pattern: adults were characterized by a higher relative power than neonates for each behavioral state. REM sleep showed the greatest relative power. Within α (and β, during wakefulness and NREM sleep) frequency bands, we concluded the same as for the θ frequency band upon the neonate–adult pattern, but with overall smaller relative band powers for each behavioral state (Figure 4B and Figure A1).
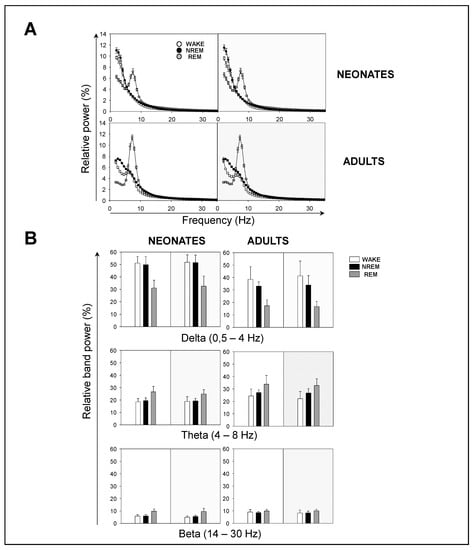
Figure 4.
Sleep–wake EEG spectra during behavioral states in neonatal and adult mice. (A) Influence of light/dark cycle in the relative power of EEG during behavioral states in neonatal (top panels) and adult (bottom panels) mice. (B) Relative band power of EEG in delta (δ), theta (θ), and beta (β) during behavioral states. Data shown as mean ± SEM of either 18 or 27 recordings retrieved from 6 neonatal or 11 adult mice, respectively.
Although the contribution of sigma (σ) and γ frequency bands was very small, noticeable intergroup differences were that adults showed a stronger σ component during NREM, and a stronger γ component during wakefulness (Figure A1). Overall, we concluded that neonatal mice showed an increased relative δ band power, and a decreased relative θ (and β, during wakefulness and NREM sleep) band power, in comparison to adult mice.
4. Discussion
A deeper understanding of sleep during the transition from early to adult ages might help us to better understand brain development and even to identify biomarkers that can be studied in ND models with relevance in a clinical context. In this sense, only a few studies have analyzed sleep in neonatal mice. A pioneer study in 1985 compared the sleep–wake cycle of early neonatal C57BL/6 and BALBc mice aged 5–28 days [4]. More recently, in 2018, a study compared the sleep–wake cycle of early neonatal C57BL/6 and CD-1 mice aged 7 and 14 days [2] and another research compared mice with mixed genetic background (SV129/CDA/C57), aged 9–21 days [18], and revealed their sleep–wake cycle neonatal evolution through a spectral analysis of EEG and EMG, reporting that behavioral states were not reflected in EEG until the 12th postnatal day. In 2013, the sleep–wake cycle of adult and old C57BL/6 mice aged 2–4 and 22–24 months was compared, concluding an increased sleep fragmentation with aging [19]. A more recent, similar study of C57BL/6 mice aged 3 and 12 months confirmed this conclusion and, more importantly, added it to the statement that adult mice show several common features with human sleep with aging, such as an increased time spent sleeping and increased time spent awake during the active and inactive phases, respectively [20]. Nevertheless, and to our knowledge, no specific EEG analysis regarding the late neonatal–adult transition (equivalent to pediatric–adult human ages) has been performed in the C57BL/6 strain, a genetic background that has been extensively introduced into wild-type and genetically modified mice to mimic cerebrovascular diseases and NDs [21,22,23]. Therefore, in this study, we characterized the sleep–wake cycle and electrical brain activity of mice in two different age groups: (i) neonatal mice aged 30 days, equivalent to human infants aged 8 years, and (ii) mice aged 3 months, because of their correlation with human adults aged 22 years [17].
Neonatal mammals spend more time in REM sleep, a fact that is probably linked to the development of neuronal circuitry [2,6,7,24]. Early neonatal humans spend 50% of their time in REM sleep at birth, but 40% at 3–5 months and 30% between 1 and 2 years [25]. However, in our case, we did not detect differences in the time spent in REM sleep between neonatal and adult mice. This fact is probably ascribed to the time of the EEG recording in late neonatal mice (30 days), a time point that probably reflects maturity sufficiently for REM sleep to not be as dominant as in early neonatal mice.
By contrast, our results showed a behavioral-state-independent reduction in θ band frequencies in late neonatal mice with respect to adult mice. While the EEG analysis differed, our results are in agreement with [18,19] for neonates and adults, respectively, and are consistent with the hypothesis that θ band components develop at a later, juvenile stage, which is similar to humans [25].
It has been previously described that total power increases with maturation in early neonatal mice, but this was not compared to adult mice [18]. Our results point to a greater total power in late neonatal mice than in adult mice. That is, total power would be very low in infant mice. In early neonatal mice, it would steadily increase up to the late neonatal stage. At this time, the total power would be very high. Eventually, at a later, juvenile stage, the total power would drop to typical adult amplitudes. We hypothesize that aging would also have an effect on total power so that the amplitudes shown in elderly mice might differ to those in adults. This is supported by [26], carried out in healthy humans, which found age-dependent changes in EEG complexity, and band powers. Namely, they showed a parabolic evolution of fractal dimension (and therefore, band powers) with aging.
Four main experimental findings can be extracted from our study (Figure 5). Late neonatal mice (i) spent more time in wakefulness and less time in NREM sleep than adult mice, (ii) showed a reduced relative θ band power compared to adult mice, as well as an increased relative δ band power in neonatal mice compared to adult mice, (iii) showed a reduced relative band power in β during wakefulness and NREM sleep, and (iv) showed a higher total power over all frequencies.
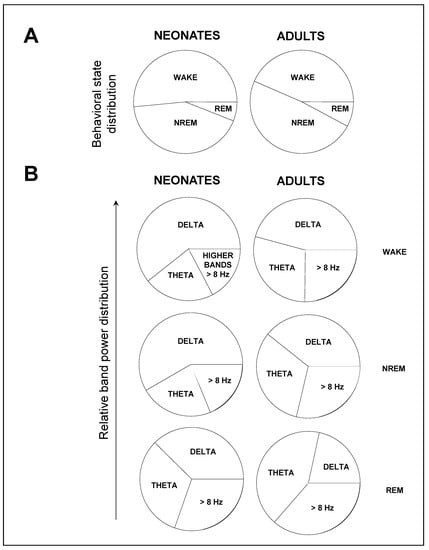
Figure 5.
Main findings on the sleep–wake cycle patterns during neonate to adult transition. Data shown from the 12 h-light phase, whose trends are representative of those from the 12 h-dark phase. (A) Late neonatal mice spent more time in wakefulness and less time in NREM sleep. (B) Late neonatal mice showed an increased relative δ band power, and a reduced relative θ band power—and β band power during wakefulness and NREM sleep—compared to adult mice. Data shown as mean ± SEM of either 18 or 27 recordings retrieved from 6 neonatal or 11 adult mice, respectively.
Our conclusions agree with those presented by [18], regarding the relative δ and θ band power, and by [26], regarding the relative β band power, and provide additional insights into late neonatal development and a comparison with adult features, also in agreement with [19,20]. Our methodology is confirmed with the results on adult C57BL/6, and provides novel data regarding late neonatal C57BL/6. Conceptually, these sleep–wake cycle differences are linked to brain maturation, since, overall, the brain shifts to higher frequencies through the neonatal–adult transition [7,18,27].
In advanced phases of ND, EEG and sleep abnormalities might serve as diagnostic features, and may aid in predicting functional outcomes of disease progression. Two recent epidemiologic studies, one longitudinal and the other cross-sectional, found that (i) midlife insomnia is associated with a higher risk of late-life dementia [28], and (ii) insomnia in individuals at risk of AD is associated with both cognitive and brain structural patterns, respectively [29]. It remains to be studied whether these brain structural differences are caused by sleep disturbance itself or whether they are due to a higher vulnerability resulting from other traits.
Moreover, early-life EEG analysis might constitute an under-explored biomarker with the potential for preclinical and prodromal diagnosis in NDs. A study in children aged 2–8 years with a follow-up of 3 years found that NREM sleep is a necessary component to brain maturation; namely, the ratio of frontal/occipital slow wave activity is an EEG biomarker that predicts myelin content [30]. Another study in Tg2576 transgenic mice aged 1.5 months, a prodromal asymptomatic age, found that neurogenesis is altered as an early event in AD prior to Aβ accumulation and neurodegeneration [31]. These studies support the idea that EEG biomarkers in neonates might be of interest as predictors of abnormal brain development that might end up in neural impairments and symptoms of NDs in adulthood. For this purpose, it is necessary to understand the development of EEG-based biomarkers and sleep–wake cycle in healthy. In future studies, we propose to use the methodology presented in this study for comparison of these biomarkers in ND models with the C57BL/6 background.
Author Contributions
G.d.A. and D.G.-N. conceived the idea and supervised the whole project; M.A.H., R.G., and M.R. performed experiments; M.A.H., G.d.A., and D.G.-N. analyzed data and interpreted results; and M.A.H., G.d.A., and D.G.-N. wrote the paper. All authors have read and agreed to the published version of the manuscript.
Funding
This research was funded by the Ministerio de Economía y Competitividad with the grant number MAT2016-79832-R (to D.G.-N.), and funds from the Comunidad de Madrid with the grant numbers Neurocentro-B2017/BMD-3760 and PEJD-2018-PRE/SAL-8832 (to M.A.H. and G.d.A.).
Institutional Review Board Statement
The study was conducted according to the guidelines of the Declaration of Helsinki, and approved by the Institutional Review Board of Universidad Politécnica de Madrid and the Community of Madrid (authorization number PROEX 108.0/20). All procedures were performed under the Spanish Regulations for animal experimentation (Law 53/2013) and according to the ARRIVE (Animal Research: Reporting In Vivo Experiments) guidelines.
Acknowledgments
We would like to thank Soledad Martínez for their technical assistance.
Conflicts of Interest
The authors declare no conflict of interest.
Appendix A

Figure A1.
Relative band power of EEG during behavioral states in neonatal and adult mice. Relative band power of EEG in alpha (α), sigma (σ), and gamma (γ) during behavioral states. Data shown as mean ± SEM of either 18 or 27 recordings retrieved from 6 neonatal or 11 adult mice, respectively.
References
- Zisapel, N. New perspectives on the role of melatonin in human sleep, circadian rhythms and their regulation. Br. J. Pharmacol. 2018, 175, 3190–3199. [Google Scholar] [CrossRef]
- Prados-Pardo, Á.; Prieto-Soler, S.Y.; Domínguez-del-Toro, E. Postnatal Development of Sleep-Wake Cycle in Wild-Type Mice. In Advances in Cognitive Neurodynamics (VI); Delgado-García, J.M., Pan, X., Sánchez-Campusano, R., Wang, R., Eds.; Springer: Singapore, 2018; pp. 303–308. [Google Scholar]
- Tarullo, A.R.; Balsam, P.D.; Fifer, W.P. Sleep and infant learning. Infant Child Dev. 2011, 20, 35–46. [Google Scholar] [CrossRef]
- Daszuta, A.; Gambarelli, F. Early postnatal development of EEG and sleep-waking cycle in two inbred mouse strains. Dev. Brain Res. 1985, 22, 39–47. [Google Scholar] [CrossRef]
- Morrissey, M.J.; Duntley, S.P.; Anch, A.M.; Nonneman, R. Active sleep and its role in the prevention of apoptosis in the developing brain. Med. Hypotheses. 2004, 62, 876–879. [Google Scholar] [CrossRef] [PubMed]
- Mirmiran, M. The importance of fetal/neonatal REM sleep. Eur. J. Obstet. Gynecol. Reprod. Biol. 1986, 21, 283–291. [Google Scholar] [CrossRef]
- Mirmiran, M.; Maas, Y.G.H.; Ariagno, R.L. Development of fetal and neonatal sleep and circadian rhythms. Sleep Med. Rev. 2003, 7, 321–334. [Google Scholar] [CrossRef] [PubMed]
- Abbott, S.M.; Videnovic, A. Chronic sleep disturbance and neural injury: Links to neurodegenerative disease. Nat. Sci. Sleep 2016, 8, 55–61. [Google Scholar]
- Malkani, R.; Attarian, H. Sleep in Neurodegenerative Disorders. Curr. Sleep Med. Rep. 2015, 1, 81–90. [Google Scholar] [CrossRef][Green Version]
- Minakawa, E.N.; Wada, K.; Nagai, Y. Sleep disturbance as a potential modifiable risk factor for alzheimer’s disease. Int. J. Mol. Sci. 2019, 20, 803. [Google Scholar] [CrossRef]
- McDowell, K.A.; Shin, D.; Roos, K.P.; Chesselet, M.F. Sleep dysfunction and EEG alterations in mice overexpressing alpha-synuclein. J. Parkinsons Dis. 2014, 4, 531–539. [Google Scholar] [CrossRef]
- Rabiller, G.; He, J.W.; Nishijima, Y.; Wong, A.; Liu, J. Perturbation of brain oscillations after ischemic stroke: A potential biomarker for post-stroke function and therapy. Int. J. Mol. Sci. 2015, 16, 25605–25640. [Google Scholar] [CrossRef]
- Kent, B.A.; Strittmatter, S.M.; Nygaard, H.B. Sleep and EEG Power Spectral Analysis in Three Transgenic Mouse Models of Alzheimer’s Disease: APP/PS1, 3xTgAD, and Tg2576. J. Alzheimers Dis. 2018, 64, 1325–1336. [Google Scholar] [CrossRef]
- Geraedts, V.J.; Boon, L.I.; Marinus, J.; Gouw, A.A.; van Hilten, J.J.; Stam, C.J.; Tannemaat, M.R.; Contarino, M.F. Clinical correlates of quantitative EEG in Parkinson disease: A systematic review. Neurology 2018, 91, 871–883. [Google Scholar] [CrossRef]
- Snowdon, D.A.; Kemper, S.J.; Mortimer, J.A.; Greiner, L.H.; Wekstein, D.R.; Markesbery, W.R. Linguistic ability in early life and cognitive function and Alzheimer’s disease in late life: Findings from the Nun Study. J. Am. Med. Assoc. 1996, 275, 528–532. [Google Scholar] [CrossRef]
- Barger, Z.; Frye, C.G.; Liu, D.; Dan, Y.; Bouchard, K.E. Robust, automated sleep scoring by a compact neural network with distributional shift correction. PLoS ONE 2019, 14, e0224642. [Google Scholar] [CrossRef]
- Dutta, S.; Sengupta, P. Men and mice: Relating their ages. Life Sci. 2016, 152, 244–248. [Google Scholar] [CrossRef]
- Rensing, N.; Moy, B.; Friedman, J.L.; Galindo, R.; Wong, M. Longitudinal analysis of developmental changes in electroencephalography patterns and sleep-wake states of the neonatal mouse. PLoS ONE 2018, 13, e0207031. [Google Scholar] [CrossRef]
- Wimmer, M.E.; Rising, J.; Galante, R.J.; Wyner, A.; Pack, A.I.; Abel, T. Aging in mice reduces the ability to sustain sleep/wake states. PLoS ONE. 2013, 8, e81880. [Google Scholar] [CrossRef] [PubMed]
- Soltani, S.; Chauvette, S.; Bukhtiyarova, O.; Lina, J.M.; Dubé, J.; Seigneur, J.; Carrier, J.; Timofeev, I. Sleep–Wake Cycle in Young and Older Mice. Front. Syst. Neurosci. 2019, 13, 51. [Google Scholar] [CrossRef] [PubMed]
- McBride, D.W.; Zhang, J.H. Precision Stroke Animal Models: The Permanent MCAO Model Should Be the Primary Model, Not Transient MCAO. Transl. Stroke Res. 2017, 8, 397–404. [Google Scholar] [CrossRef]
- Neff, E.P. Animal models of Alzheimer’s disease embrace diversity. Lab. Anim. (NY) 2019, 48, 255–259. [Google Scholar] [CrossRef]
- Konnova, E.A.; Swanberg, M. Animal Models of Parkinson’s Disease. In Parkinson’s Disease: Pathogenesis and Clinical Aspects; Stoker, T.B., Greenland, J.C., Eds.; Codon Publications: Brisbane, Australia, 2018; pp. 83–106. [Google Scholar]
- Brown, R.E.; Basheer, R.; McKenna, J.T.; Strecker, R.E.; McCarley, R.W. Control of sleep and wakefulness. Physiol. Rev. 2012, 92, 1087–1187. [Google Scholar] [CrossRef] [PubMed]
- Eisermann, M.; Kaminska, A.; Moutard, M.L.; Soufflet, C.; Plouin, P. Normal EEG in childhood: From neonates to adolescents. Neurophysiol. Clin. 2013, 43, 35–65. [Google Scholar] [CrossRef] [PubMed]
- Zappasodi, F.; Marzetti, L.; Olejarczyk, E.; Tecchio, F.; Pizzella, V. Age-related changes in electroencephalographic signal complexity. PLoS ONE 2015, 10, e0141995. [Google Scholar]
- Grigg-Damberger, M.M. The visual scoring of sleep in infants 0 to 2 months of age. J. Clin. Sleep Med. 2016, 12, 429–445. [Google Scholar] [CrossRef]
- Sindi, S.; Kåreholt, I.; Johansson, L.; Skoog, J.; Sjöberg, L.; Wang, H.X.; Johansson, B.; Fratiglioni, L.; Soininen, H.; Solomon, A.; et al. Sleep disturbances and dementia risk: A multicenter study. Alzheimer’s Dement. 2018, 14, 1235–1242. [Google Scholar] [CrossRef]
- Grau-Rivera, O.; Operto, G.; Falcón, C.; Sánchez-Benavides, G.; Cacciaglia, R.; Brugulat-Serrat, A.; Gramunt, N.; Salvadó, G.; Suárez-Calvet, M.; Minguillon, C.; et al. Association between insomnia and cognitive performance, gray matter volume and white matter microstructure in cognitively unimpaired adults. Alzheimer’s Res. Ther. 2019; in press. [Google Scholar] [CrossRef]
- LeBourgeois, M.K.; Dean, D.C.; Deoni, S.C.L.; Kohler, M.; Kurth, S. A simple sleep EEG marker in childhood predicts brain myelin 3.5 years later. NeuroImage 2019, 199, 342–350. [Google Scholar] [CrossRef]
- Scopa, C.; Marrocco, F.; Latina, V.; Ruggeri, F.; Corvaglia, V.; La Regina, F.; Ammassari-Teule, M.; Middei, S.; Amadoro, G.; Meli, G.; et al. Impaired adult neurogenesis is an early event in Alzheimer’s disease neurodegeneration, mediated by intracellular Aβ oligomers. Cell Death Differ. 2020, 27, 934–948. [Google Scholar] [CrossRef]
Publisher’s Note: MDPI stays neutral with regard to jurisdictional claims in published maps and institutional affiliations. |
© 2020 by the authors. Licensee MDPI, Basel, Switzerland. This article is an open access article distributed under the terms and conditions of the Creative Commons Attribution (CC BY) license (https://creativecommons.org/licenses/by/4.0/).