1. Introduction
The term additive manufacturing (AM) is associated with a category of processes where the desired part is produced through the successive addition of material in layers, in a predetermined path created by information obtained directly from a three-dimensional (3D) geometric computational representation of the component. This representation is in the form of a 3D geometric model originated from a CAD (computer-aided design) system [
1].
This category of processes has shown advances in recent years, both in terms of technological development and in popularity for industry applications. Moreover, in certain cases, for production purposes in small businesses and in academic research [
2,
3,
4].
The use of this technology has advantages over traditional machining and forming processes, such as a better use of the material. Since the part is produced by adding up materials only in the necessary dimensions, there are no losses in the form of chips, an inevitable residue in the cutting processes, and any leftover material can be reused after minimal treatment. There is no need to use cutting tools, fasteners, and coolants. There is also the possibility of obtaining complex geometries that are difficult to produce by subtractive processes, such as machining, and which would result in the need for additional processing or unwanted changes to the design of the part [
2].
Just as there are advantages, this technology also has disadvantages compared to traditional production methods, especially in the matter of large-scale production. Among them: part size limitations due to suboptimal material resistance; long manufacturing time; low stiffness; imperfections in non-horizontal surfaces due to the approximation that is made of a curve (the surface’s “silhouette”) from a large number of “sides” (stacking of the layers); low predictability; and general product quality [
2,
5,
6,
7].
Among AM methods, one of the most popular and widespread is the fused deposition modeling (FDM). A process in which the material, usually a polymeric one, is deposited in the form of a thin filament through a heated extrusion process. The movement in the XY plane, usually achieved by combining movement from the bed and from the extruder, is responsible for defining the shape of the layer. When one layer is completed, the process moves on to the next one by raising the nozzle or lowering the bed, depending on printer models variations. With the material deposited, its solidification occurs as a result of its cooling or a chemical reaction [
1].
Apart from the general limitations mentioned above, the FDM process can suffer from a variety of problems that result in defects and/or failures in the produced part. In a proportion dependent on the manufacturer and the equipment model [
8]. In addition, it is also necessary to carefully consider the values chosen for the parameters used and the operation of the slicer software involved. The slicer is responsible for converting the part tridimensional model generated into G Code, a language used to describe the necessary sequence of movements performed by the 3D printer, to produce the part. It is in the slicer that the infill pattern of the piece is chosen. The choice of these operational and pre-processing parameters in the slicer are important because, in certain situations, even small parametric variations, coupled with favorable environmental conditions, can facilitate the appearance of defects, such as bubbles and distortions, to contribute to the reduction of mechanical properties and to the generation of stress concentrators as shown by [
5,
7,
9].
Due to the reasons shown previously, this study seeks to deepen the knowledge in the 3D printing field, analyzing the effect of parametric variations on the final quality of the manufactured parts, aiming to contribute to a better understanding of the occurrence and effects of these phenomena on the FDM process.
2. Materials and Methods
2.1. Experimental Setup and Study Procedures
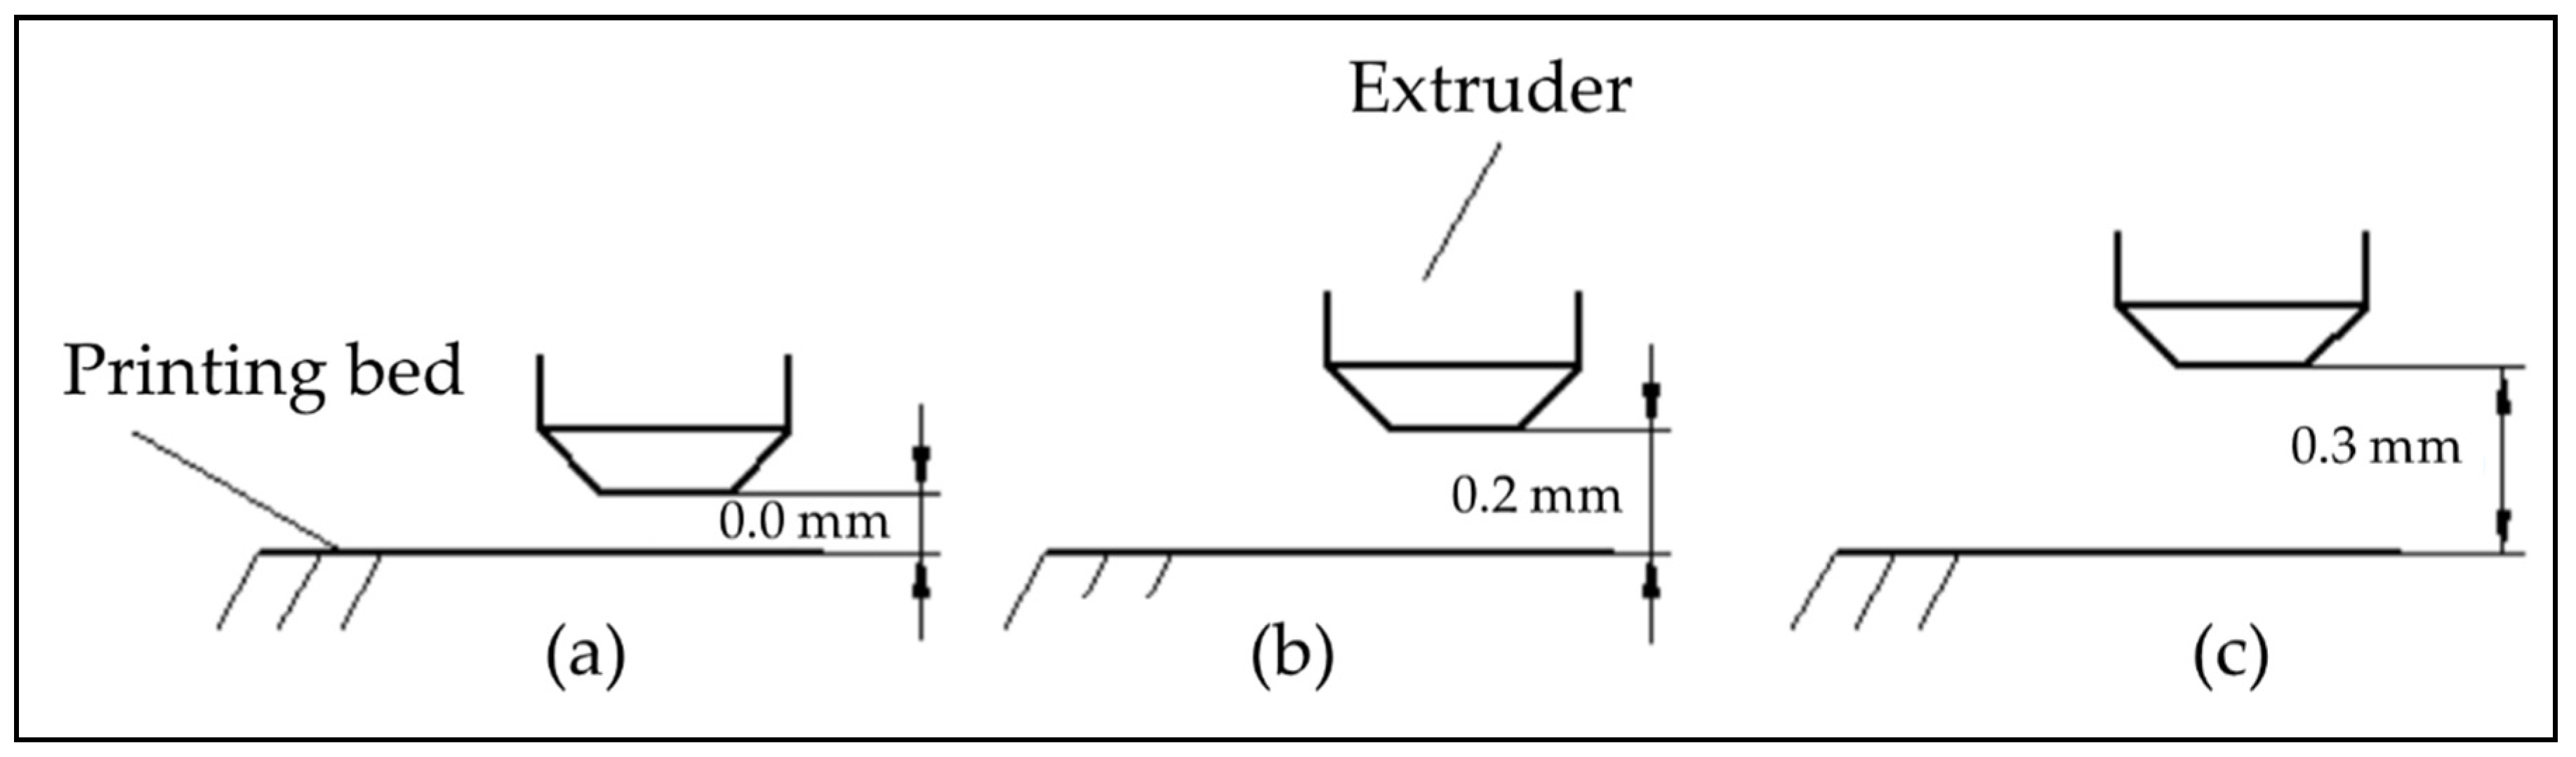
This work aims to study how the use of parameters with values different from the ones recommended affect the geometry and surface quality of the printed layer. The condition chosen for the experiment was the distance between the extruder nozzle and the bed.
The test consists of manually changing, using the Slic3r
® software running inside the Repetier-Host
® software, the height of the extruder nozzle in relation to the bed before starting to make the piece. This can be translated as variations in the
Z-axis. This approach was chosen since it allows one to simulate the localized unevenness of the bed and errors in the definition of the system’s origin, as well as situations where there are defects such as part detachment or scratching. As discussed by [
6] and shown in some of their experiments, too large of a gap between bed and nozzle can cause the layer to detach, just as a too small of a gap can result in the appearance of scratches on the surface.
The test bench consists of three groups of parts, one for each printing condition, and with each group consisting of three specimens. Each piece was printed individually, i.e., each printing process produced a single piece, and then the bed and the nozzle were cooled to room temperature. Once this temperature was reached, the previous printed piece was removed, and both bed and nozzle were heated again to the respective recommended operating temperatures (65 °C and 190 °C, respectively). This procedure was done to ensure that all parts were produced under the same conditions.
For this experiment, a Graber i3 model 3D printer, manufactured by GTMax3D
® was used alongside a 1.75 mm diameter PLA filament. The experimental pieces were small squares with 2 mm sides and 0.2 mm thickness, with rectilinear filling in the internal and external regions, software standard, and a single layer. The single layer was chosen due to the importance of the first layer for the whole process, since it served as the basis for subsequent layers and its deformations could pass on in a domino effect, and because they were the biggest basic element of the piece [
9]. The layer had a thickness of 0.2 mm and thus the height was considered as a reference for the variations in the
Z-axis between table and extruder nozzle. In addition to this height, tests were made with a negative variation of 0.2 mm and a positive variation of 0.1 mm, as can be seen in
Figure 1.
2.2. Digital Analysis Procedures
The components were digitalized through a DCP-L2540DW model scanner in the business card (90 × 60 mm) preset with resolution of 1200 × 1200 dpi. This procedure resulted in files in the portable network graphics (PNG) format with dimensions of 3968 × 2551 pixels.
Afterwards, specific measures were carried out through the Matlab® software, with the purpose of extracting maximum geometrical information from the components. In this context, the pieces were positioned on a graph paper before being digitalized, to enable an accurate pixel to millimeter dimensional conversion.
To execute the measures, the app ImageViewer®, which is a part of the image processing and computational view toolbox on the Matlab® version R2017b software, was used. Therefore, each image was accessed separately, and the feature denominated Measure Distance was utilized. This tool measures, in two dimensions (X and Y), the quantity of pixels between two selected dots.
Among the information, dimensions of the piece such as total width and height, layer thickness, and diagonal length were extracted. The diagonal measures were obtained to study flaws in the extruder positioning, while thickness of both internal and external layers would indicate height variations in relation to the table. Once the process of information extraction was concluded, the images of the pieces with the provided measures were saved in the tagged image file format (TIFF), with the intention of obtaining graphic representations with high resolution.
All that extracted information was organized in cells inside the Matlab® software, which enabled a comparison between the data of each repetition, according to condition. Finally, new comparisons were made between the printed conditions, starting from the representative measures defined in the previous step.
3. Results and Discussion
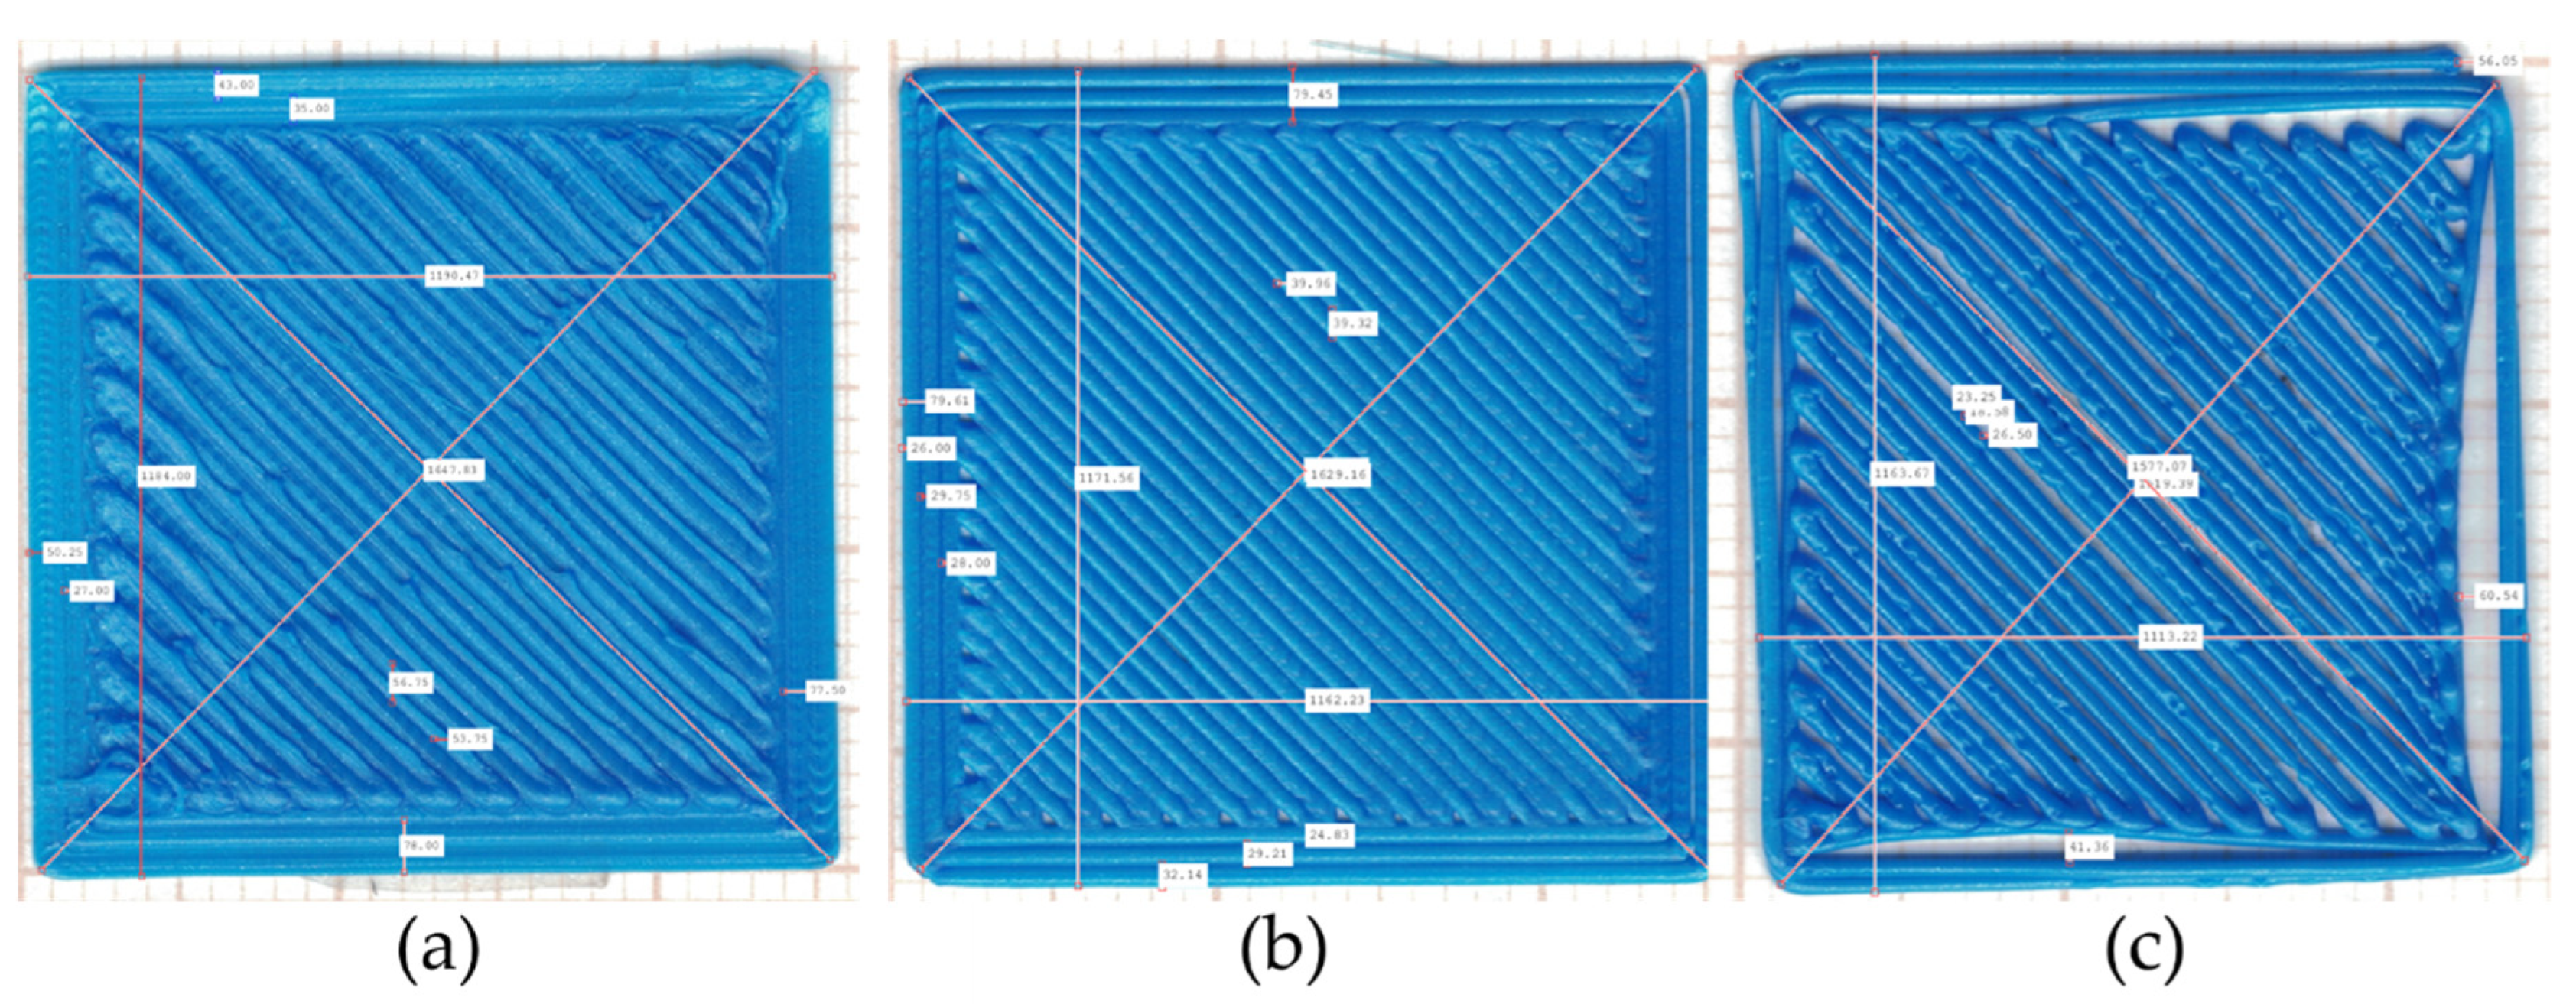
The pieces obtained under different printing conditions can be observed on
Figure 2. It is possible to observe, in
Figure 2, the existence of red lines, i.e., lines which were drawn throughout the digital analysis procedure of the piece geometrical characteristics, alongside with white rectangles, that provide the refereed dimension in number of pixels.
The baseline condition piece can be observed in
Figure 2b. Regarding the external printing pattern, it is possible to observe the presence of 3 visible printed segments, with well-defined and almost constant height and width values along each printed segment. The piece area regarding the internal printing pattern also presents well defined printed segments, with practically homogeneous height and width values along all the printed segments.
The piece obtained under the condition 1 printing can be observed on
Figure 2a. Regarding the external printing pattern, the piece printed under this condition presents visible deformations in the extruder printing segments, which can be spotted by the presence of only 2 visible printed segments, and with visible width variation between the printed segments. Deformations can also be observed on the corners of the external printing pattern, and in the form of lumps along the printing segments. The piece area regarding the internal printing pattern also presents visible deformations, in the form of lumps and geometrical variations for both height and width in each printed segment.
The geometrical deformations observed on the piece obtained under the condition 3 printing, as seen in
Figure 2c, are remarkably distinct from the deformations observed on the piece obtained under the condition 1 printing. Regarding to the external printing pattern, the obtained piece presents major deformations between the printing segments, in some points with only 2 visible printed segments, and in others with only 1 printed segment. It is also possible to observe the existence of an area without proper fill in the beginning of the external printing pattern first printing segment. The region in which the external printing pattern connects to the internal printing pattern, presents major deformations, in the form of detachments between the printing segments. The piece area regarding the internal printing pattern also presents visible deformations, in the form of large voids between the extruder printing segments, and major variations in both height and width values along each printed segment.
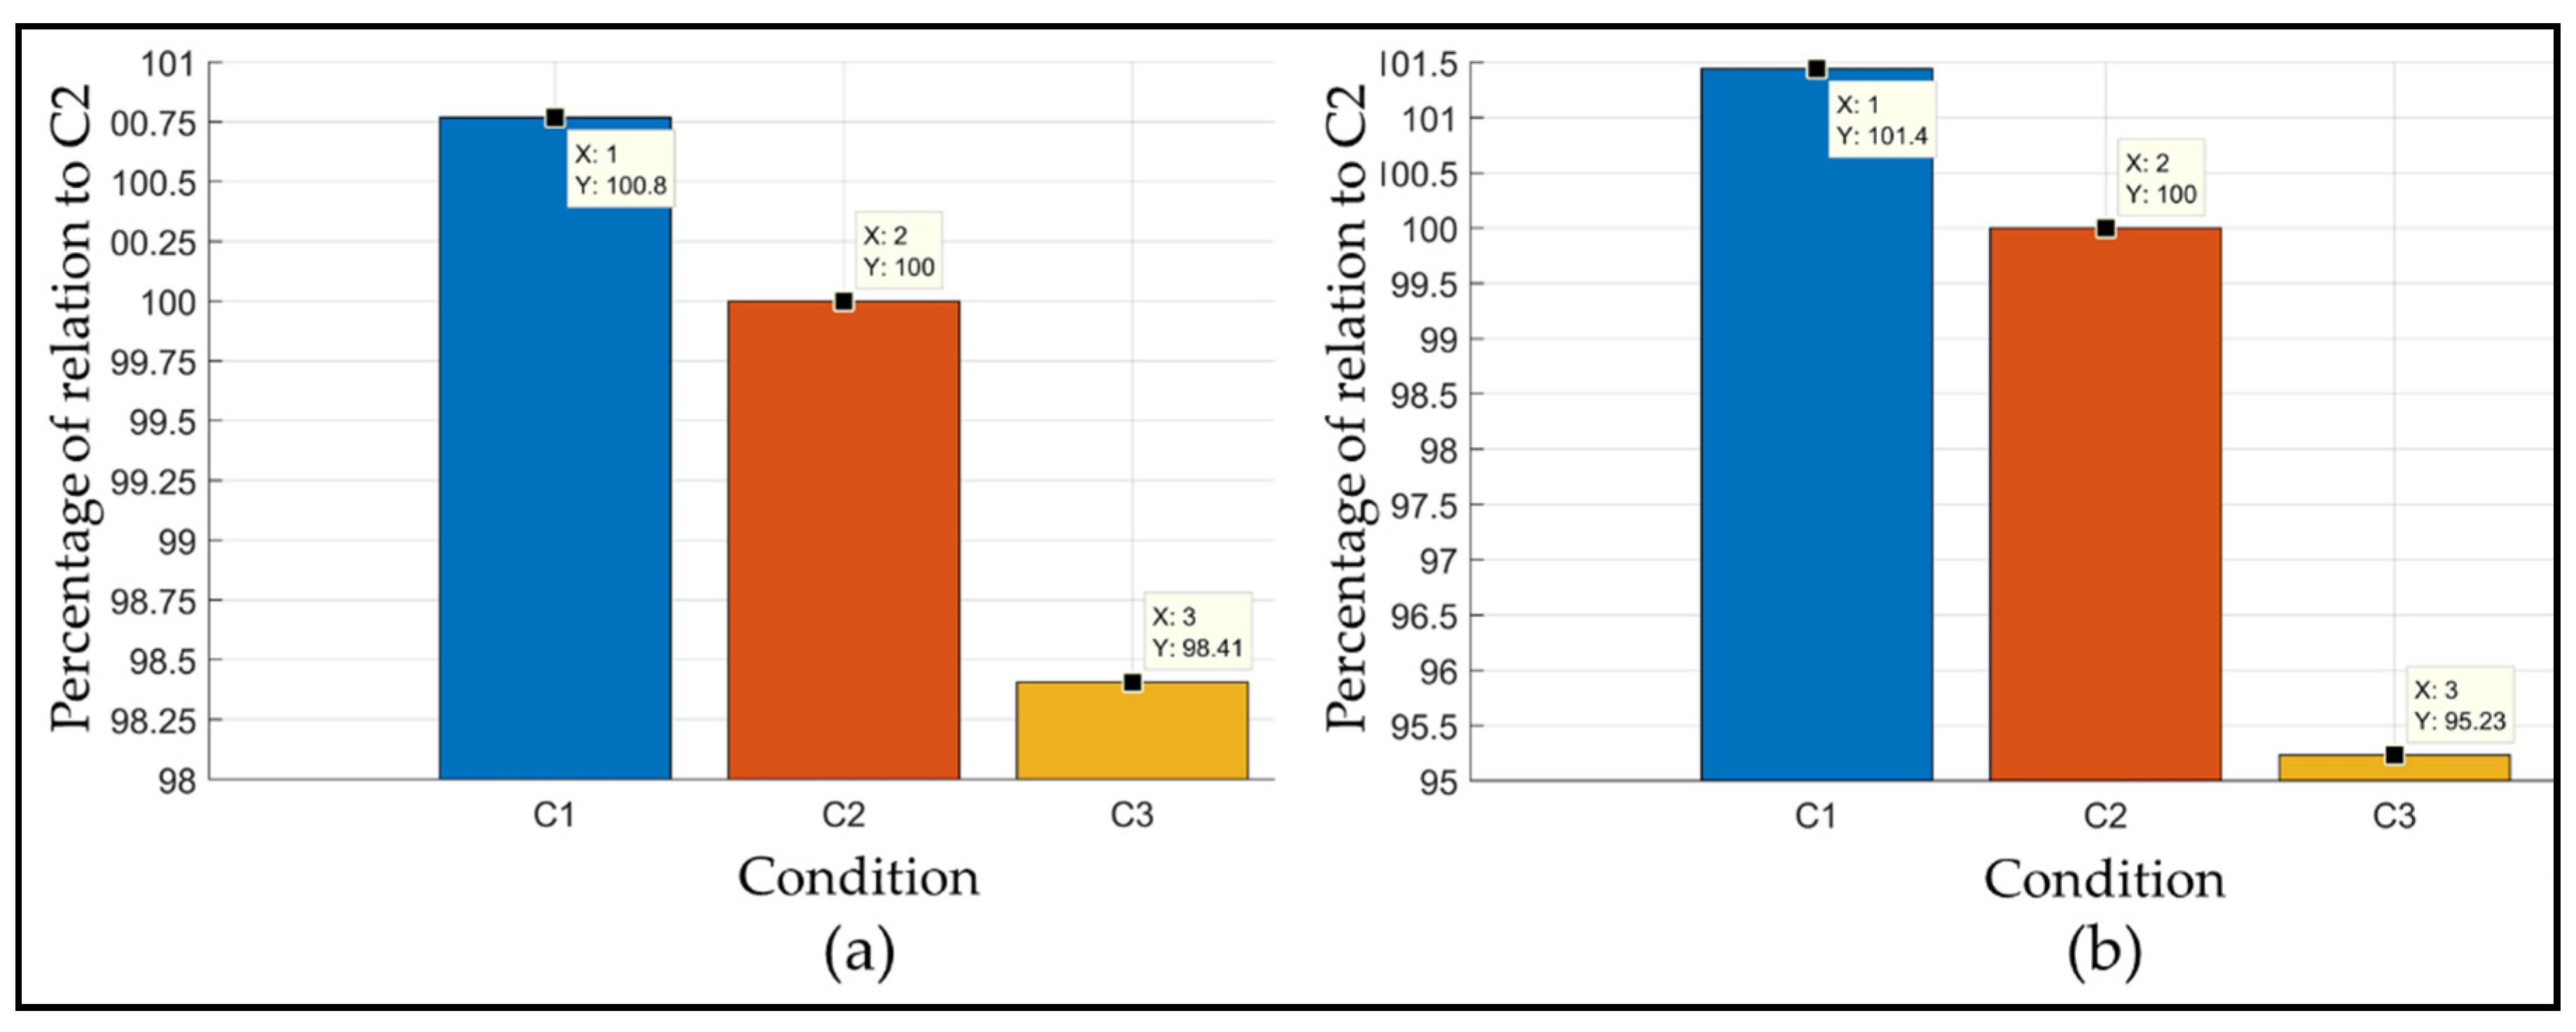
The visual inspections analysis results shown the existence of major surface and geometrical differences between the pieces obtained under different Z-axis values. The geometrical values obtained in Matlab® for the printing repetitions were compared. The observed standard deviation shows that there is repeatability in the obtained geometrical results. The mean values were then obtained, regarding to each geometrical variable, along all the repetitions for each printing condition.
The mean values for both height and width of each piece obtained under the different printing conditions were compared to the mean values for both height and width obtained for the piece obtained under baseline printing condition. The comparative results are shown in the form of percentage of relation to the printing condition 2 values in
Figure 3.
The total piece height comparison, represented in
Figure 3a, reveals that the geometrical deformations observed on the pieces printed under conditions 1 and 3 results in different relation values than the pieces printed under condition 2. The total piece height observed for the condition 1 possess a relation of 100.8% to condition 2, which represents an increase of 0.8%. Meanwhile, the total piece height observed for the condition 3 possess a relation of 98.4% to condition 2, which represents a decrease of 1.6%.
A similar behavior is observed regarding to the total piece width, represented on
Figure 3b. The total piece width observed for the condition 1 possess a relation of 101.4% to condition 2, which represents an increase of 1.4%. Meanwhile, the total piece width observed for the condition 3 possess a relation of 95.2% to condition 2, which represents a decrease of 4.8%.
4. Conclusions
The differences observed between the printing conditions 1 and 3, when compared to the baseline condition, may be attributed to the more common and pronounced piece detachment from the printing table, a defect which is aggravated by the larger variation in the
Z-axis, alongside with the appearance of gas bubbles, which also contributes to the overall degradation of the layer geometry [
6,
9].
Through an analysis of the infill printing patterns, it is possible to infer that the main alteration resulted from an incorrect extruder positioning is on the segments tracks. The struggle observed in distinguishing the segments on the external printing pattern of the piece printed under condition 1 is due to the occurrence of overlap between the segments, which presents a larger lateral runoff due to the unwanted contact with the hot extruder when it is performing an parallel segment printing.
The obtained values allow us to notice that a change, intentional or not, and relatively small in absolute terms, in the distance between the extruder nozzle and the bed can result in major surface quality losses and, although least visible, a less tight dimensional tolerance. It is worth to point out that, in the circumstance of a complete piece production, defects in each individual layer may occurs. These defects accumulate alongside all the piece production, resulting in a final piece with major geometrical and superficial deformations, which can result on the discarding of the produced piece.
Fundamentally, a negative variation in the Z-axis results in a flattening of the segments, which leads to planar deformations and an unwanted relative increase in the preestablished piece dimensions. On the other side, a positive variation in the Z-axis results in segments detachment, which leads to an unwanted relative decrease in the preestablished piece dimensions.
A more profound study is necessary in order to assure that, in an overall manner, the defects generated by a positive variation in the Z-axis are larger than those generated by a negative variation in the Z-axis, or if the found results are due to some specificity of the current paper.
Author Contributions
Methodology, M.G.F.d.C.; T.G.L.; software, V.S.B.; formal analysis, M.G.F.d.C.; T.G.L.; investigation, T.G.L.; resources, P.R.A.; T.V.F.; writing, M.G.F.d.C.; T.G.L.; V.S.B.; review and editing, P.R.A.; T.V.F.; supervision, P.R.A.; T.V.F. All authors have read and agreed to the published version of the manuscript.
Funding
This work was supported by the São Paulo Research Foundation (FAPESP) (grants #2016/22038-8 and 2019/22788-5) and by the National Council for Scientific and Technological Development (CNPq) (grants #306435/2017-9).
Conflicts of Interest
The authors declare no conflict of interest.
References
- Volpato, N. Manufatura Aditiva: Tecnologias e Aplicações da Impressão 3D, 1st ed.; Blucher: São Paulo, Brazil, 2017; ISBN 9788521211518. [Google Scholar]
- Huang, S.H.; Liu, P.; Mokasdar, A.; Hou, L. Additive manufacturing and its societal impact: A literature review. Int. J. Adv. Manuf. Technol. 2013. [Google Scholar] [CrossRef]
- Schniederjans, D.G. Adoption of 3D-printing technologies in manufacturing: A survey analysis. Int. J. Prod. Econ. 2017, 183, 287–298. [Google Scholar] [CrossRef]
- Lopes, T.G.; Puzipe, I.B.G.; Antonio, Z.R.F.; Gimenes, L.E.P.; Junior, G.P.M.; de Candido, A.S.O. A Utilização de Manufatura Aditiva em Projetos de Pesquisa. In Proceedings of the Anais do II Congresso de Inovação e Tecnologia—FATEC, Lajeado, Brazil, 21–22 June 2018; Pazin, A., Meira, F.L., Eds.; Centro Paula Souza: Lins, SP, Brazil, 2018; pp. 104–112. [Google Scholar]
- Wu, Y.; He, K.; Hu, H.; Zhao, X. Process Monitoring of Fused Deposition Modeling through Profile Control. In Proceedings of the 2018 IEEE International Conference on Cyborg and Bionic Systems, CBS 2018, Shenzhen, China, 25–27 October 2018. [Google Scholar]
- Wu, H.; Yu, Z.; Wang, Y. Experimental study of the process failure diagnosis in additive manufacturing based on acoustic emission. Measurement 2019, 136, 445–453. [Google Scholar] [CrossRef]
- Tlegenov, Y.; Hong, G.S.; Lu, W.F. Nozzle condition monitoring in 3D printing. Robot. Comput. Integr. Manuf. 2018, 54, 45–55. [Google Scholar] [CrossRef]
- Baumann, F.; Roller, D. Vision based error detection for 3D printing processes. MATEC Web Conf. 2016, 59, 06003. [Google Scholar] [CrossRef]
- Wendt, C.; Fernández-Vidal, S.R.; Gómez-Parra, Á.; Batista, M.; Marcos, M. Processing and Quality Evaluation of Additive Manufacturing Monolayer Specimens. Adv. Mater. Sci. Eng. 2016, 2016, 1–8. [Google Scholar] [CrossRef]
| Publisher’s Note: MDPI stays neutral with regard to jurisdictional claims in published maps and institutional affiliations. |
© 2020 by the authors. Licensee MDPI, Basel, Switzerland. This article is an open access article distributed under the terms and conditions of the Creative Commons Attribution (CC BY) license (https://creativecommons.org/licenses/by/4.0/).

 ,
, 