Proceeding Paper

Atmospheric and Soil Methane Concentrations Integrating a New Gas Detection Technology †

by
Ana Maria Carmen Ilie
1,* and
Carmela Vaccaro
2
1
Department of Civil and Environmental Engineering, Colorado School of Mines, Golden, CO 80401, USA
2
Department of Physics and Earth Science, University of Ferrara, Ferrara 44121, Italy
*
Author to whom correspondence should be addressed.
Presented at the 1st International Electronic Conference on Applied Sciences, 10–30 November 2020; Available online: https://asec2020.sciforum.net/.
Proceedings 2020, 67(1), 7; https://doi.org/10.3390/ASEC2020-07564
Published: 9 November 2020
(This article belongs to the Proceedings of The 1st International Electronic Conference on Applied Sciences)

Abstract

:
Cities are major contributors to greenhouse gas emissions (GHG) due to the high density of urbanization, numerous industrial centers, and intensive agricultural activities. This study focused on soil methane and radon gas measurements in the subsurface, as well as in the atmosphere. Measurements were conducted using new gas detection instrumentation and as low-cost devices for methane gas concentrations. Maximum soil radon gas concentration was observed to be approximately 1770 ± 582 Bq/m3 at a depth of 1 m below the ground surface. The soil comprised of 64.31% sand, 20.75% silt, and 14.94% clay, and 0.526 ppm of uranium. The maximum concentration of methane was about 0.06%, at a depth of 1 m into the soil, characterized by 83% sand, 8.96% silt, and 7.89% clay. Moreover, this study focused on a better understanding of the advantages and disadvantages of new soil gas detection technology. The results and findings of environmental data obtained from the soil gas survey were shared with the community, whose involvement was critical in the data acquisition process.

1. Introduction

Gas migration through wellbore failure, from abandoned wells, is identified as the highest risk mechanism from multiple sources in literature [1,2]. The relative importance of monitoring wellbore failure is highlighted by the occurrence of accidents in the natural gas storage industry, including the recent wellbore blowout and sustained CH4 venting of the Aliso Canyon underground gas storage facility in California [3]. Methane is a greenhouse gas (GHG) and its oxidation produces ozone (O3) that degrades the air quality and adversely impacts human health, agricultural yields, and ecosystem productivity [4]. In comparison to CO2, methane has a 25-time higher global warming potential for a 100-year time horizon [5]. Abandoned oil and gas wells provide a potential pathway for subsurface migration and emissions to the atmosphere of methane and other fluids [6]. Air quality has a tremendous effect on public health and the environment [7]. Air quality and the vadose zone were subject to a monitoring system in Minerbio city, located close to a natural gas storage site. Measurements taken close to the near-surface vadose zone are ideal for multiple reasons. Firstly, the vadose zone is quick and easy to sample, as it represents the bounding zone between subsurface storage and the atmosphere [8]. In this study, soil radon gas was investigated as well. 222Rn is a radioactive gas that is produced by the decay of radium (226Ra) within the uranium (238U) decay series. Typical soil air Rn values in Italian sedimentary basins, up to 15 Bq/L, are related to the content of parent radionuclides in the surface rocks (with 1–2 ppm of U) [9]. However, some surface radon anomalies can be related to the upward migration of gas along fault zones [10]. The short half-life of 222Rn (3.85 days) limits its migration distance in the subsoil, and thus, radon measured in the soil air cannot be produced at great depth unless it is lifted upward by a relatively fast-flowing carrier gas, such as CO2, CH4, or N2 [11,12].

2. Material and Methods

A soil gas survey was conducted nearby a natural gas storage site. This study would not have been possible without community approval. Before starting the soil gas survey, a few presentations and kick-off meetings were conducted at each house surveyed. The environmental issues and solutions were presented to the community. The measurements were carried out in July, August, and September 2016 in Minerbio (BO), Italy. Air–soil samples were taken at 14 locations, as shown in Figure 1. Fifteen soil samples were collected at 10 cm and 1 m below the ground surface, to determine the soil texture and soil chemical properties.
As the first procedure for texture analysis, the sandy fraction was filtered out from the muddy fraction through wet sieving (net light of 63 μm). A further division of the sands was determined by using a mechanical quencher to obtain a fraction of 2.8–3 g. Instrumentation based on the principles of Stokes law and Sedimcol software were used to elaborate Folk and Ward [13] textural parameters, to determine the relative percentages of the granulometric classes based on the size scale of Wentworth [14]. The X-ray Sedigraph product by Micromeritics (Model 5100) was used to analyze the mud fraction with a dimensional range from 0.0884 mm to 0.00049 mm and a value standard of the density of about 2.7 g/cm3. Inductively coupled plasma mass spectrometry (ICP-MS) analysis technology was conducted through a Thermo Electron Corporation X series spectrometer (Thermo Fisher Scientific, Waltham, MA, USA) to obtain the uranium and thorium soil concentrations. Private well water sampling was conducted at each soil gas survey location. Parameters like temperature, the potential of hydrogen (pH), electrical conductivity (EC), oxidation-reduction potential (ORP) were determined in situ using a Hanna device. A stainless-steel probe with a diameter of 6.4 mm was used for the soil gas monitoring to a depth of 10 cm and 1 m below the surface for methane, carbon dioxide, and oxygen measurements, as shown in Figure 2. Radon soil gas survey was conducted at 1 m below the ground surface.
ETG BioGas devices measured CO2% and CH4% gas by using an infrared sensor (with an accuracy of 1.5%) and O2% gas using an electrochemical O2 sensor (with an accuracy of 1%). Devices were provided with an internal air pump to draw the soil gas at a rate of 1 L/min and before each measurement the devices were purged with dry air for 15 min using drierite desiccant. RAD7 Durridge® alpha spectrometry instrument was used for the 222Rn-220Rn soil gas survey. The main study goal was to determine methane concentrations based on soil depth and investigate any discrepancies between the atmosphere and soil gas values.
The gas survey helped in a better understanding of the new gas technology, as well as understand the challenges faced during the field activities.

3. Results and Discussion

3.1. Soil Analysis

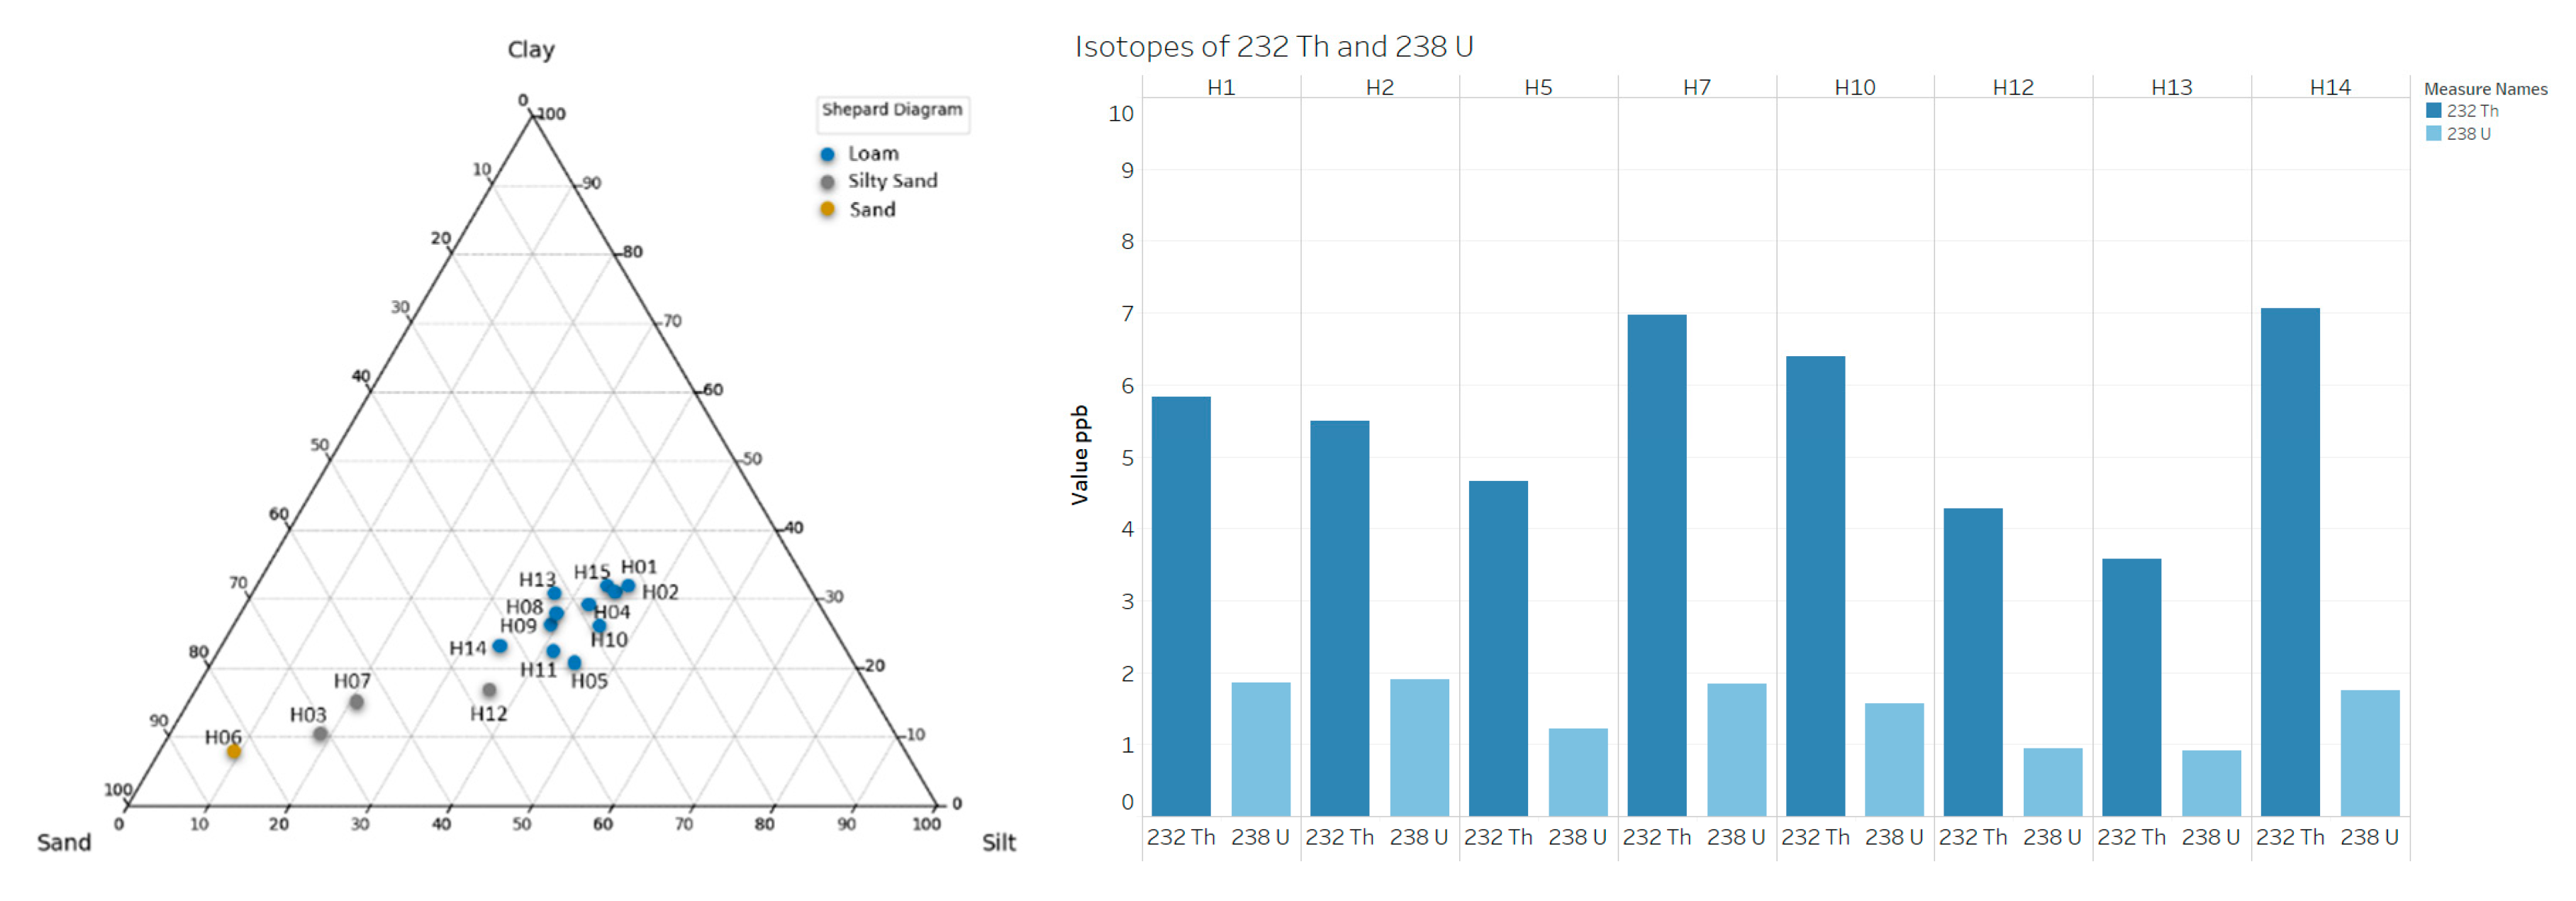
Soil texture and chemical analysis were conducted on 15 soil samples. Percentages of sand, silt, and clay were determined for each soil sample. Shepard diagram was used, where percentage limits of sediment were defined. M06 sandy soil, M03, M07, and M12 silty sand, and the other remaining samples of loam are shown in Figure 3.
The samples M03, M06, and M07 were sand-based soils, estimating the highest permeability, which allows more gas to migrate from the shallow soil to the surface. Higher concentrations of thorium and uranium were found to be in clay-silt based soils. These lithological units may potentially be the cause of soil radon concentrations. Soil texture and isotope composition give a better understanding of the soil gas dynamics and migration from greater soil depths. Soil texture of these samples (sandy soil, silty sand, loam) refers to the proportion of sand-, silt-, and clay-sized particles that compose the mineral fraction of the soil. The soil water content, the water movement through the soil, and gas migration depend on soil texture. Sandy soil has a high infiltration rate, while clay soil has a lower infiltration rate, which might affect the soil gas concentrations.

3.2. Soil Gas Survey

Atmospheric methane gas concentrations were found to be lower than soil methane gas concentrations. Atmospheric methane gas concentrations depend on the local weather conditions, especially wind speed and direction. Studies have shown greater CH4 soil emissions under high CO2 [15] and elevated temperature [16,17]. Typically, surface ground methane gas concentration varies between 0.2 and 1.6 ppm (mean concentration in air), with no external source of CH4, and the concentration is not expected to exceed 0.1% v/v [18]. In the study area, methane concentrations were found to be around 0.020–0.030% at 1 m below the surface. Anaerobic decomposition of organic matter produces large quantities of methane in the soil. Methane soil gas concentrations depend on the relative rates of methanogenic and methanotrophic soil activity, as well as on pH, Eh, temperature, and soil moisture content. A temperature rise stimulates microbial activity in submerged soils, which may lead to a higher rate of CH4 production [19]. Increased soil moisture under elevated CO2 reduces the rate of diffusion and therefore decreases CH4 oxidation in the soil [20,21]. However, if the rising temperature due to the global climate change makes the soil drier, CH4 oxidation may be enhanced [22]. In Figure 4, the corresponding value on the Y-axis is the monthly average concentration of CH4 % v/v with the locations monitored during the month, labeled on the X-axis. In July, the soil methane concentrations were observed to be higher than the atmosphere by about 0.03%. In August, the methane concentrations were found to be highest in the atmosphere, with a maximum concentration of about 0.05%. Soil methane gas concentrations were higher at a depth of 1 m than at 10 cm, due to the atmospheric conditions affecting the surface soil. However, the study area was not characterized by soils rich in organic matter and it might explain the low concentrations found on methane soil gas. The study area was characterized by alluvium sediments that consisted of silt, clay, and sand. The highest methane concentration was found to be around 0.06% in sand-based soil. A better understanding of the methane gas process in the soil would require a carbon isotopic analysis to determine initially the methane sources, biogenic or thermogenic.
Regarding the soil gas radon, at a depth of 1 m below the ground surface, the maximum concentration was about 1770 ± 582 Bq/m3, with soil consisting of 64.31% sand, 20.75% silt, and 14.94% clay, and 0.526 ppm of uranium. The short half-life of 222Rn (3.85 days) limits its migration distance in the subsoil, and thus, radon measured in the soil air cannot be produced at great depth unless it is lifted upward by a relatively fast-flowing carrier gas, such as CO2, CH4, or N2 [11]. Three main factors are known to predispose elevated radon levels. First, the regional and local geochemical and geological characteristics of the soil/rock will establish the in-situ conditions. For example, uranium (238U, 235Th) and radium (226Ra) content will control the amount of radon generated [23]. Second, environmental conditions will control the rate of movement of soil radon toward the surface. The escape of radon atoms at the grain scale is controlled by porosity, water content, and grain size, whereas migration toward the shallow environment is controlled by large-scale geological features like rock thickness, permeability, fractures, and karst [24,25].
Private well water sampling was conducted at each soil gas survey location. Water parameters can be linked to high methane concentrations dissolved in water. Parameters like temperature, the potential of hydrogen (pH), electrical conductivity (EC), and oxidation-reduction potential (ORP) were determined in situ using a Hanna device and no outliers were identified. In the study area, the pH values ranged between 6.69 and 8.2, while the temperature values ranged between 10 °C and 22 °C. In a few water samples, positive oxidation and negative reduction ORP values were observed.

4. Conclusions

The main goal of this study was to better understand soil methane gas dynamics using ETG devices as a new low-cost gas-sensing technology. Soil gas dynamics were related to soil texture, organic matter content, and structural features, which affected the soil gas concentration. The maximum soil methane concentration was about 0.06% with a soil characterized by 83% sand, 8.96% silt, and 7.89% clay. The values from the soil gas survey lay in the range of 0.01% to 0.03% CH4. A continuous monitoring system was conducted after this field campaign using new low-cost gas sensors and water sensors, and using pH and electrical conductivity sensors, parameters that can be linked to high methane concentrations dissolved in water [26]. The new system was built to address the issues faced during the field activities using the ETG portable gas monitoring devices. As an example, heavy cases were not used on the new prototype and the air pump was not located inside the sensor box to prevent the influence of increasing temperature and its impact on sensor readings. The data were saved on an SD card and integrated into a database created with a raspberry pi, which was not feasible on the ETG devices. ETG portable devices were not suitable for continuous monitoring since the battery life was about 5 h, thus it was not possible to determine diurnal patterns of soil methane gas concentrations at each location. Meteorological parameters like wind, barometric pressure, and relative humidity were not included in the ETG devices, however, they should be a part of the gas survey since it might affect the gas migration from the soil to the atmosphere. The stainless-steel soil probe was configured first with tubing for drierite desiccant to reduce the soil moisture by at least 60%. Regarding the stainless-steel probe, it was difficult to bore a hole down into a clay-based soil, and it had several soil gas access holes for the gas to flow in. The soil gas access holes were getting clogged with the surrounding soil affecting the gas volume sampled. It is recommended to use a mesh on the soil gas access holes to let the gas flow out with the specific volume requested by the pump itself. More information on the soil conditions and suitable instruments, soil gas monitoring components, tubing, and pumps for the study purposes is required at each location for a better performance of the soil gas sampling. At the end of each soil gas survey, insights gathered from the data were disseminated to the community. This process helped the community get a better understanding of the surveyed area and get trained on the environmental safety issues like methane gas leakage into the soil or groundwater.

Funding

This research was funded by MIUR, the Ministry of Universities, and Research of Italy.

Acknowledgments

We would like to thank the community of Minerbio for their support towards this research. We thank Francesco Droghetti, Umberto Tessari, and Renzo Tassinari for field and laboratory technical support.

Conflicts of Interest

The authors declare no conflict of interest. The funders had no role in the design of the study; in the collection, analyses, or interpretation of data; in the writing of the manuscript; or in the decision to publish the results.

References

  1. Bachu, S.; Celia, M.A. Assessing the Potential for CO2 Leakage, Particularly Through Wells, from Geological Storage Sites, Carbon Sequestration and Its Role in the Global Carbon Cycle. AGU Monogr. 2009, 183, 203–216. [Google Scholar]
  2. Benson, S. Carbon Dioxide Capture and Storage: Assessment of Risks from Storage of Carbon Dioxide in Deep Underground Geological Formations. In Workshop Proceedings, The 10–50 Solution: Technologies and Policies for a Low-Carbon Future; The Pew Center on Global Climate Change and the National Commission on Energy Policy; Lawrence Berkeley National Laboratory: Berkeley, CA, USA, 2006. [Google Scholar]
  3. Conley, S.; Franco, G.; Faloona, I.; Blake, D.R.; Peischl, J.; Ryerson, T.B. Methane emissions from the 2015 Aliso Canyon blowout in Los Angeles, CA. Science 2016, 351, 1317–1320. [Google Scholar] [CrossRef] [PubMed]
  4. Kang, M.; Kanno, C.M.; Reid, M.C.; Zhang, X.; Mauzerall, D.L.; Celia, M.A.; Chen, Y.; Onstott, T.C. Direct measurements of methane emissions from abandoned oil and gas wells in Pennsylvania. Proc. Natl. Acad. Sci. USA 2014, 111, 18173–18177. [Google Scholar] [CrossRef] [PubMed]
  5. Rigby, M.; Prinn, R.G.; Fraser, P.J.; Simmonds, P.G.; Langenfelds, R.L.; Huang, J.; Cunnold, D.M.; Steele, L.P.; Krummel, P.B.; Weiss, R.F.; et al. Renewed growth of atmospheric methane. Geophys. Res. Lett. 2008, 35, 22805. [Google Scholar] [CrossRef]
  6. Nordbotten, J.M.; Kavetski, D.; Celia, M.A.; Bachu, S. Model for CO2 Leakage Including Multiple Geological Layers and Multiple Leaky Wells. Environ. Sci. Technol. 2009, 43, 743–749. [Google Scholar] [CrossRef] [PubMed]
  7. Kunzli, N.; Kaiser, R.; Medina, S.H.; Studnicka, M.; Chanel, O.; Filliger, P.; Herry, M.; Horak, F.; Puybonnieux-Texier, V.; Quenel, P.; et al. Public-health impact of outdoor and traffic-related air pollution: A European assessment. Lancet 2000, 356, 795–801. [Google Scholar] [CrossRef]
  8. Romanak, K.D.; Bennett, P.; Yang, C.; Hovorka, S.D. A process-based approach to CO2 leakage detection by vadose zone gas monitoring at geologic CO2 storage sites. Geophys. Res. Lett. 2012, 39. [Google Scholar] [CrossRef]
  9. Lombardi, S.; Etiope, G.; Guerra, M.; Ciotoli, G.; Grainger, P.; Duddridge, G.A.; Gera, F.; Chiantore, V.; Pensieri, R.; Grindrod, P.; et al. The Refinement of Soil Gas Analysis as a Geological Investigative Technique; Final Report; Work Carried Out under A Cost-Sharing Contract with the European Atomic Energy Community in the Framework of its 4th R&D Program on ‘Management and Storage of Radioactive Waste’ (1990–1994) Part A, Task 4: ‘Disposal of Radioactive Waste’. EUR 16929 EN; European Commission: Luxembourg, 1996; ISBN 92-827-7838-X. [Google Scholar]
  10. Abdoh, A.; Pilkington, M. Radon emanation studies of the Ile Bizard Fault, Montreal. Geoexploration 1989, 25, 341–354. [Google Scholar] [CrossRef]
  11. Wilkening, M. Radon transport processes below the Earth’s surface. In The Natural Radiation Environment, III; Tech. Inf. Center, U.S. Dept. of Energy: Springfield, VA, USA, 1980; pp. 90–104. [Google Scholar]
  12. Durrance, E.M.; Gregory, R.G. Helium and radon transport mechanisms in hydrothermal circulation systems of Southwest England. In Geochemistry of Gaseous Elements and Compounds; Theophrastus Publ.: Athens, Greece, 1990; pp. 337–352. [Google Scholar]
  13. Folk, R.L.; Ward, W.C. A Study in the Significance of Grain-Size Parameters. J. Sediment. Petrol. 1957, 27, 3–26. [Google Scholar] [CrossRef]
  14. Wentworth, C.K. A Scale of Grade and Class Terms for Clastic Sediments. J. Geol. 1922, 30, 377–392. [Google Scholar] [CrossRef]
  15. Inubushi, K.; Furukawa, Y.; Hadi, A.; Purnomo, E.; Tsuruta, H. Seasonal changes of CO2, CH4 and N2O fluxes in relation to land-use change in tropical peatlands located in coastal area of South Kalimantan. Chemosphere 2003, 52, 603–608. [Google Scholar] [CrossRef]
  16. Inubushi, K.; Wada, H.; Takai, Y. Determination of microbial biomass nitrogen in submerged soil. Soil Sci. Plant Nutr. 1984, 30, 455–459. [Google Scholar] [CrossRef]
  17. Ziska, L.H.; Moya, T.B.; Wassmann, R.; Namuco, O.S.; Lantin, R.S.; Aduna, J.B.; Abao, E.; Bronson, K.F.; Neue, H.U.; Olszyk, D. Long-term growth at elevated carbon dioxide stimulates methane emission in tropical paddy rice. Glob. Chang. Biol. 1998, 4, 657–665. [Google Scholar] [CrossRef]
  18. Hooker, P.J.; Bannon, M.P. Methane: Its Occurrence and Hazards in Construction; Construction Industry Research and Information Association R130: London UK, 1993; 140p. [Google Scholar]
  19. Fey, A.; Conrad, R. Effect of Temperature on Carbon and Electron Flow and on the Archaeal Community in Methanogenic Rice Field Soil. Appl. Environ. Microbiol. 2000, 66, 4790–4797. [Google Scholar] [CrossRef] [PubMed]
  20. Ambus, P.L.; Robertson, G.P. Fluxes of CH4 and N2O in aspen stands grown under ambient and twice-ambient CO2. Plant Soil 1999, 209, 1–8. [Google Scholar] [CrossRef]
  21. Phillips, R.; Whalen, S.C.; Schlesinger, W.H. Response of soil methanotrophic activity to carbon dioxide enrichment in a North Carolina coniferous forest. Soil Biol. Biochem. 2001, 33, 793–800. [Google Scholar] [CrossRef]
  22. Dijkstra, F.A.; Morgan, J.A.; LeCain, D.R.; Follett, R.F. Microbially mediated CH4 consumption and N2O emission is affected by elevated CO2, soil water content, and composition of semi-arid grassland species. Plant Soil 2009, 329, 269–281. [Google Scholar] [CrossRef]
  23. Drolet, J.-P.; Martel, R.; Poulin, P.; Dessau, J.-C.; Lavoie, D.; Parent, M.; Lévesque, B. An approach to define potential radon emission level maps using indoor radon concentration measurements and radio geochemical data positive proportion relationships. J. Environ. Radioact. 2013, 124, 57–67. [Google Scholar] [CrossRef] [PubMed]
  24. Nazaroff, W.W. Radon transport from soil to air. Rev. Geophys. 1992, 30, 137–160. [Google Scholar] [CrossRef]
  25. Etiope, G.; Martinelli, G. Migration of carrier and trace gases in the geosphere: An overview. Phys. Earth Planet. Inter. 2002, 129, 185–204. [Google Scholar] [CrossRef]
  26. Ilie, A.M.; Vaccaro, C. Design of a smart gas detection system in areas of natural gas storage. In Proceedings of the 2017 IEEE International Geoscience and Remote Sensing Symposium (IGARSS), Fort Worth, TX, USA, 23–28 July 2017; pp. 5954–5957. [Google Scholar]
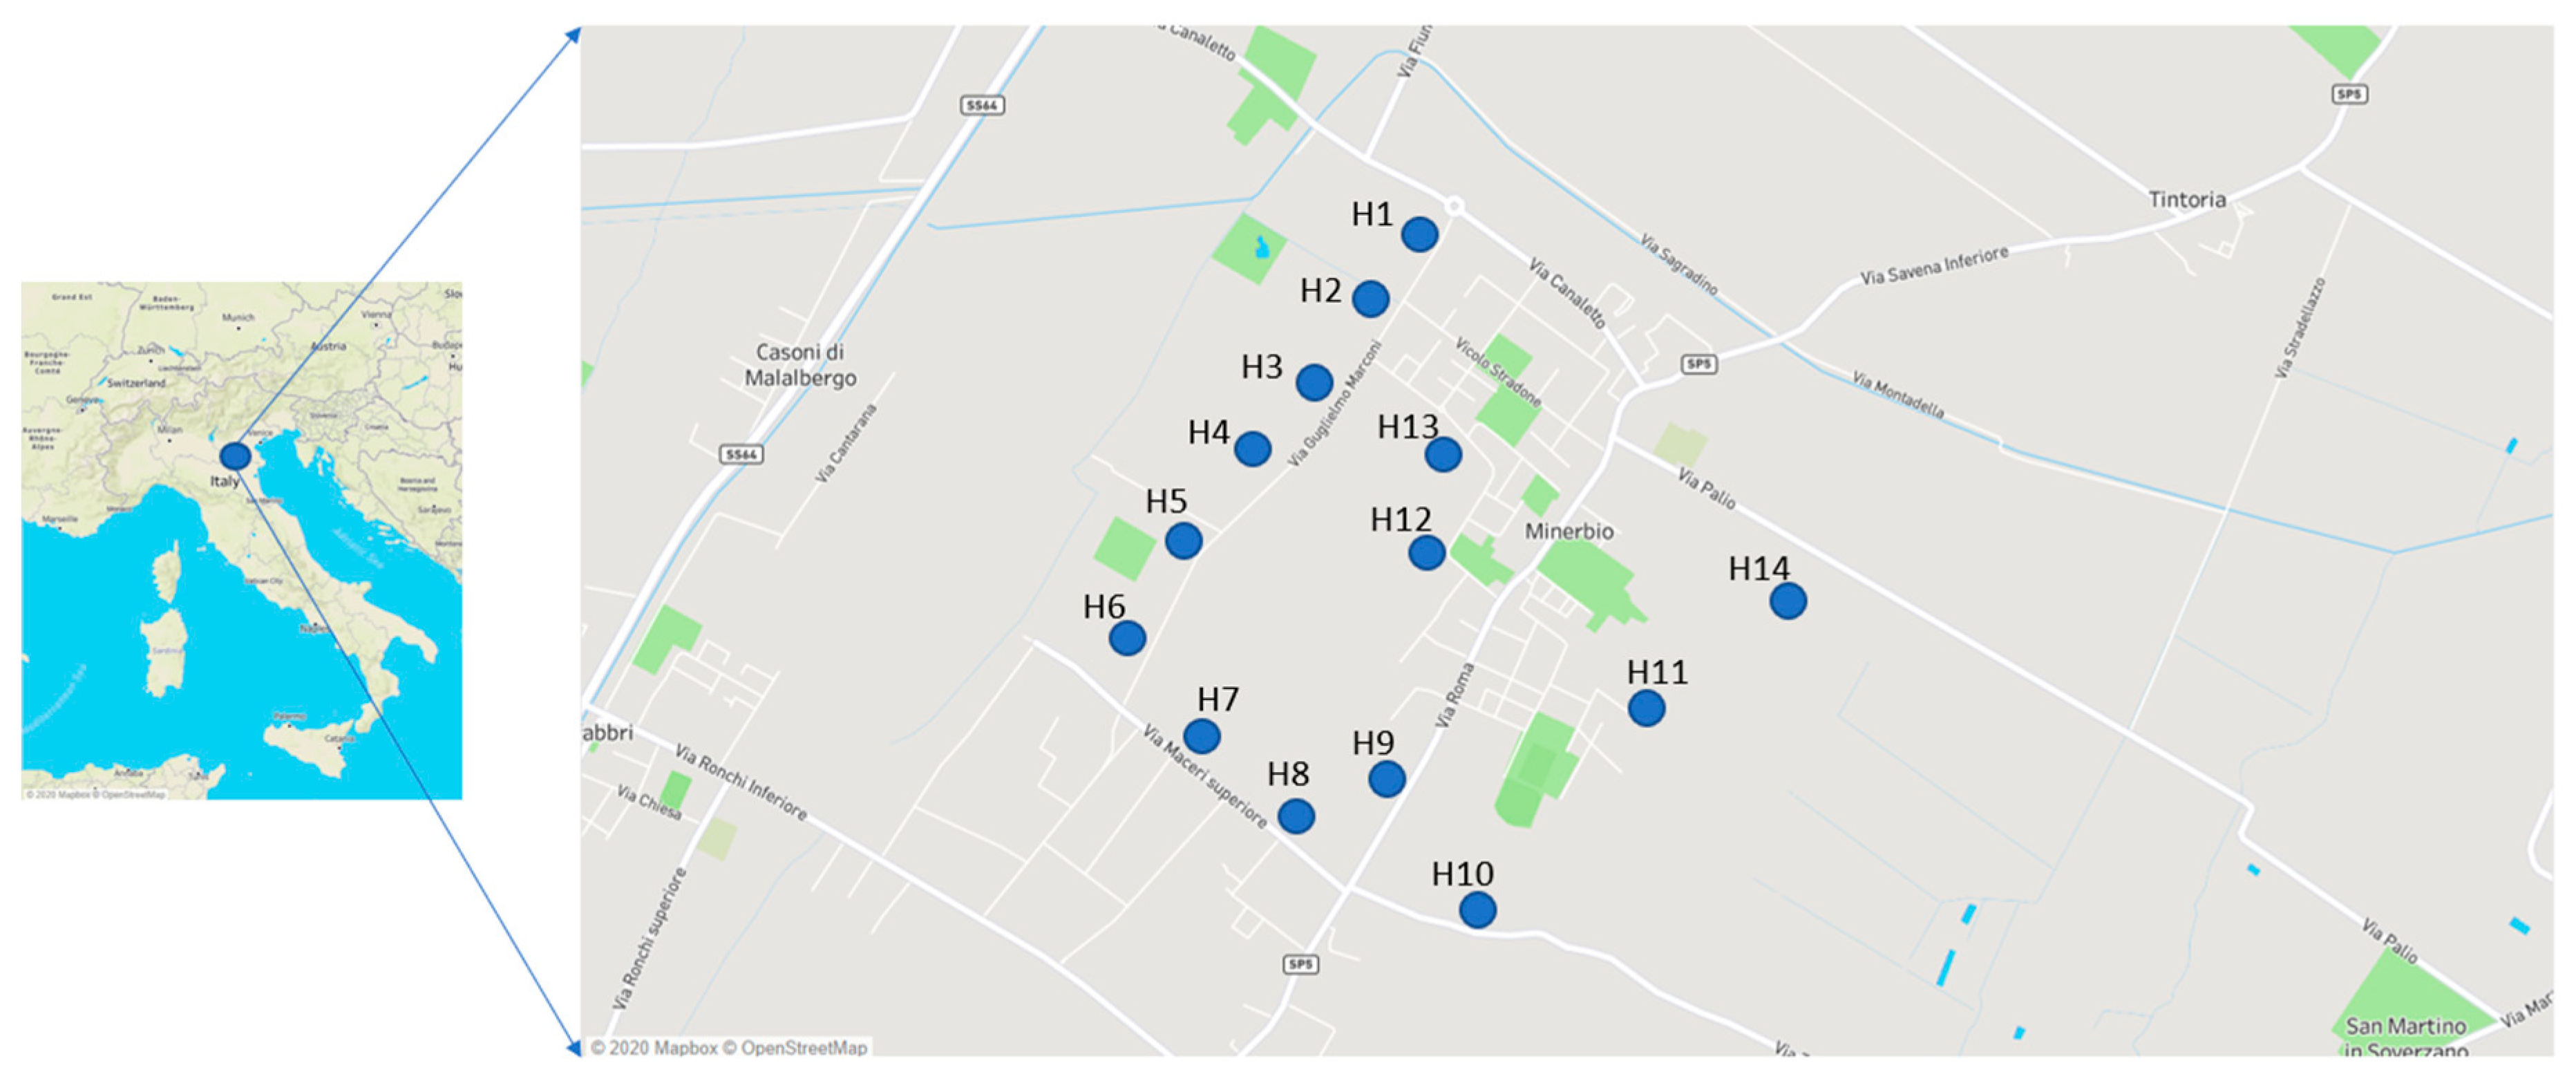
Figure 1. Soil gas survey study area.
Proceedings 67 00007 g001
Figure 2. Design of the gas monitoring system.
Proceedings 67 00007 g002
Figure 3. Shepard diagram and isotopes of Th and U for each soil sample.
Proceedings 67 00007 g003
Figure 4. Monthly CH4 % and Rn averages for each location.
Proceedings 67 00007 g004
Publisher’s Note: MDPI stays neutral with regard to jurisdictional claims in published maps and institutional affiliations.