1. Introduction
Climate change caused by transport is a major problem for our society. During the last few years, electric vehicles (EVs) have emerged as a very promising sustainable alternative to traditional fuel cars. However, EV charging needs bear an impact on electrical grid load, leading to increased peak loads, e.g., during evening hours when people return from work, park, and charge their EVs at home. In this context, EVs can significantly change the daily energy demands and further challenge the role of distribution system operators (DSOs). Reshaping the electrical grid load profile is an aspect of EV operation worth analyzing, especially if the continuous growth of the EV penetration rate is considered.
Even though the typical operation mode (grid-to-vehicle (G2V)) is for the EV to be connected to the energy grid in order to charge its battery, modern types of high-capacity batteries can store large amounts of energy at a rapid rate. Therefore, by using bidirectional battery chargers, it is possible to use energy in the opposite way, i.e., energy flows from vehicle-to-grid (V2G) rather than G2V.
The systemic variables of load profile and average state of charge (SoC) levels are analyzed against parameters such as the time of day, the user driving profile (driving speed, parking habits) and the type of charging for the different (dis)charging strategies. Additionally, this work attempts a user-centric analysis targeting the charging costs for the EV owners.
Results are based on extensive MATLAB simulations considering multiple EVs.
2. Charging Strategies
The simulation considers plug-in hybrid electric vehicles (PHEVs) that travel and park during a day, i.e., from 00:00 to 23:59, according to a specific travel profile. The simulation begins at 00:00 with all PHEVs fully charged and a ratio, , of the vehicles in parking state. For each EV, a travel pattern is stochastically generated following transition probabilities, i.e., (the probability of the EV entering a driving mode during the time interval if, during the interval, it was parked) and (the probability of the EV being parked during the time interval if, during the , it was parked). Hence, the battery SoC level is simulated for each time interval according to the EV state, i.e., parking or driving.
Note that if a PHEV’s battery state of charge is depleted to ~10% of its maximum capacity (, then the vehicle changes to internal combustion engine, and continues its trip using fuel.
Three different charging strategies are investigated, referred to as “Scenario 1”, “Scenario 2” and “Scenario 3” in the following section.
2.1. Scenario 1
This scenario is considered here as the reference scenario, as the EVs are allowed to charge whenever they are parked until they reach their maximum battery SoC level
. Therefore, Equations (1) and (2) provide the SoC calculations for the next time interval (
) when the EV is in charging or in driving mode, respectively.
where
is the charging power (kW),
is the charging duration for a time interval (h),
is the average driving speed (km/h),
is the vehicle energy consumption (kWh/km) and
is the current SoC level.
2.2. Scenario 2
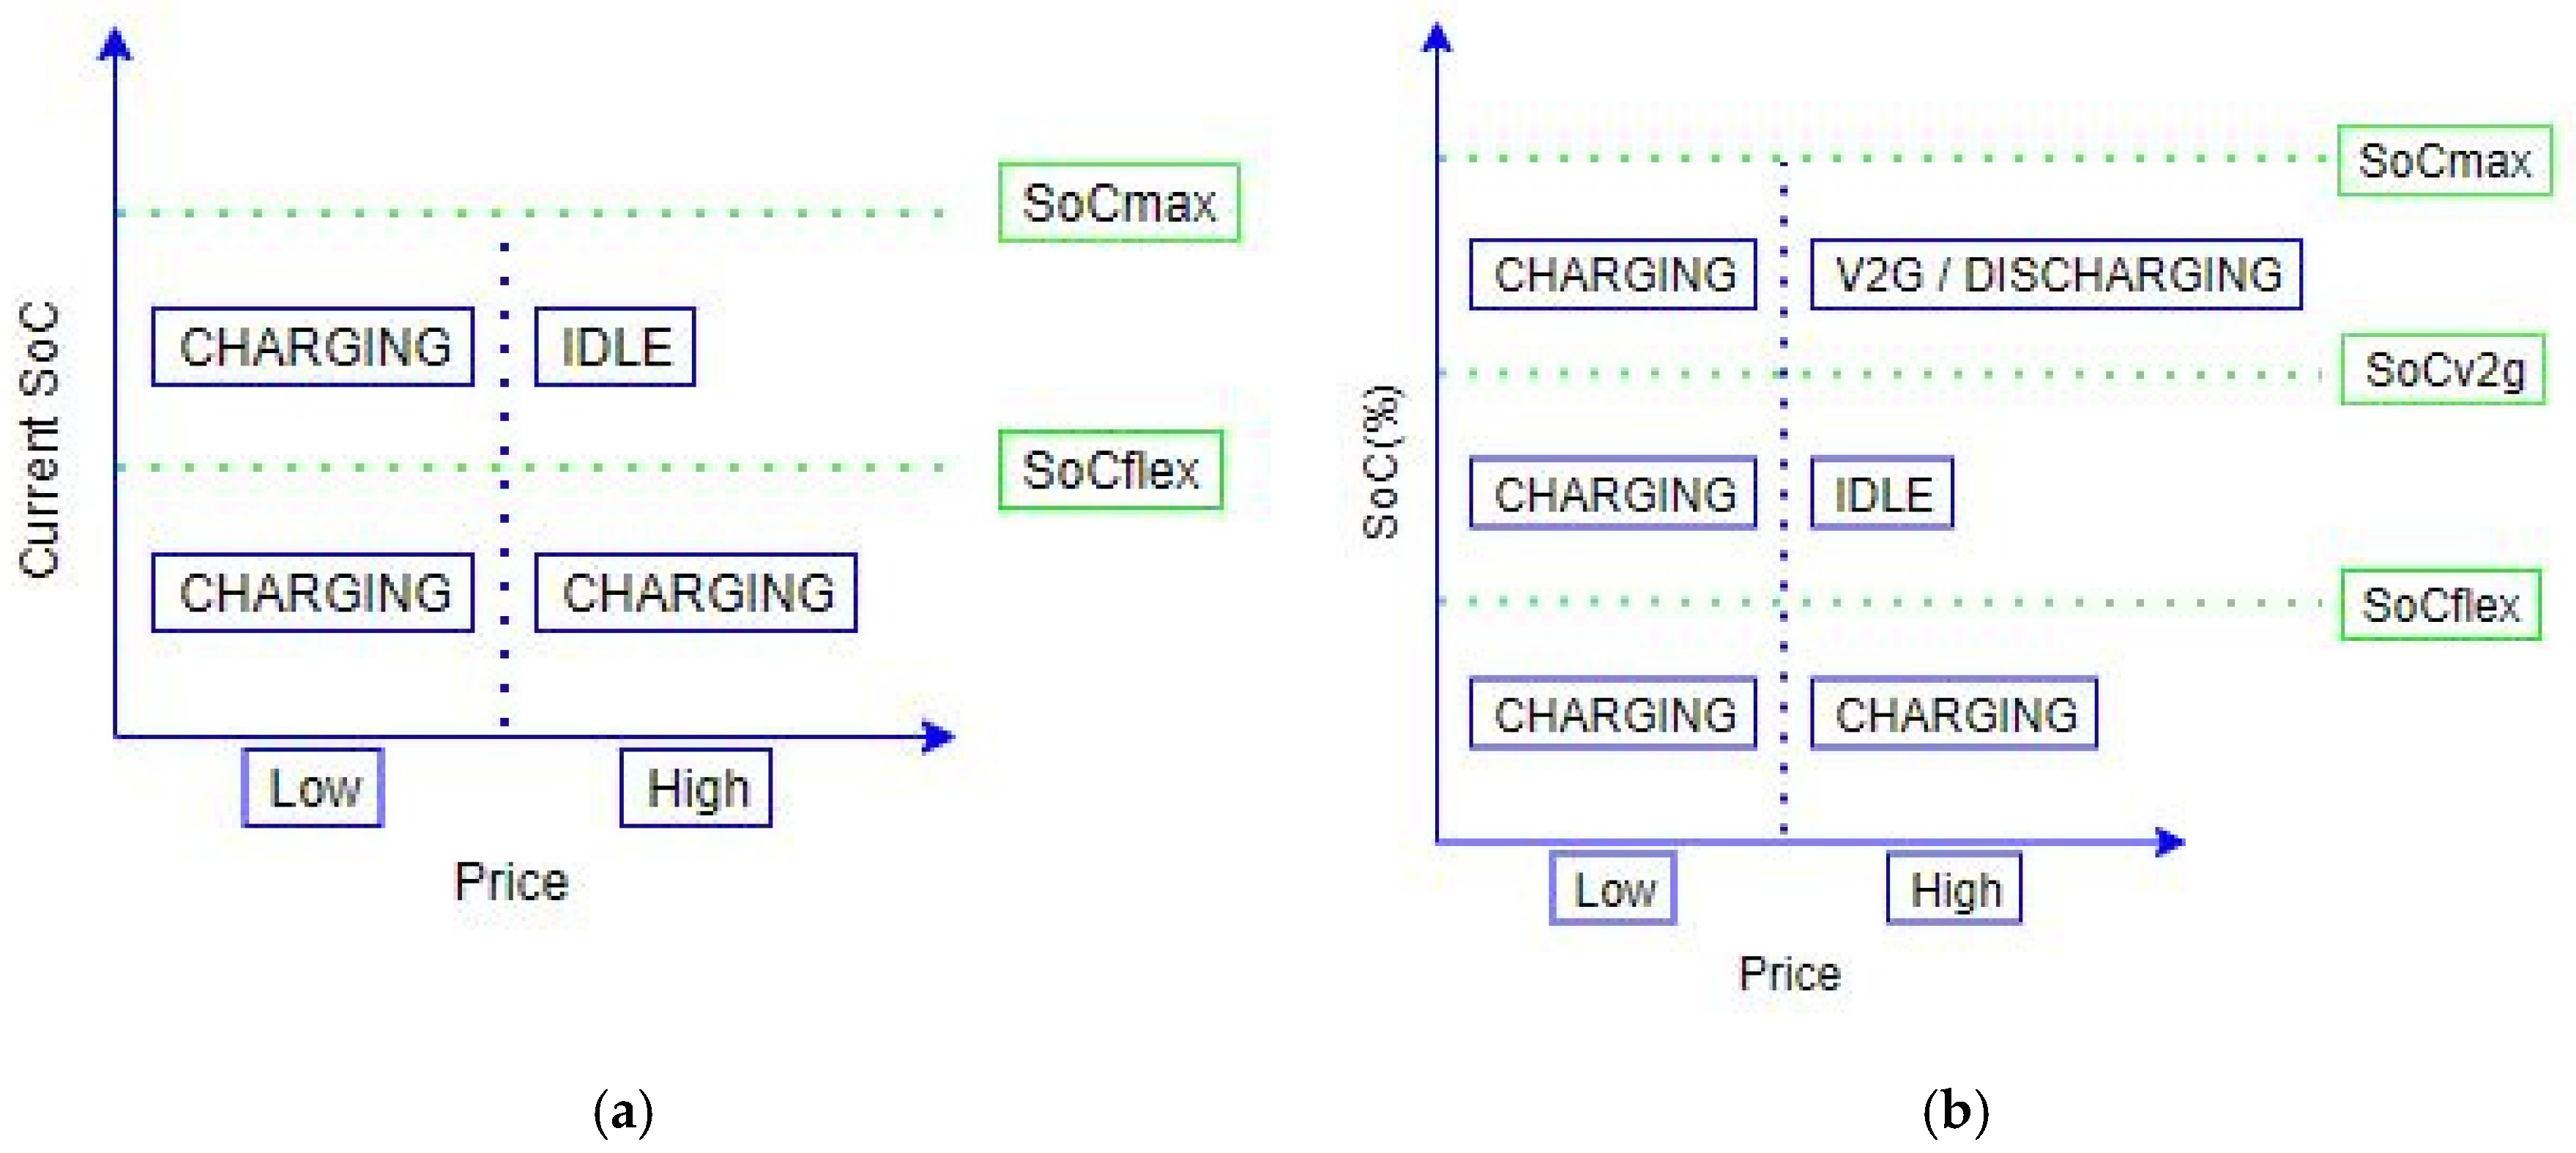
In this scenario, an electricity price criterion is used to determine whether the EVs that are plugged-in are going to charge or not; this way a charging session may be postponed.
Specifically, as
Figure 1a depicts, if the price of electricity is low, then the EV can start charging until it reaches its maximum SoC level. Otherwise (that is, if the electricity price is high), a charging session only starts if the SoC value is lower than a threshold, referred to as
. Equations (1) and (2) are again used for calculating the EVs’ battery SoC level according to their state.
2.3. Scenario 3
As with Scenario 2, price incentives are again offered to the EV owners so as to postpone a charging session. However, this scenario considers a more advanced charging policy where G2V and V2G operational modes are combined.
Figure 1b provides a visual description of the different modes that can be implemented during an EV plug-in session.
Specifically, when the EV is parked and if the price of electricity is low, then the EV can again charge up to the maximum level of . However, in the high price regime, the current SoC level of the EV () determines its charging behavior. Contrary to Scenario 2, herein two thresholds are defined: the , which again is the minimum required SoC level to allow for charging flexibility, and , which is higher than and allows the EV to start a V2G session, returning energy back to the grid.
Note that in this scenario the same power (
) is also used for discharging during V2G operations. Hence, herein Equations (1) and (2) are again used for charging and driving while Equation (3) describes the EV
SoC level reduction during discharging periods.
Finally, in order to determine if the electricity price is high or low at a specific time of day and hence decide on the specific charging action (see
Figure 1a,b), a price threshold (
) is considered. At any time during the day (
t), the high/low price regime of
Figure 1a,b is decided with a comparison between the current price value of electrical energy (
) and the threshold
.
3. Simulation and Analysis
3.1. Data Used
The transition probabilities that dictate the parking and driving states for each EV are calculated based on data drawn from the National Household Travel Survey (NHTS) [
1]. In brief, at each 30 min time interval, the number of vehicles that begin a trip as well as the number of vehicles that end a trip are extracted from the NHTS database and following the same approach of the work in [
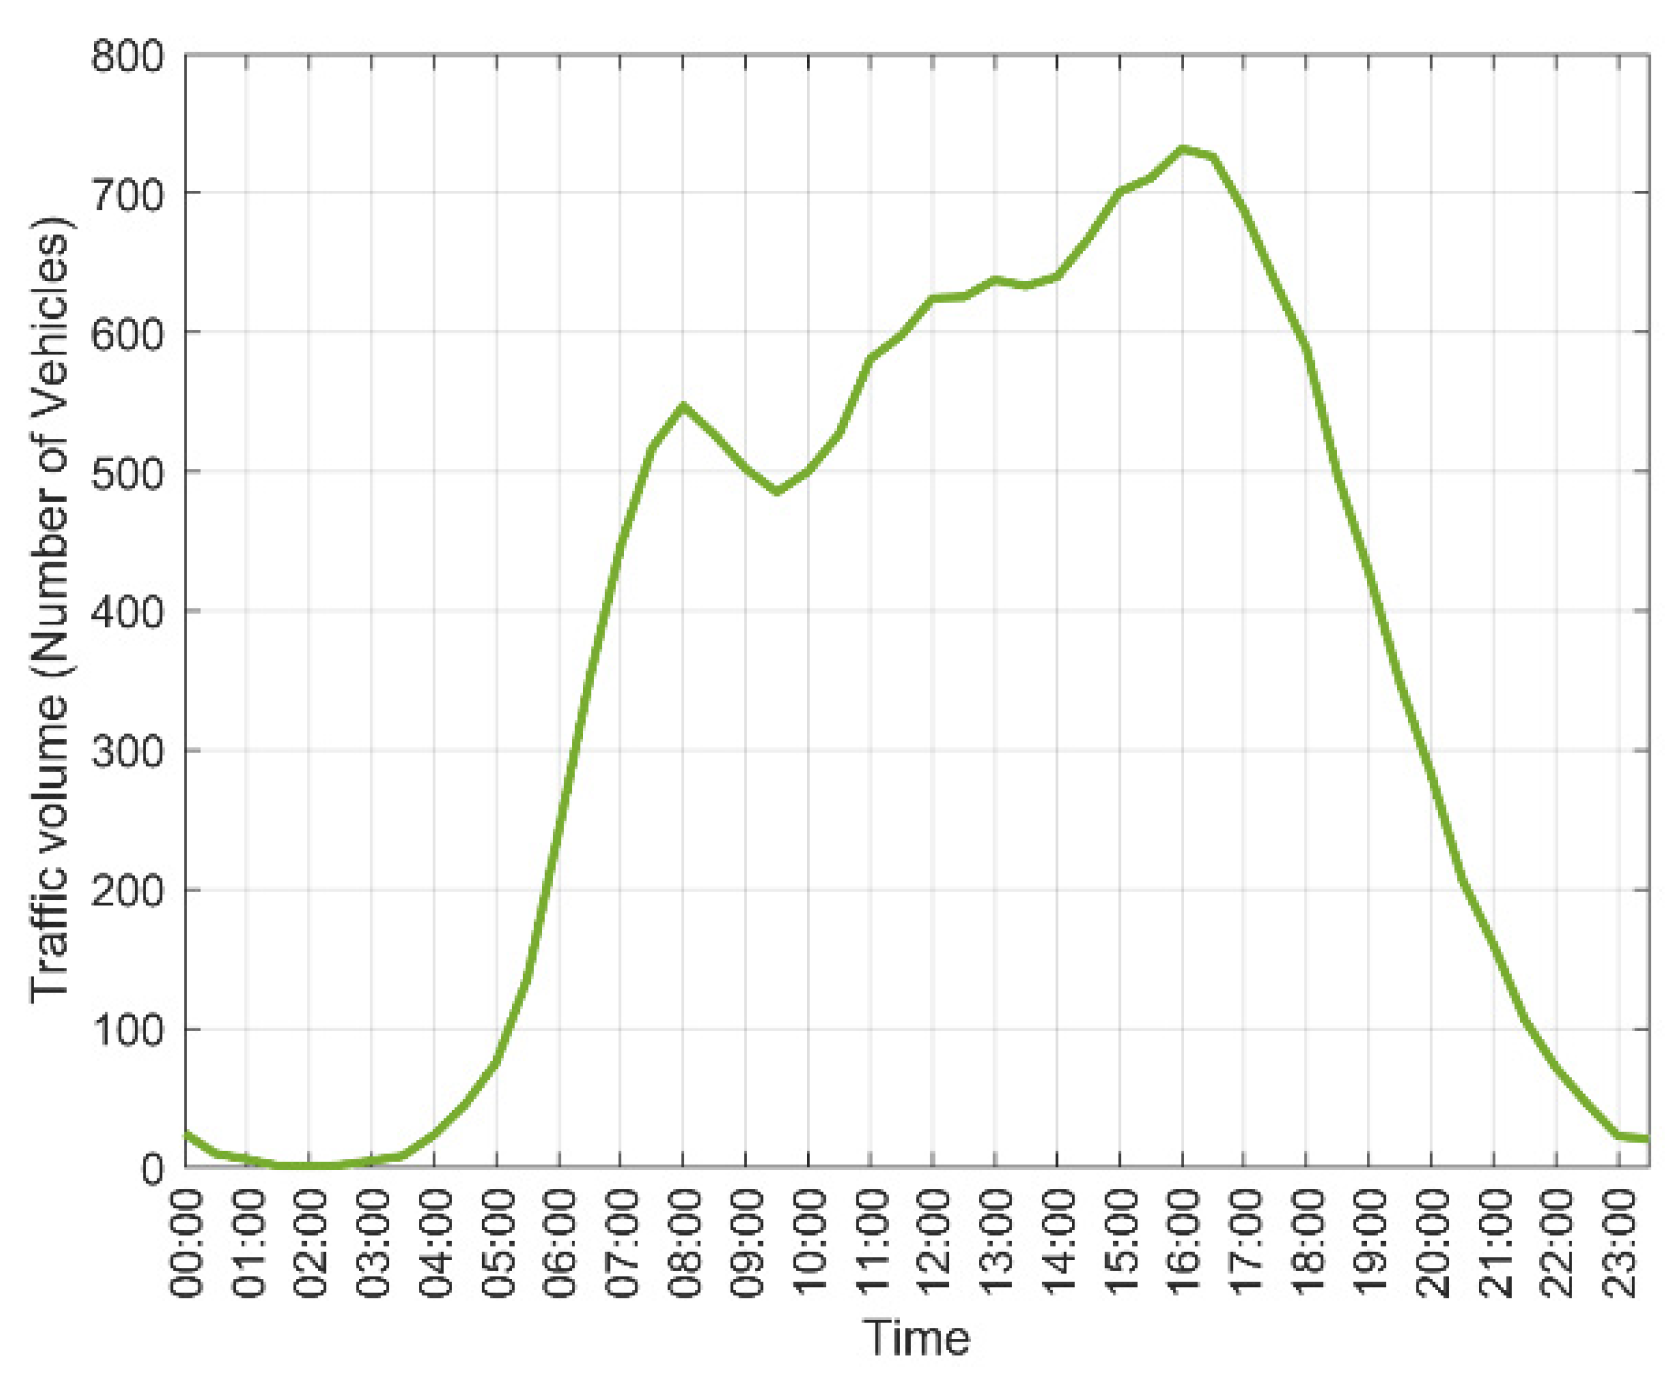
2], the transition probabilities are derived as the ratio of the number of vehicles changing their state, e.g., from parking to driving, to the number of vehicles maintaining their state. The data used concern a typical working day of the week;
Figure 2 provides an insight on the actual traffic that is considered in this work, depicting the average number of vehicles in driving mode throughout the day.
The price of electricity during 24 h (
) is drawn from data available in [
3], where historical market hourly data are available for several Εuropean countries. Regarding the threshold
, which is used in Scenarios 2 and 3, it is calculated as the average price over 24 h.
Finally, the hybrid vehicle, which is used in the simulation, is the BMW i3s [
4], whose specific parameters regarding consumption, battery capacity and charging power can be found in
Table 1.
3.2. Simulation Results
Herein the impact of the charging strategy (Scenario 1, Scenario 2, Scenario 3) as well as the impact of the vehicle driving speed is analyzed. Our focus is both on the network and on the EV owner side; hence, apart from the load that will be added to the electrical grid due to the EV’s operation, the cost that the EV owner must pay is also considered. Specifically, we are interested in the average SoC level of the EV throughout the day, the load per EV that needs to be considered by the local electric grids on top of the already established load characteristics, and the average cost of driving a PHEV; cost due to both charging (EV operation) and fuel consumption. Aggregated results of these parameters targeting the duration of an entire day (24 h) will be used to provide practical insights on how price incentives to EV owners can be used as an adjustable parameter for load balancing.
Table 1 summarizes all parameters involved in the simulations.
Table 1.
Simulation parameters.
Table 1.
Simulation parameters.
| Parameter | Value |
|---|
| 2000 vehicles |
| ) | 70% |
| Δt | 0.5 h |
| Charging power | 11 kW |
| Battery capacity (100%) | 42.2 kWh |
| Vehicle consumption (battery) | 16.5 kWh (100 km) |
| Vehicle consumption (fuel) | 1.9 lit (100 km) |
| Battery level (minimum) | ~1% |
| Number of days (simulation) | 5 |
| Fuel cost | 1.34 euros/liter [5] |
| 60% |
| 80% |
| 0.039 €/kWh |
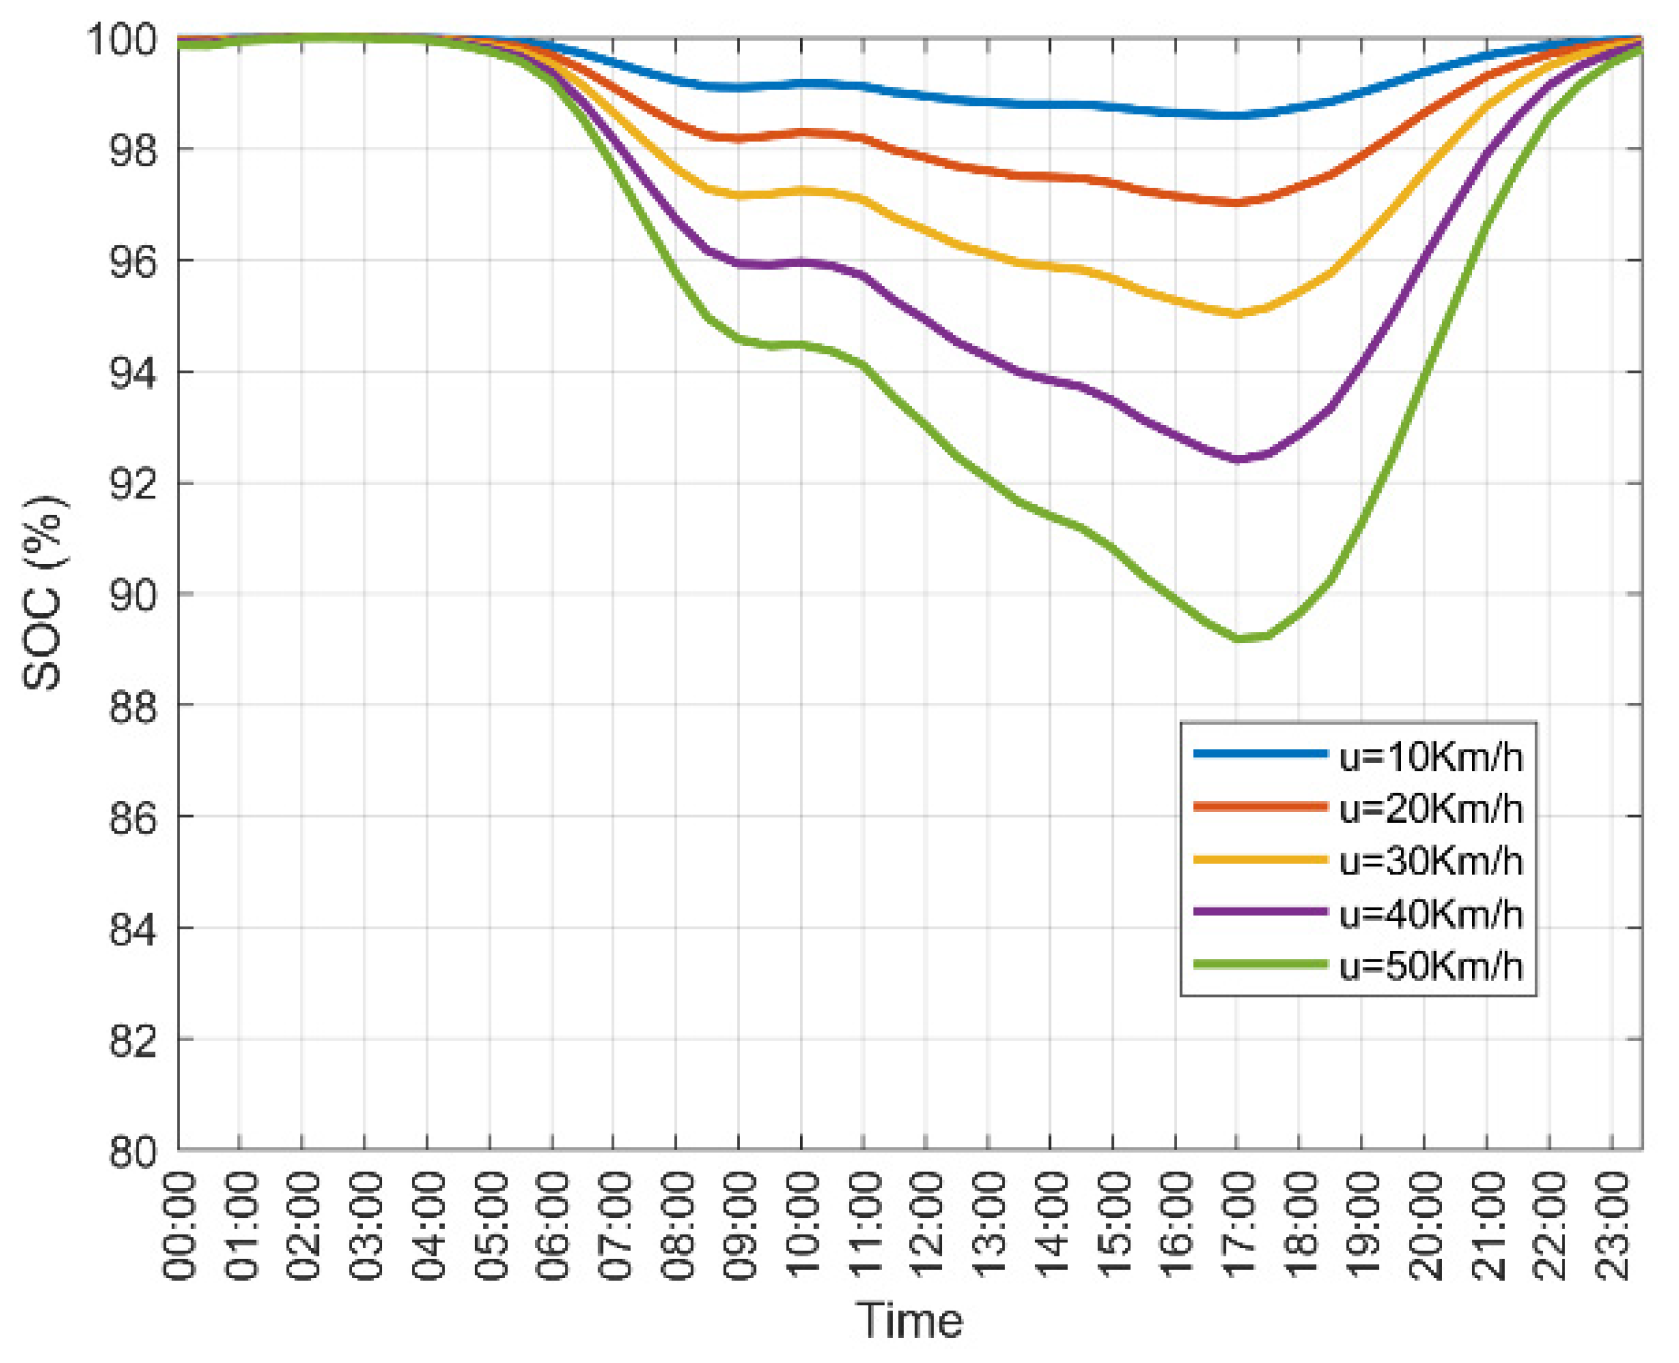
Figure 3 shows the average level of SoC for Scenario 1. As the driving speed increases from 10 km/h to 50 km/h, the average level of SoC decreases. For low driving speeds, i.e., 10 km/h and 20 km/h, the average level of SoC is greater than 96% throughout the day. Even for an average driving speed as high as 50 Km/h, the SoC level only drops to ~89%, indicating that when EV users follow the typical urban driving pattern (see also
Figure 2 for the traffic volume), they can exclusively rely on the EV battery for their daily travel needs.
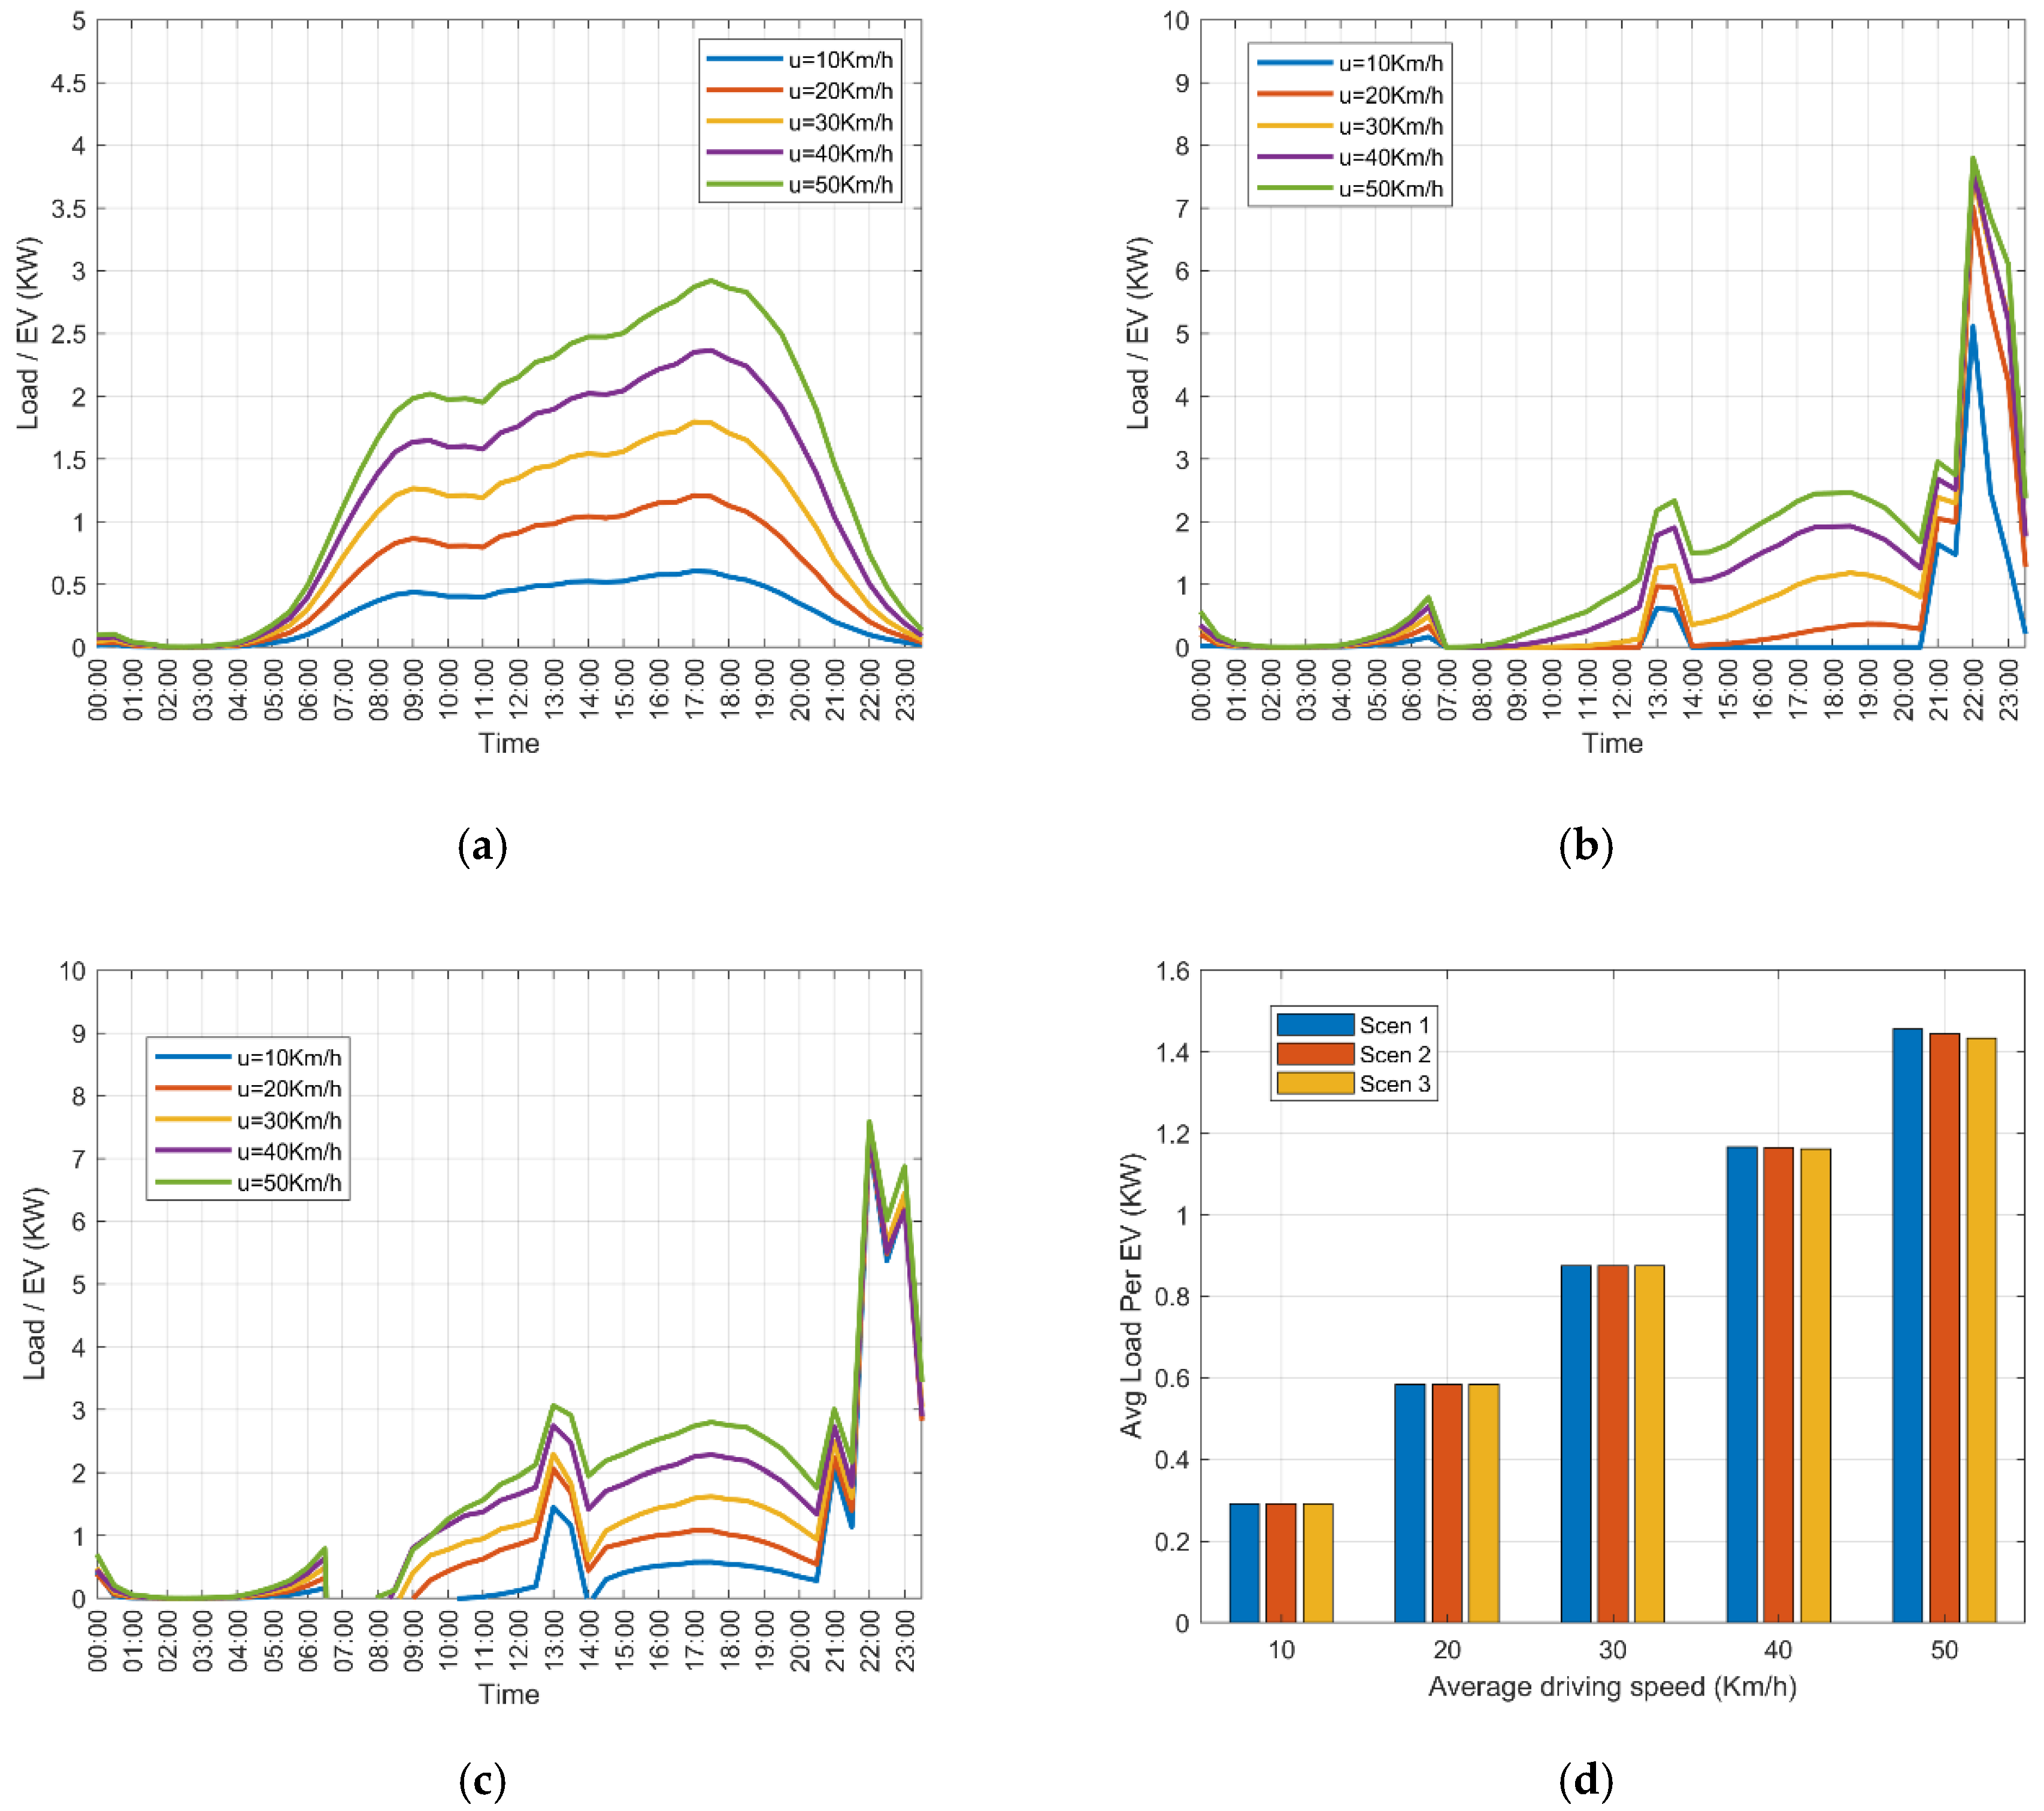
Figure 4a refers to the additional load per EV due to charging throughout the day according to Scenario 1. The peak time is around 17:30 with a value ranging from ~0.5 kW when the EV user keeps a low driving speed, to 3 kW when the driving speed is as high as 50 km/h.
In
Figure 4b,c, the load per EV according to Scenarios 2 and 3 is shown. According to these charging policies, the peak load shifts from around 17:30 (Scenario 1) to 22:00–23:00 (Scenarios 2 and 3). In the same context,
Figure 4d represents the load per EV averaged over the 48 time intervals; note that the simulation considers a time interval of 30 min (
Table 1) leading to 48 samples during a 24 h time span. This figure validates the previous observation regarding Scenarios 2 and 3, i.e., introducing price incentives for the EV users does not actually modify the total load added to the grid during the day from EVs’ charging but it only shifts the load to different time periods.
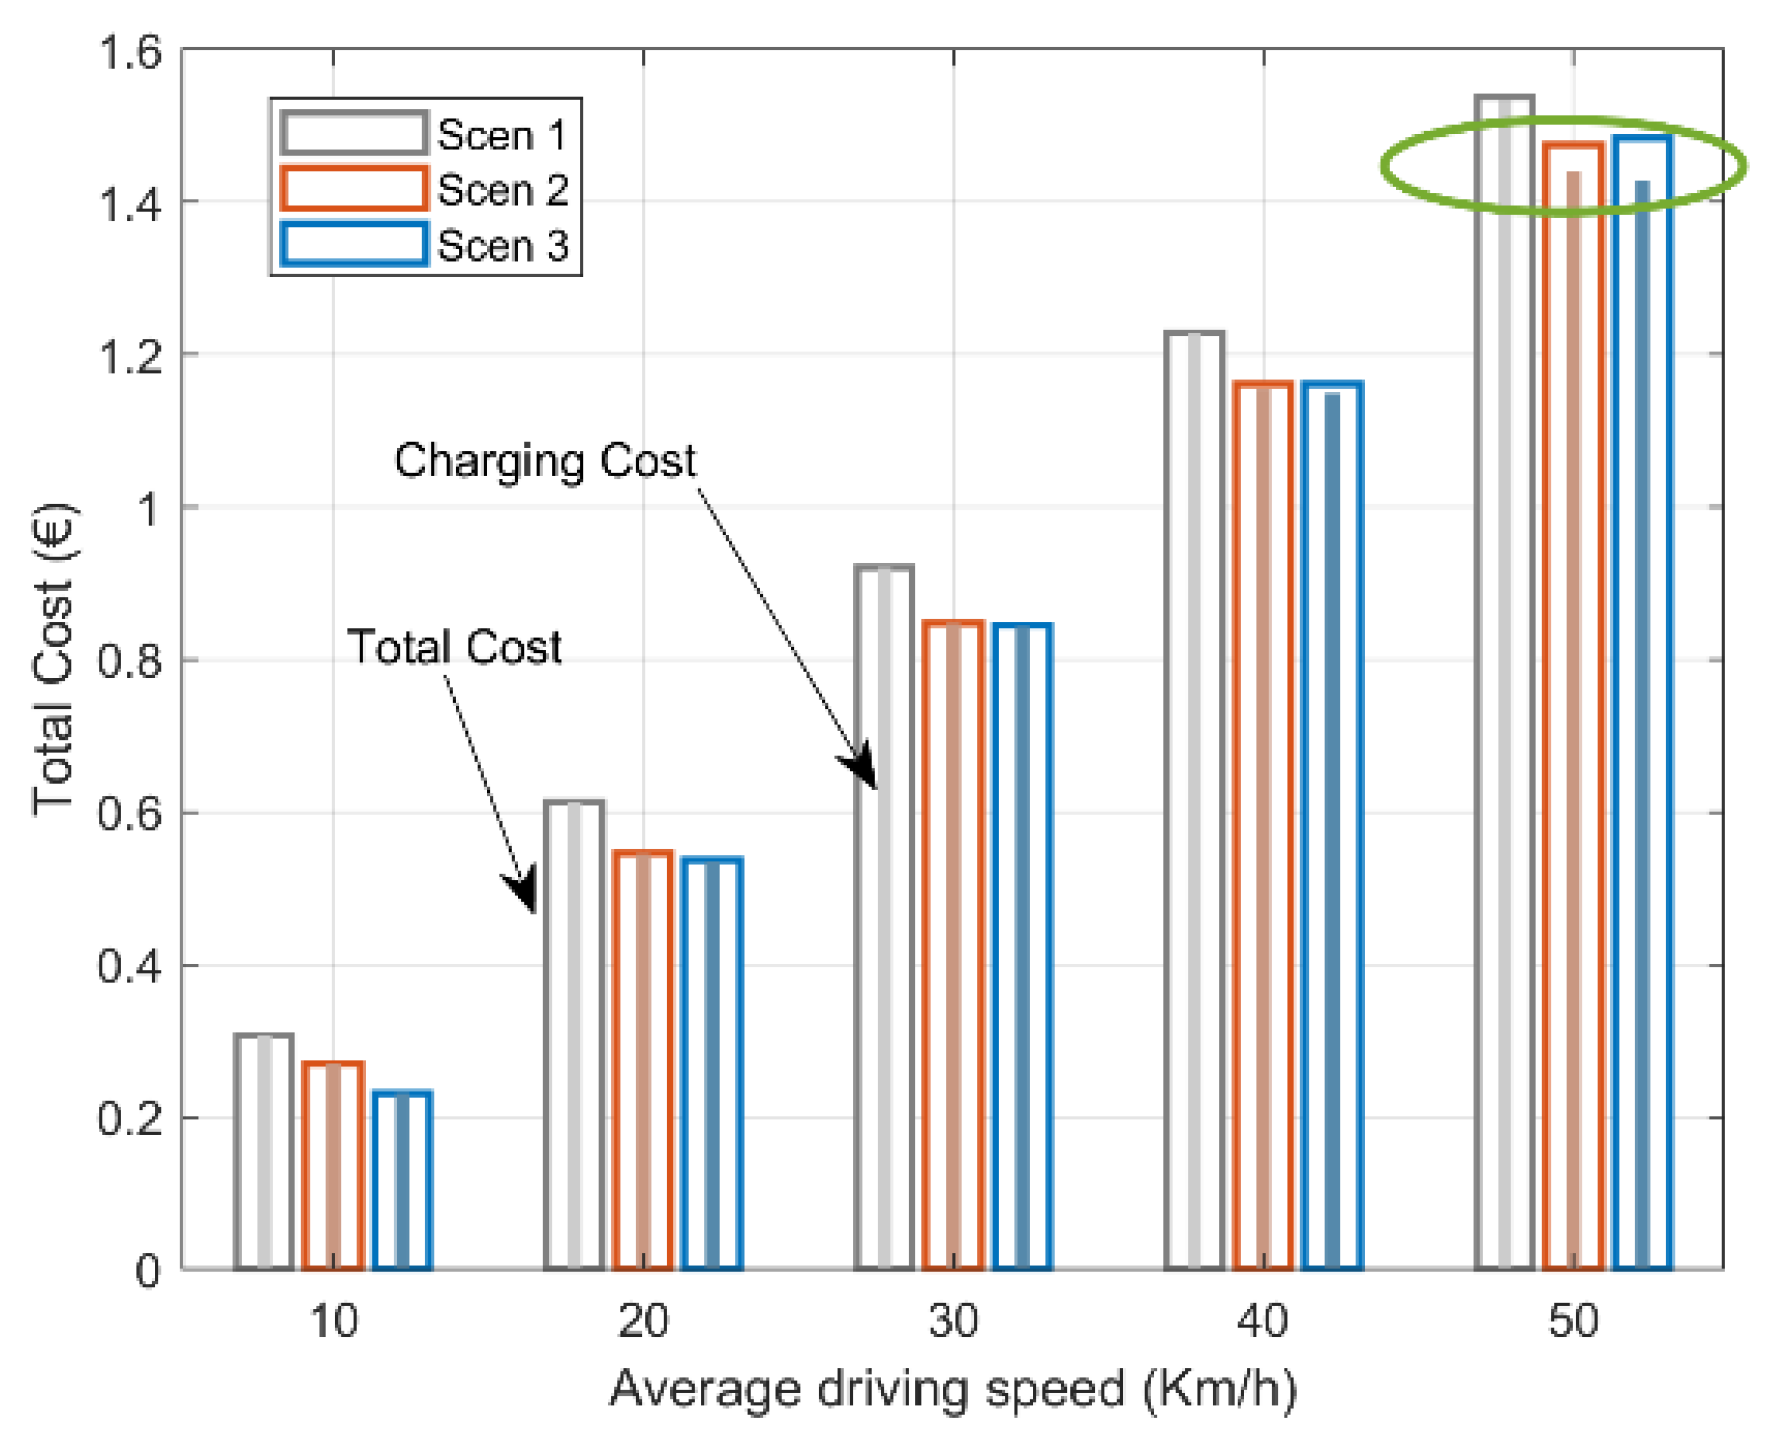
Finally,
Figure 5 shows the cost that a PHEV user should pay during the day for covering daily travelling needs (again, a typical urban driving pattern is considered). The total cost combines expenses for charging as well as for fuel consumption when the PHEV must switch to fuel due to insufficient battery levels. As
Figure 5 suggests, the charging costs are equal to total costs for average driving speeds from 10 to 40 km/h, indicating that EVs do not use their fuel cell at all. On the other hand, when EVs travel at 50 km/h, the total costs are slightly higher than the charging costs (see the green ellipse on
Figure 5). Additionally, there is a clear cost gain for the EV user for employing a charging strategy utilizing price incentives, i.e., Scenarios 2 or 3.
4. Conclusions and Future Work
This work focuses on the possible benefits emerging from introducing price incentives for EV users into the charging policies; price incentives are considered in the context of G2V as well as V2G systems. Preliminary results highlight the clear potential of such charging strategies both for the EV owners and the DSOs. Specifically, EV owners can benefit from reduced charging costs while DSOs can indirectly manage the demand according to their needs by employing the necessary price fluctuations.
Simulations are under way that are investigating the grid load sensitivity to the price incentives, the battery characteristics, as well as the EV user driving profiles and battery load preferences.


