XRD Data Visualization, Processing and Analysis with d1Dplot and d2Dplot Software Packages †


Abstract
:1. Introduction
2. Features Overview
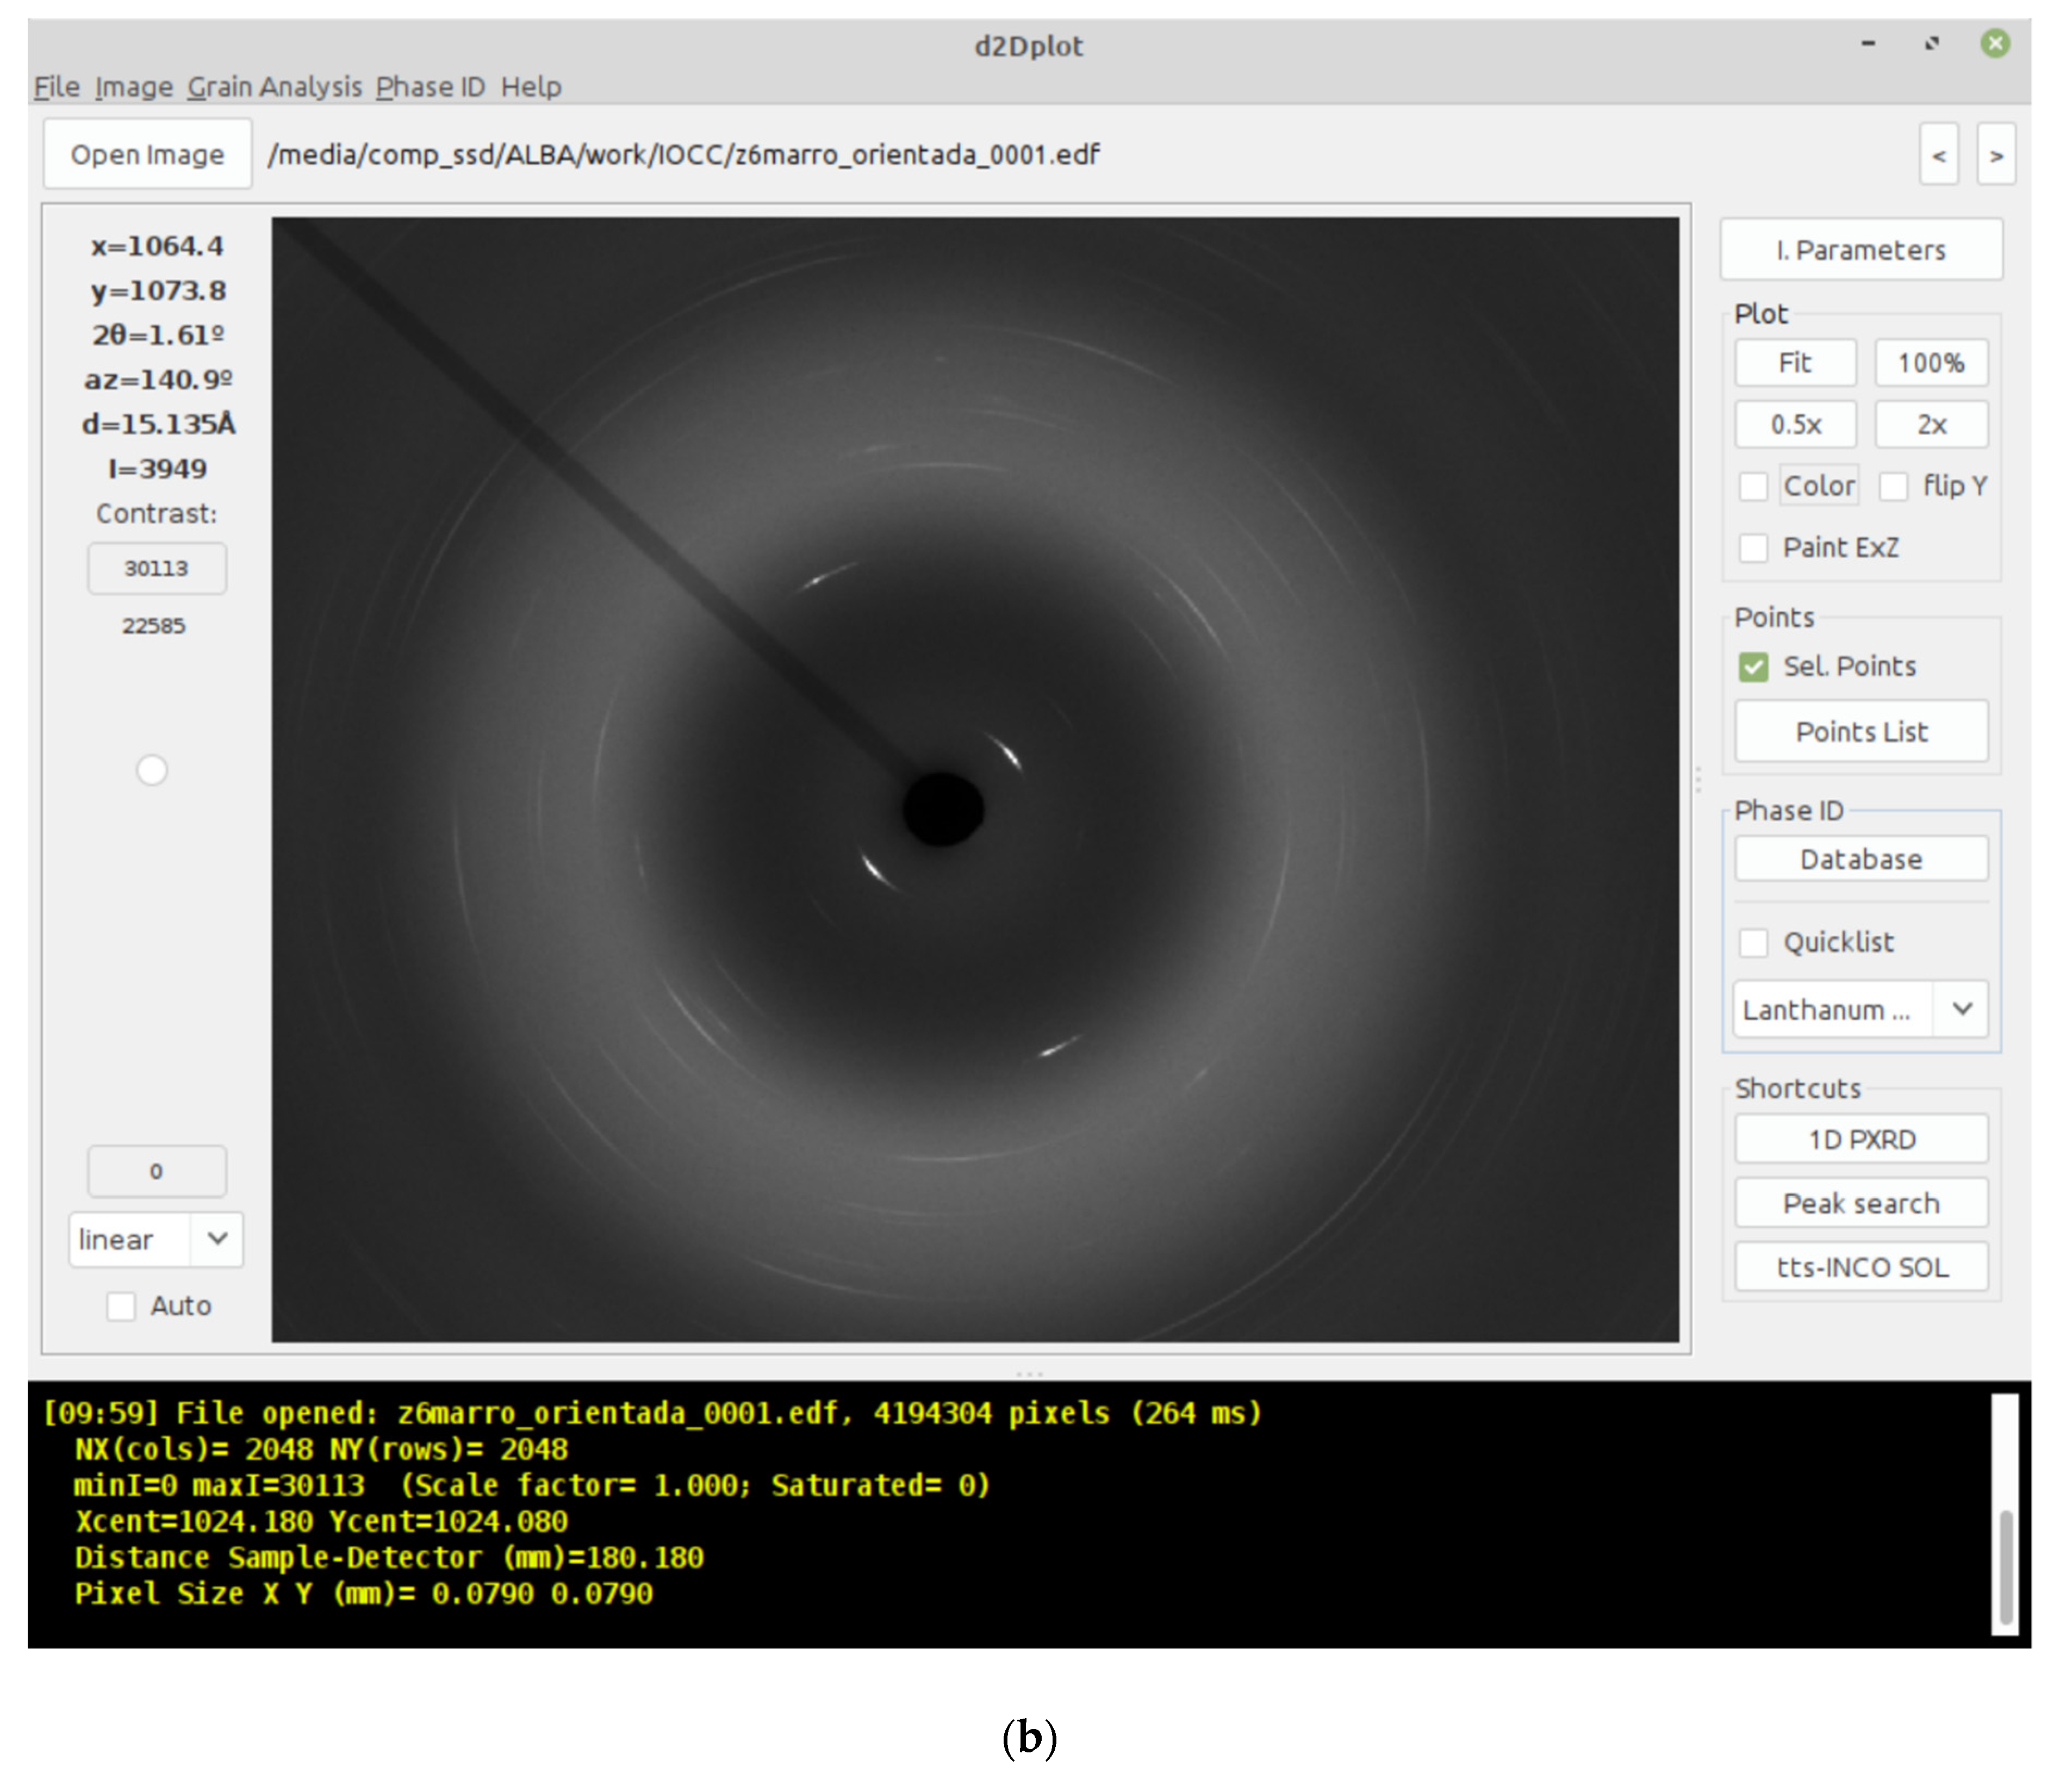
2.1. d2Dplot
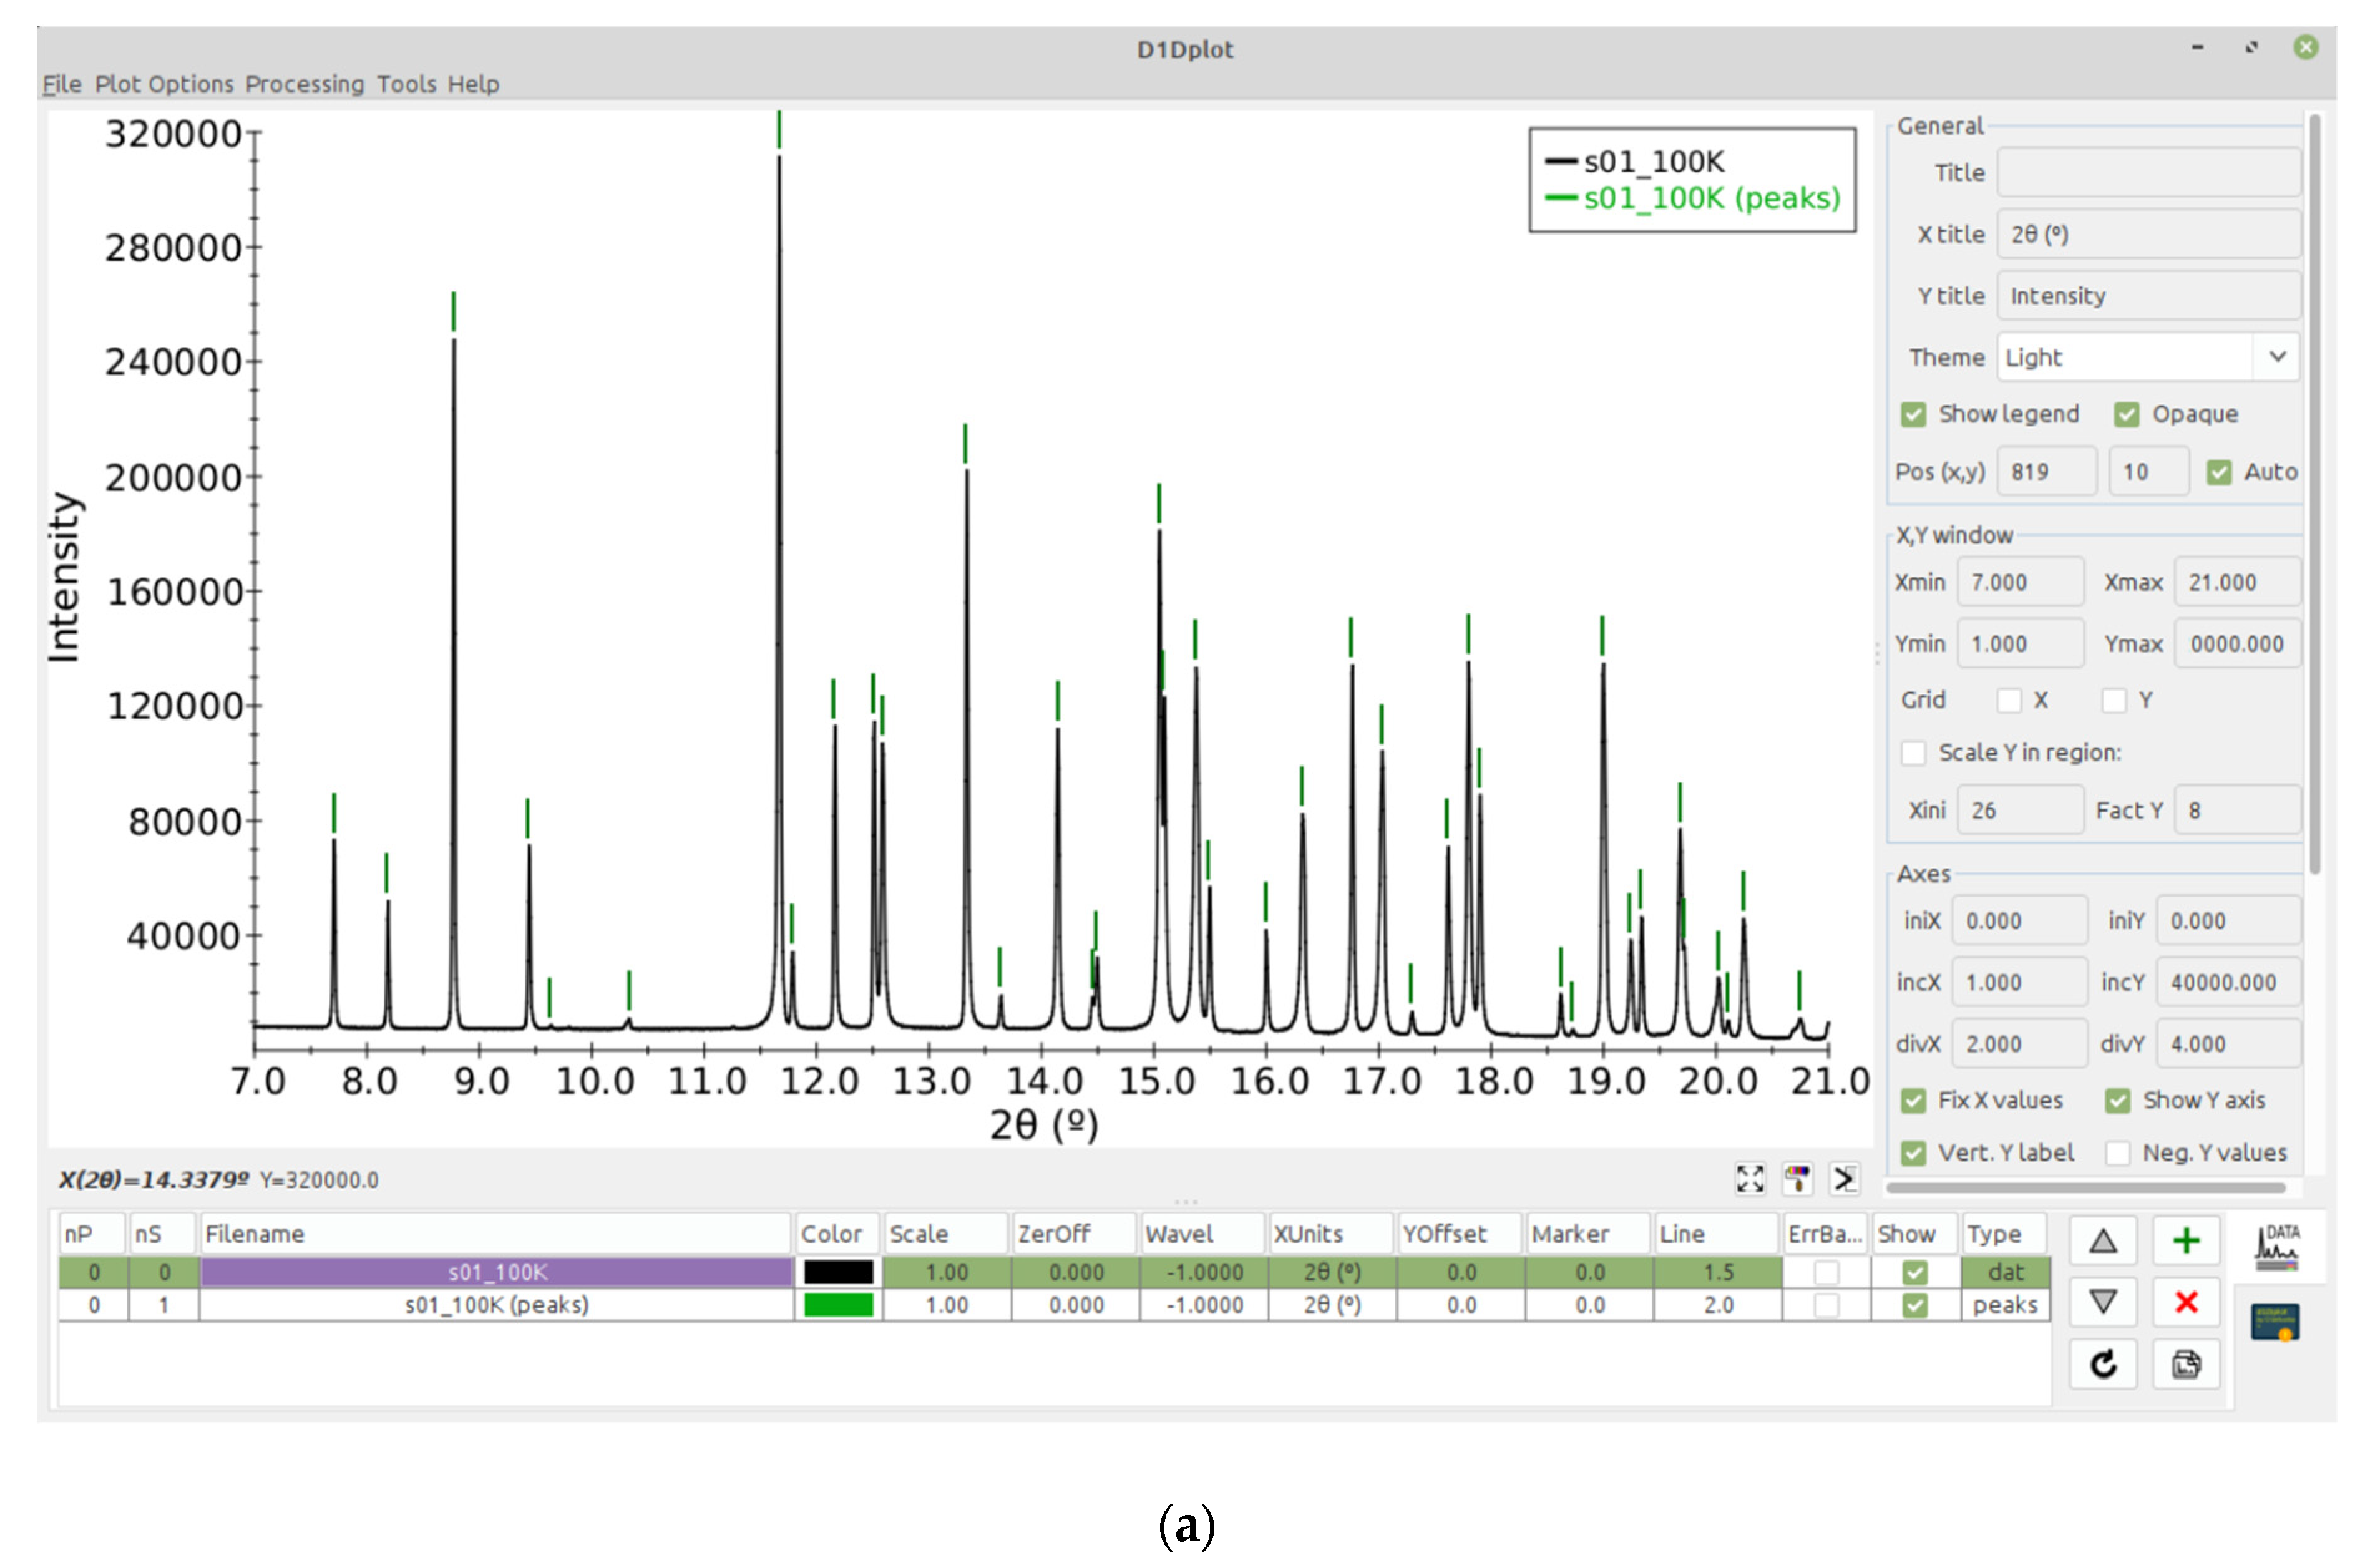
2.2. d1Dplot
- nP: Pattern number.
- nS: Series number. One pattern may contain multiple series (data, background, peaks, etc…)
- Name: Name of the series (by default the filename).
- Color: Color of the series.
- Scale: Y scale of the series.
- ZerOff: Offset of the series in the X axis.
- Wavel: Wavelength of the pattern.
- Xunits: Units of the X-axis. By default 2θ.
- YOffset: Offset of the series in the Y axis.
- Marker: Marker size.
- Line: Line width.
- ErrBars: To show the error bars on Y.
- Show: To show or hide the current series on the plot area.
- Type: To differentiate and apply different plotting styles depending on the content of the data series (powder XRD data, peaks, background estimation or discreet 2θ values to be used as reference of crystallographic phases).
2.3. Compound Database
2.4. Comand-Line Mode
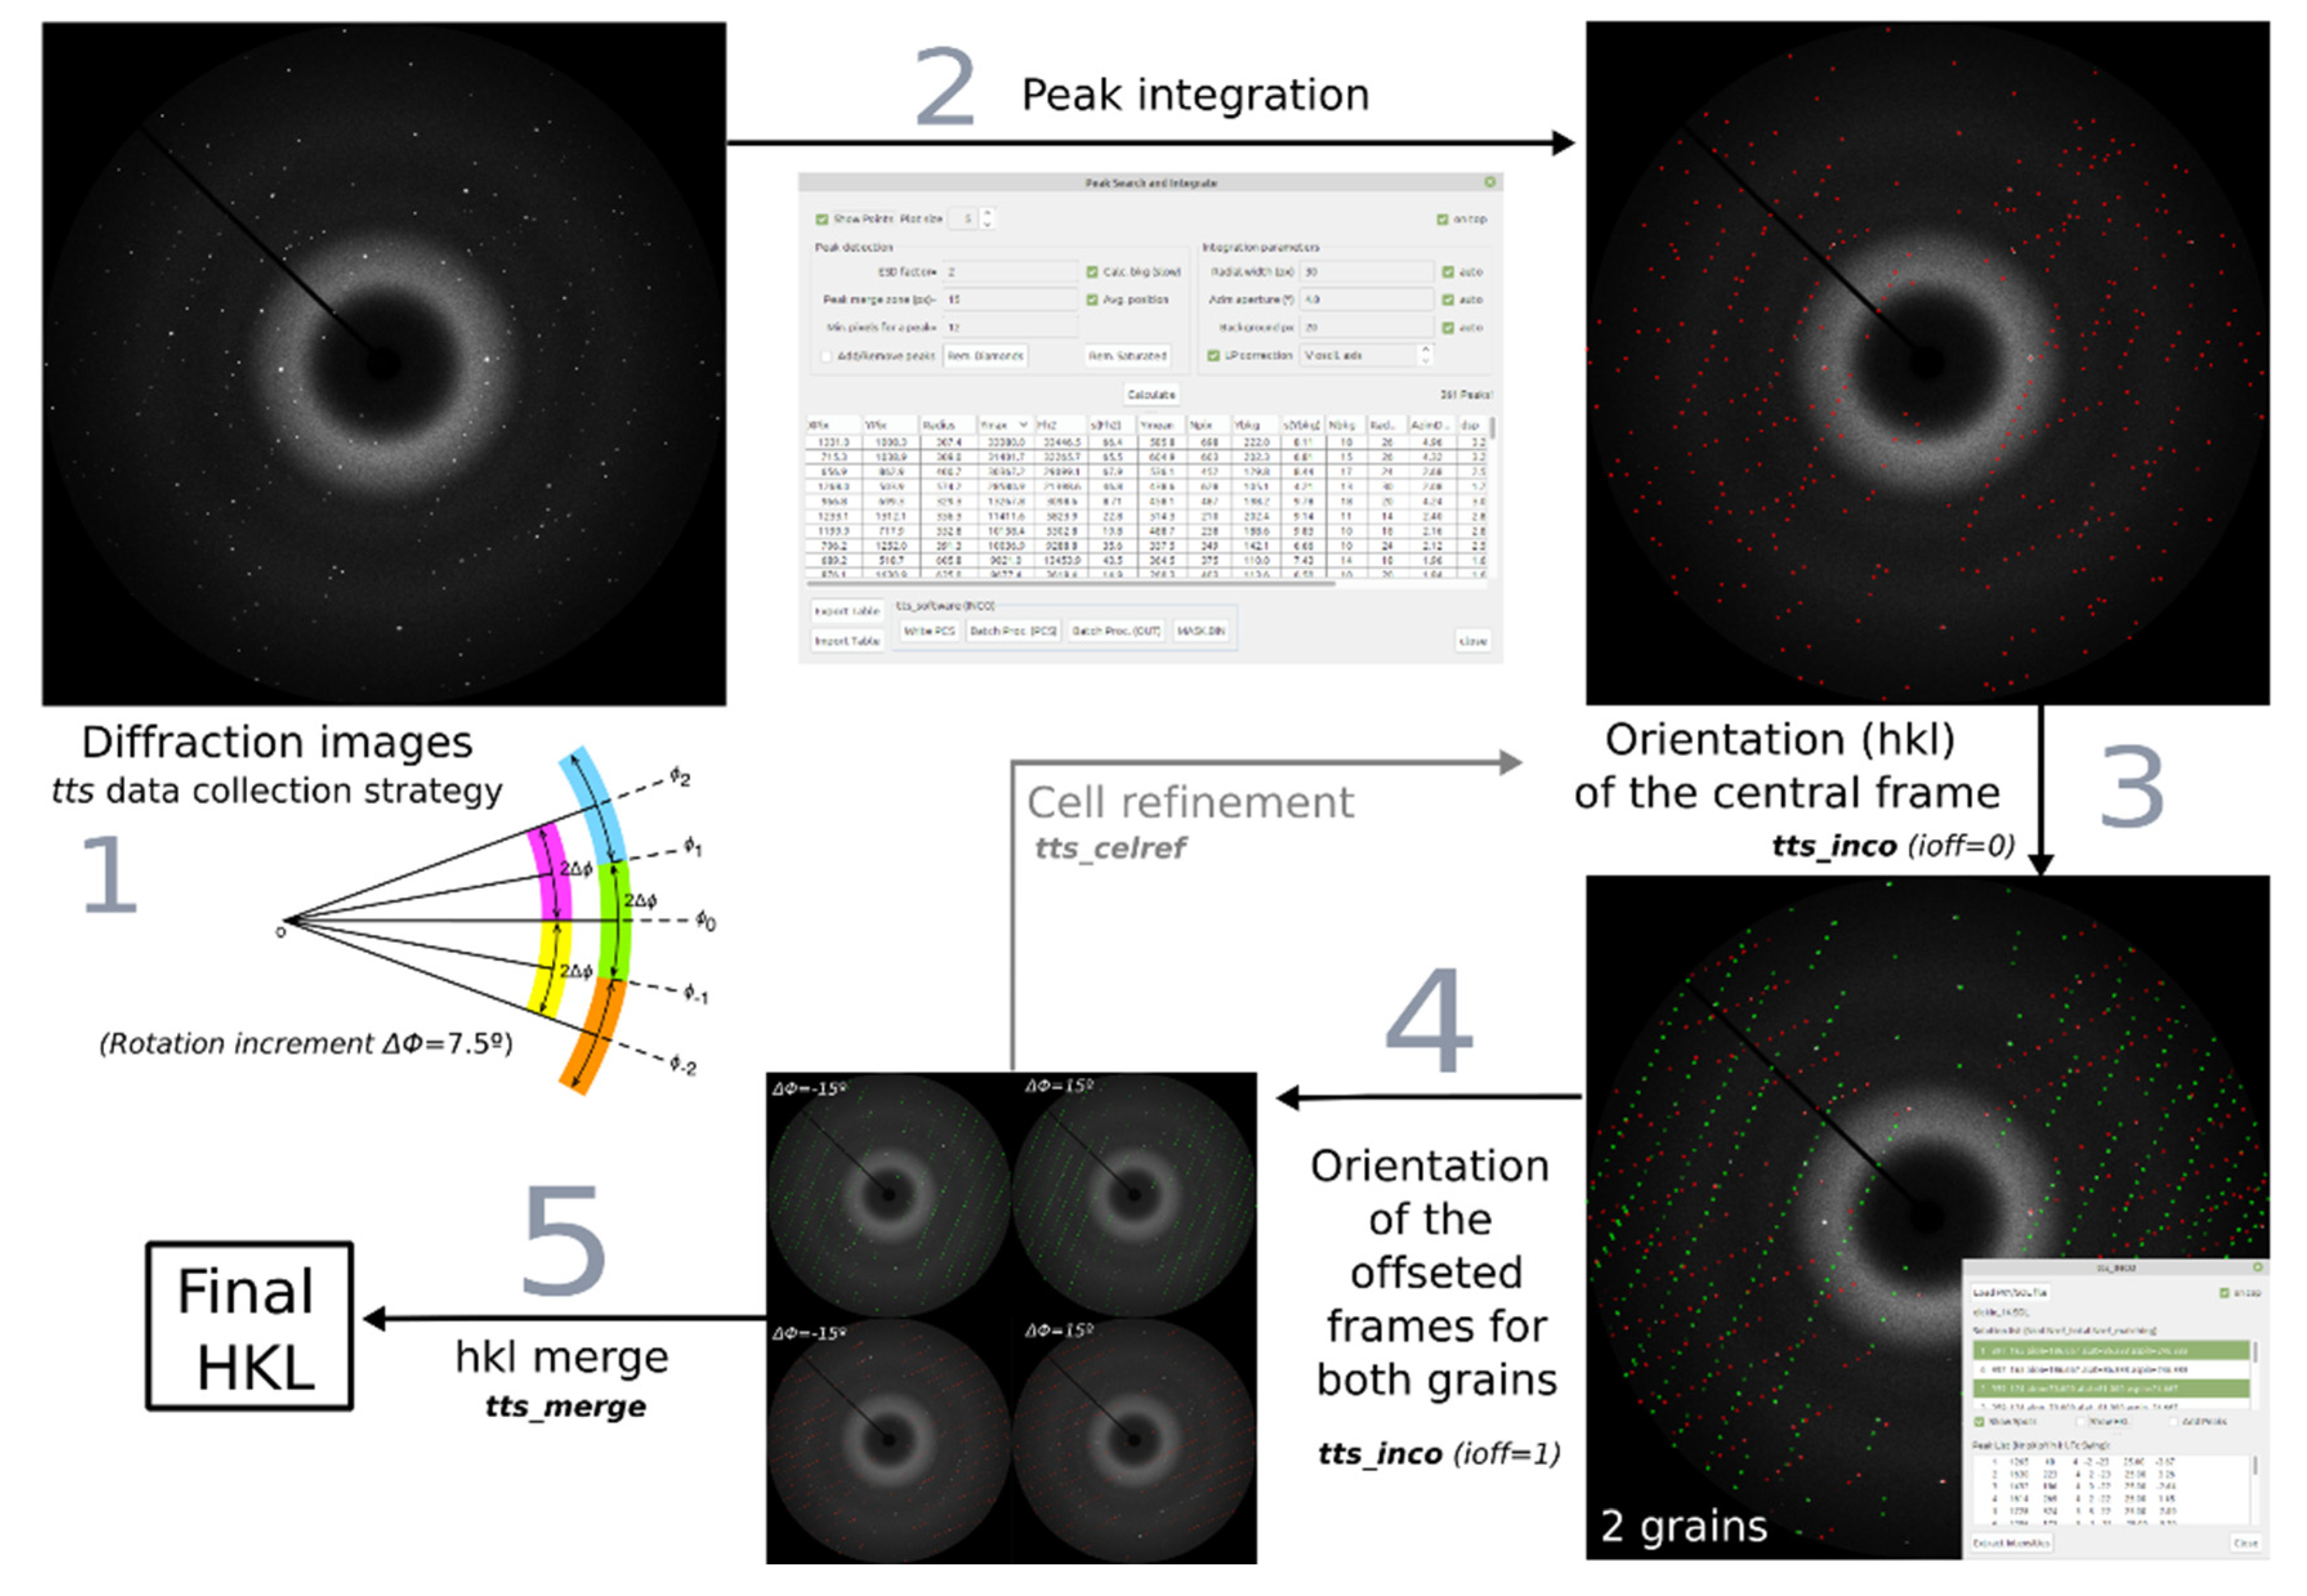
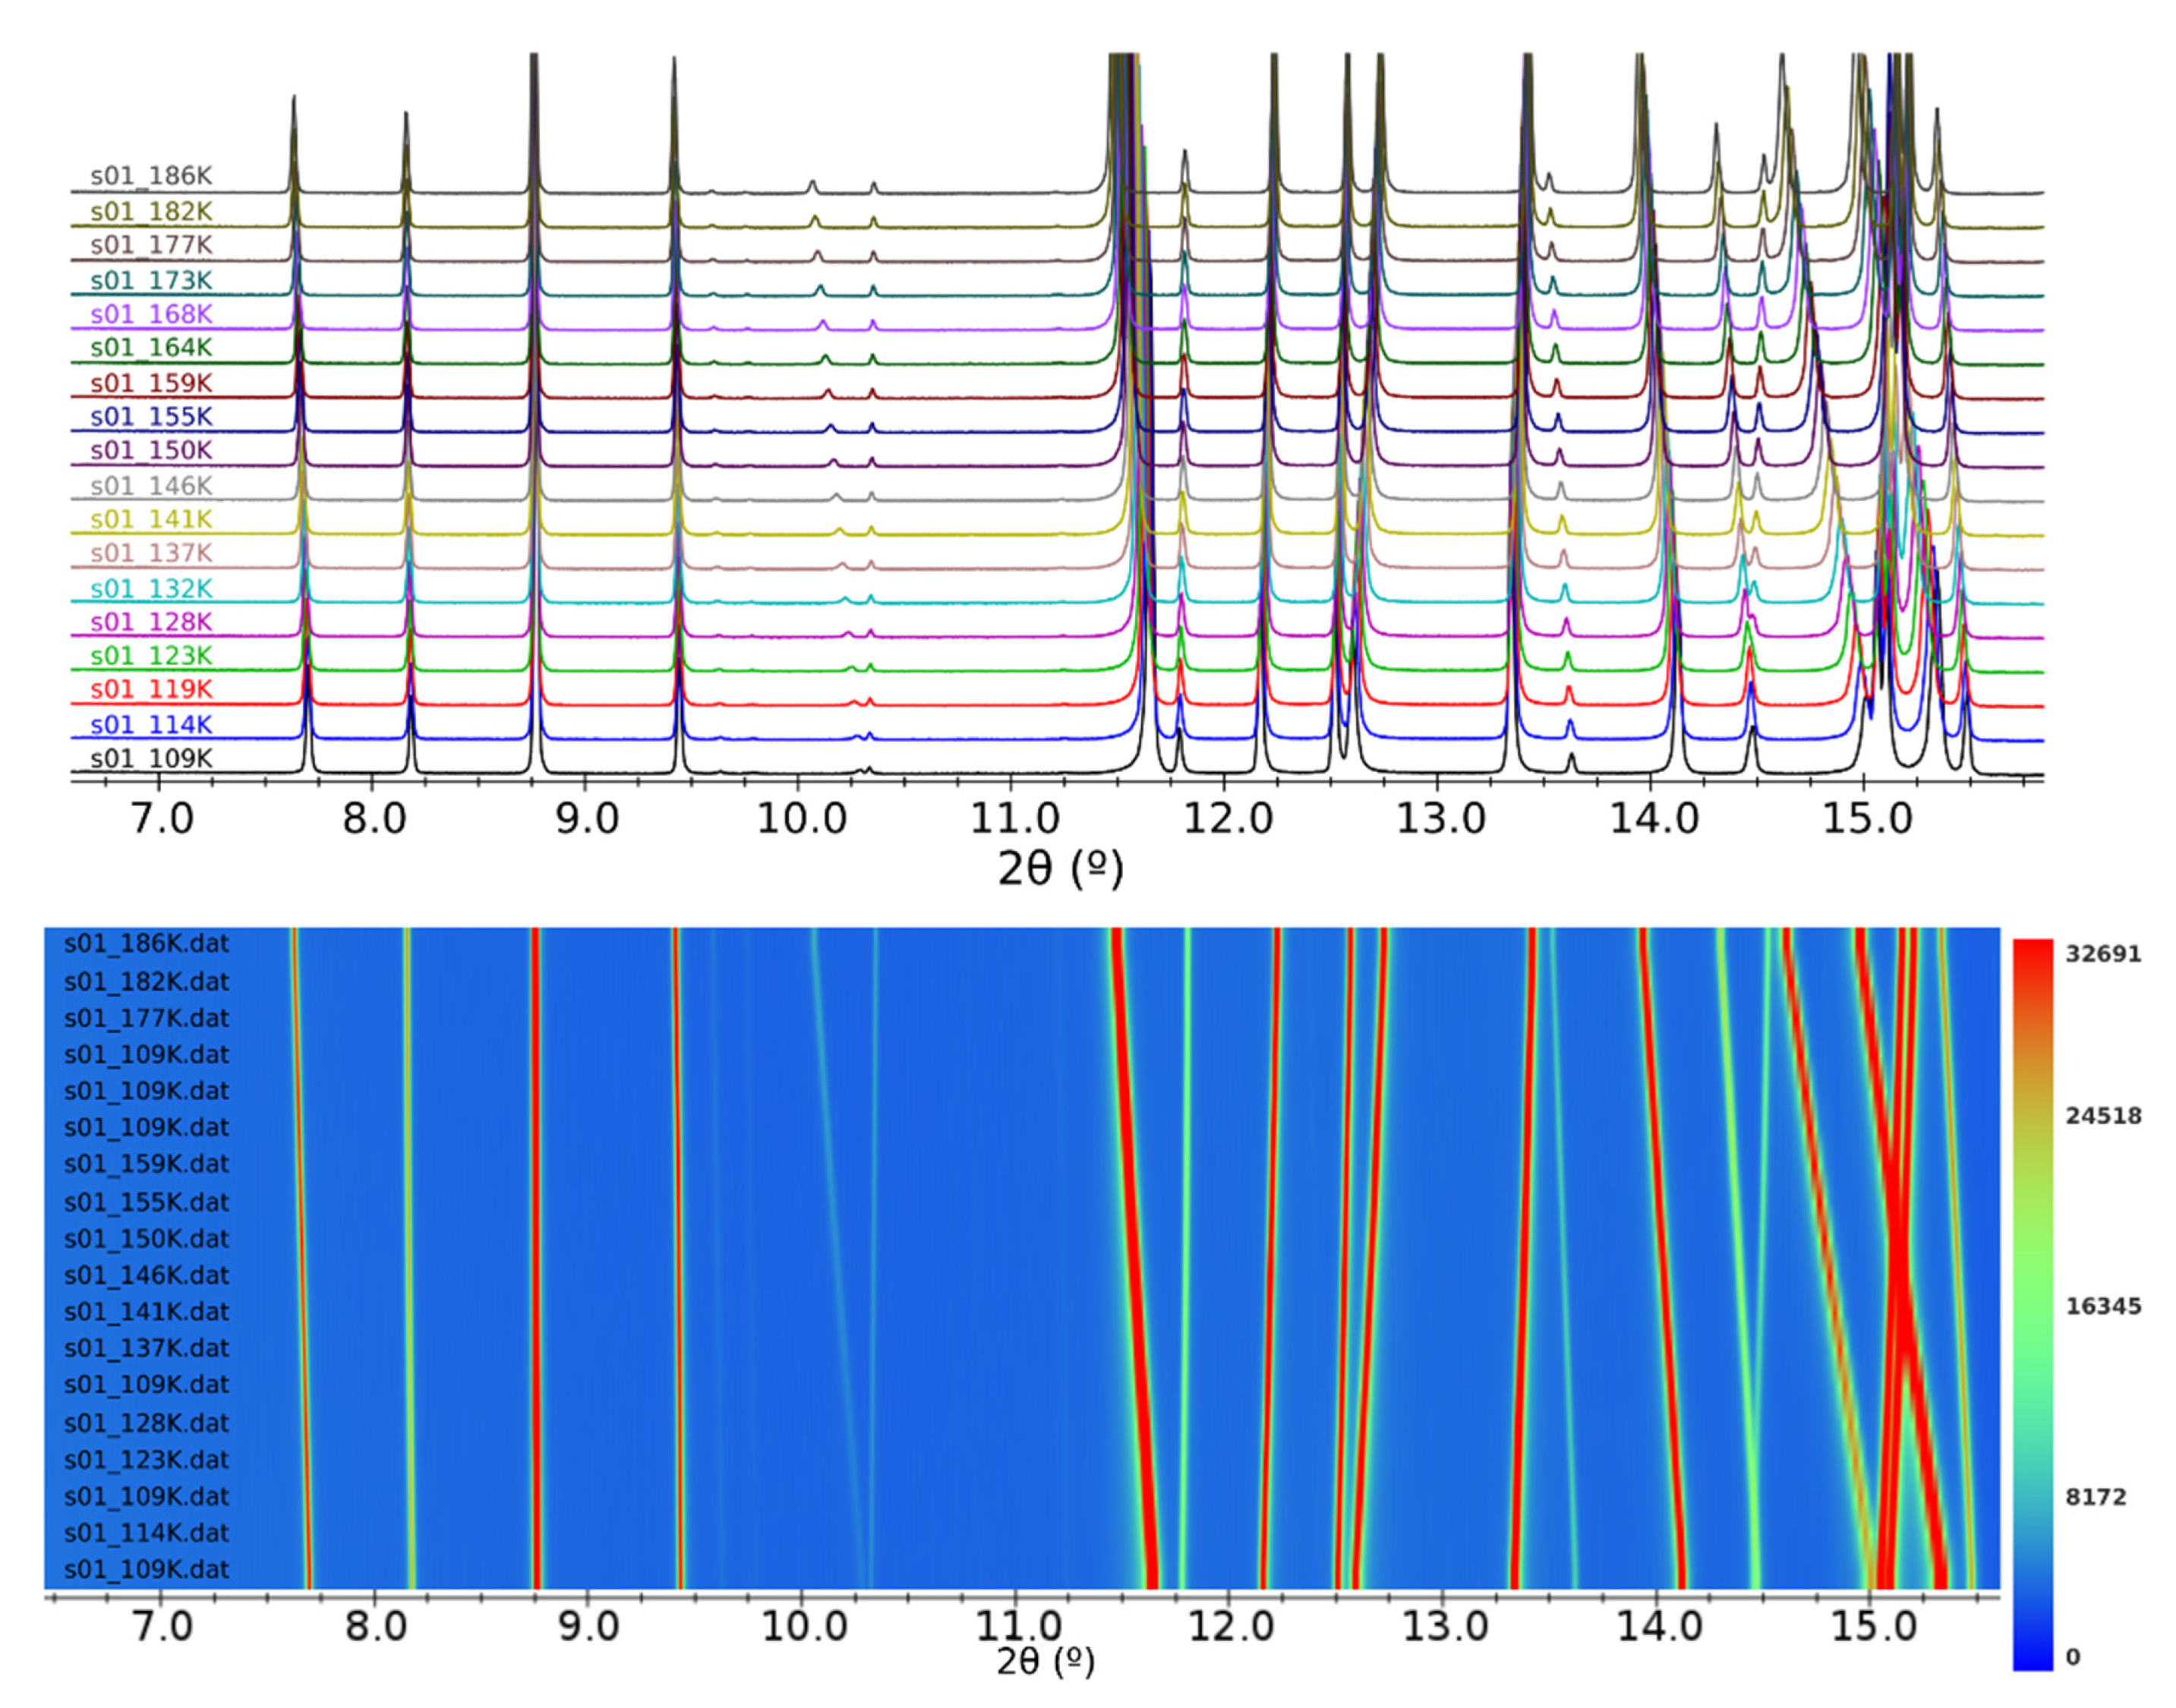
3. Applications
4. Technical Description and Availability
Author Contributions
Funding
Acknowledgments
Conflicts of Interest
References
- Vallcorba, O.; Rius, J. d2Dplot: 2D X-ray diffraction data processing and analysis for through-the-substrate microdiffraction. J. Appl. Crystallogr. 2019, 52, 478–484. [Google Scholar] [CrossRef]
- Rius, J.; Vallcorba, O.; Frontera, C.; Peral, I.; Crespi, A.; Miravitlles, C. Application of synchrotron through-the-substrate microdiffraction to crystals in polished thin sections. IUCrJ 2015, 2, 452–463. [Google Scholar] [CrossRef]
- Rius, J. Novel phasing method using the origin-free modulus sum function expressed in terms of the absolute electron density. Acta Crystallogr. Sect. A Found. Adv. 2020, 76, 489–493. [Google Scholar] [CrossRef]
- Vallcorba, O.; Rius, J.; Frontera, C.; Peral, I.; Miravitlles, C. DAJUST: A suite of computer programs for pattern matching, space-group determination and intensity extraction from powder diffraction data. J. Appl. Crystallogr. 2012, 45, 844–848. [Google Scholar] [CrossRef]
- Vallcorba, O.; Rius, J.; Frontera, C.; Miravitlles, C. TALP: A multisolution direct-space strategy for solving molecular crystals from powder diffraction data based on restrained least squares. J. Appl. Crystallogr. 2012, 45, 1270–1277. [Google Scholar] [CrossRef]
- Roisnel, T.; Rodríquez-Carvajal, J. WinPLOTR: A Windows Tool for Powder Diffraction Pattern Analysis. Mater. Sci. Forum 2001, 378–381, 118–123. [Google Scholar] [CrossRef]
- Hammersley, A.P. FIT2D: A multi-purpose data reduction, analysis and visualization program. J. Appl. Crystallogr. 2016, 49, 646–652. [Google Scholar] [CrossRef]
- Larson, A.C.; Von Dreele, R.B. General Structure Analysis System (GSAS). Los Alamos Natl. Lab. Rep. LAUR 2004, 86–748. [Google Scholar]
- Altomare, A.; Cuocci, C.; Giacovazzo, C.; Moliterni, A.; Rizzi, R.; Corriero, N.; Falcicchio, A. EXPO2013: A kit of tools for phasing crystal structures from powder data. J. Appl. Crystallogr. 2013, 46, 1231–1235. [Google Scholar] [CrossRef]
- Markvardsen, A.J.; Puphaiboon, K.; Arjeneh, M.; Shankland, K.; Guest, H.L.; Griffin, T.A.N.; Badham, D.R.; Flannery, D.W. Jpowder: A Java-based program for the display and examination of powder diffraction data. J. Appl. Crystallogr. 2010, 43, 1532–1534. [Google Scholar] [CrossRef]
- Highscore Software. Available online: https://www.malvernpanalytical.com/en/products/category/software/x-ray-diffraction-software/highscore (accessed on 19 October 2020).
- Coelho, A.A. TOPAS and TOPAS-Academic: An optimization program integrating computer algebra and crystallographic objects written in C++. J. Appl. Crystallogr. 2018, 51, 210–218. [Google Scholar] [CrossRef]
- TTS_Software, ICMAB-CSIC. Available online: https://departments.icmab.es/crystallography/software (accessed on 19 October 2020).
- Rodríguez-Carvajal, J. Recent advances in magnetic structure determination by neutron powder diffraction. Phys. B 1993, 192, 55–69. [Google Scholar] [CrossRef]
- Degen, T. XrdML, a new way to store (and exchange) X-ray powder diffraction measurement data. arXiv 2002, arXiv:physics/0210067. [Google Scholar]
- Juhás, P.; Davis, T.; Farrow, C.L.; Billinge, S.J.L. PDFgetX3: A rapid and highly automatable program for processing powder diffraction data into total scattering pair distribution functions. J. Appl. Crystallogr. 2013, 46, 560–566. [Google Scholar] [CrossRef]
- Brückner, S. Estimation of the background in powder diffraction patterns through a robust smoothing procedure. J. Appl. Crystallogr. 2000, 33, 977–979. [Google Scholar] [CrossRef]
- Boultif, A.; Louër, D. Powder pattern indexing with the dichotomy method. J. Appl. Crystallogr. 2004, 37, 724–731. [Google Scholar] [CrossRef]
- de Pedro, I.D.; García-Saiz, A.; Dupont, J.; Migowski, P.; Vallcorba, O.; Junquera, J.; Rius, J.; Rodríguez Fernández, J. On the colossal and highly anisotropic thermal expansion exhibited by imidazolium salts. Cryst. Growth Des. 2015, 15, 5207–5212. [Google Scholar] [CrossRef]
- Hall, S.R.; Allen, F.H.; Brown, I.D. The crystallographic information file (CIF): A new standard archive file for crystallography. Acta Crystallogr. Sect. A Found. Adv. 1991, 47, 655–685. [Google Scholar] [CrossRef]
- Faber, J.; Fawcett, T. The Powder Diffraction File: Present and future. Acta Crystallogr. Sect. B Struct. Sci. Cryst. Eng. Mater. 2002, 58, 325–332. [Google Scholar] [CrossRef]
- Altomare, A.; Corriero, N.; Cuocci, C.; Falcicchio, A.; Moliterni, A.; Rizzi, R. QUALX2.0: A qualitative phase analysis software using the freely available database POW_COD. J. Appl. Crystallogr. 2015, 48, 598–603. [Google Scholar] [CrossRef]
- Schmalen, P.; Plapper, P.; Peral, I.; Titov, I.; Vallcorba, O.; Rius, J. Composition and phases in laser welded Al-Cu joints by synchrotron X-ray microdiffraction. Procedia CIRP 2018, 74, 27–32. [Google Scholar] [CrossRef]
- Fauth, F.; Peral, I.; Popescu, C.; Knapp, M. The new Material Science Powder Diffraction beamline at ALBA Synchrotron. Powder Diffr. 2013, 28, S360–S370. [Google Scholar] [CrossRef]
- Emami, M.; Rozatian, A.S.H.; Vallcorba, O.; Anghelone, M.; Hadian Dehkordi, M.; Pritzel, C.; Trettin, R. Synchrotron micro-XRD study, the way toward a deeper characterizing the early prehistoric Iranian glass cylinders from Late Bronze Age (1280 BC). Eur. Phys. J. Plus 2020, 135, 1–14. [Google Scholar] [CrossRef]
- Beltrán, M.; Schibille, N.; Brock, F.; Gratuze, B.; Vallcorba, O.; Pradell, T. Modernist enamels: Composition, microstructure and stability. J. Eur. Ceram. Soc. 2020, 40, 1753–1766. [Google Scholar] [CrossRef]
- Vallcorba, O.; Canillas, M.; Audije-Gil, J.; Barroso-Barcenilla, F.; González-Martín, A.; Molera, J.; Rodríguez, M.A.; Cambra-Moo, O. Synchrotron X-ray microdiffraction to study life history events in Cretaceous crocodylomorphs through dental structures. Cretac. Res. 2020. under review. [Google Scholar]
- Valido, I.H.; Fuentes-Cebrian, V.; Boada, R.; Vallcorba, O.; Resina-Gallego, M.; Valiente, M.; López-Mesas, M. Discriminating the formation origin of calcium oxalate monohydrate in kidney stones via synchrotron microdiffraction. Cryst. Growth Des. 2020. under review. [Google Scholar] [CrossRef]
- Vallcorba, O.; Casas, L.; Colombo, F.; Frontera, C.; Rius, J. First terrestrial occurrence of the complex phosphate chladniite: Crystal-structure refinement by synchrotron through-the-substrate microdiffraction. Eur. J. Mineral. 2017, 29, 287–293. [Google Scholar] [CrossRef]
- Crespi, A.; Vallcorba, O.; Šics, I.; Rius, J. First identification and compositional study of brown aerinite directly on polished thin-sections by synchrotron through-the-substrate microdiffraction. Eur. J. Mineral. 2019, 31, 999–1005. [Google Scholar] [CrossRef]
- Portolés-Gil, N.; López-Periago, A.M.; Borrás, A.; Fraile, J.; Solano, E.; Vallcorba, O.; Planas, J.G.; Ayllón, J.A.; Domingo, C. Tuning the Structure and Flexibility of Coordination Polymers via Solvent Control of Tritopic Triazine Conformation during Crystallization. Cryst. Growth Des. 2020, 20, 3304–3315. [Google Scholar] [CrossRef]
- Schneider, C.A.; Rasband, W.S.; Eliceiri, K.W. NIH Image to ImageJ: 25 years of image analysis. Nat. Methods 2012, 9, 671–675. [Google Scholar] [CrossRef]
- ALBA Synchrotron (MSPD Beamline, Preparing Your Experiment and Software Section). Available online: https://www.cells.es/en/beamlines/bl04-mspd/preparing-your-experiment (accessed on 19 October 2020).

Publisher’s Note: MDPI stays neutral with regard to jurisdictional claims in published maps and institutional affiliations. |
© 2020 by the authors. Licensee MDPI, Basel, Switzerland. This article is an open access article distributed under the terms and conditions of the Creative Commons Attribution (CC BY) license (https://creativecommons.org/licenses/by/4.0/).
Share and Cite
Vallcorba, O.; Rius, J. XRD Data Visualization, Processing and Analysis with d1Dplot and d2Dplot Software Packages. Proceedings 2020, 62, 9. https://doi.org/10.3390/proceedings2020062009
Vallcorba O, Rius J. XRD Data Visualization, Processing and Analysis with d1Dplot and d2Dplot Software Packages. Proceedings. 2020; 62(1):9. https://doi.org/10.3390/proceedings2020062009
Chicago/Turabian StyleVallcorba, Oriol, and Jordi Rius. 2020. "XRD Data Visualization, Processing and Analysis with d1Dplot and d2Dplot Software Packages" Proceedings 62, no. 1: 9. https://doi.org/10.3390/proceedings2020062009
APA StyleVallcorba, O., & Rius, J. (2020). XRD Data Visualization, Processing and Analysis with d1Dplot and d2Dplot Software Packages. Proceedings, 62(1), 9. https://doi.org/10.3390/proceedings2020062009