Proceeding Paper

Chronic Dietary Zinc Deficiency Alters Gut Microbiota Composition and Function †

1
Azrieli Faculty of Medicine, Bar-Ilan University, Safed 1311502, Israel
2
Department of Food Science, Cornell University, Stocking Hall, Ithaca, NY 14853-7201, USA
*
Author to whom correspondence should be addressed.
Presented at the 1st International Electronic Conference on Nutrients—Nutritional and Microbiota Effects on Chronic Disease, 2–15 November 2020; Available online: https://iecn2020.sciforum.net/.
Proceedings 2020, 61(1), 16; https://doi.org/10.3390/IECN2020-06993
Published: 30 October 2020

Abstract

:
Zinc (Zn) deficiency is a prevalent micronutrient insufficiency. Although the gut is a vital organ for Zn utilization, and Zn deficiency is associated with impaired intestinal permeability and a global decrease in gastrointestinal health, alterations in the gut microbial ecology of the host under conditions of Zn deficiency have yet to be studied. By conducting a series of long-term in vivo (Gallus gallus) feeding trials, we aimed to characterize distinct cecal microbiota shifts induced by chronic dietary Zn depletion in the context of complete diets based on Zn-biofortified food crops that are relevant to target populations, and in geographical regions where dietary Zn deficiency is a major health concern. We demonstrate that Zn deficiency induces significant taxonomic alterations and decreases overall species richness and diversity, establishing a microbial profile resembling that of various other pathological states. Through metagenomic analysis, we show that the predicted Kyoto Encyclopedia of Genes and Genomes (KEGG) pathways responsible for macro- and micronutrient uptake are significantly depleted under Zn deficiency; along with concomitant decreases in beneficial short-chain fatty acids, such depletions may further preclude optimal host Zn availability. We also identify several candidate microbes that may play a significant role in modulating the bioavailability and utilization of dietary Zn during prolonged deficiency. Our results are the first to characterize a unique and dysbiotic cecal microbiota during Zn deficiency, and they provide evidence for such microbial perturbations as potential effectors of the Zn-deficient phenotype.

1. Introduction

Zinc (Zn), an essential nutrient for nearly all organisms, is most notably involved as a metal cofactor in hundreds of proteins within the human body [1,2]. In healthy adults, Zn is present in the amount of 2–3 g and is second only to iron (Fe) as the most abundant micronutrient [3,4]. Even mild deficiencies of this mineral can profoundly impact growth and development and can impede immune differentiation and maturation [5,6]. The spectrum of chronic Zn deficiencies has been recently estimated to affect around 17% of the population [7], with insufficient dietary Zn intake and/or poor bioavailability from food being central to this condition [8,9]. Despite the high prevalence of Zn deficiency, accurate clinical biomarkers of Zn status are lacking [10,11]. To address this, a major initiative has been set forth by the World Health Organization, the International Zinc Nutrition Consultative Group, and others to promote the development of reliable Zn biomarkers. Although serum Zn is currently the most widely used biomarker of Zn status, inherent problems with its measurement and interpretation can significantly impact sensitivity and specificity for dietary Zn [11]. To that end, our group recently published evidence in this journal for a new biological indicator of Zn status, the linoleic acid to dihomo-γ-linolenic acid (LA:DGLA) ratio, which exploits the Zn-dependent rate-limiting step of erythrocyte fatty acid desaturation [12]. However, since no single reliable biomarker of Zn status currently exists, establishing a panel of biochemical indices, as is the case with functional Fe deficiency [13,14], may be necessary. Understanding the influence of the gastrointestinal microbiota on physiology may represent a novel area to also understand the effects of Zn deficiency on the host. Little is known about how dietary Zn contributes to the microbiota, and even less is known regarding the effects of chronic Zn deficiency on the gut microbial composition. Early work by Smith et al. [15] elucidated a role of the host microbiota in Zn homeostasis, whereby conventionally raised (CR) mice required nearly twice as much dietary Zn than their germ-free (GF) counterparts. In the same study, an in vitro assay using radiolabeled 65Zn identified a Streptococcus sp. and Staphylococcus epidermidis that were able to concentrate Zn from the medium. In this study, GF animals also had a reduced cecal Zn concentration relative to their CR counterparts. Recently, it was shown [16] that Zn competition exists in C. jejuni and other bacterial species in the host microbiota of CR versus GF broiler chickens (Gallus gallus). Under conditions of Zn deficiency, this might lead to the preferential growth of bacteria able to survive at low Zn levels. Further, many recent studies have shown that prophylactic doses of Zn (as Zn oxide, ZnO) in various animal models increased the presence of Gram-negative facultative anaerobic bacterial groups, the colonic concentration of short-chain fatty acids (SCFAs), and overall species richness and diversity [17,18,19]. Likewise, others have found enriched gut microbiota in members of the phylum Firmicutes, specifically Lactobacillus, following ZnO administration [20]. Therapeutic levels of dietary Zn have been shown to alter the overall gut microbial composition of piglets, leading to favorable changes in metabolic activity [21,22]. The protective effects of Zn supplementation include modulating intestinal permeability (via proliferation of the absorptive mucosa) [23,24], reducing villous apoptosis [25], influencing the Th1 immune response [26], and reducing pathogenic infections and subsequent diarrheal episodes [23]. Although the gut environment is central to Zn homeostasis and is affected by suboptimal Zn status, we know little about the effects of chronic dietary Zn deficiency on the composition and function of the gut microbiome. Therefore, the present study examined how a four-week period of Zn deficiency affected the composition and genetic potential of the cecal microbiota in broiler chickens fed with a moderately Zn deficient diet. A panel of Zn status biomarkers was measured weekly, and the gene expression of a variety of Zn-dependent proteins was quantified from relevant tissues in the study’s conclusion. Cecal contents were collected for SCFA quantification and for analyzing compositional and functional alterations in the microbiota. Here, we review the results of our three studies (long-term feeding trials) aimed at evaluating the effects of physiological zinc status and chronic dietary Zn deficiency on the intestinal microbiota in vivo (Gallus gallus).

2. Materials and Methods

2.1. Animals, Diets, and Study Design

For all in vivo (Gallus gallus) studies that are reviewed here [27,28,29], Cornish cross-fertile broiler eggs were obtained from a commercial hatchery (Moyer’s Chicks, Quakertown, PA, USA). The eggs were incubated in optimal conditions at the Cornell University Animal Science poultry farm incubator. The procedure has been described in detail elsewhere [15,16,17]. Upon hatching, (hatchability rate was ~95%), chicks were assigned to two treatment groups based on gender and body weight to make an equal dissemination between groups (n = 15): 1. “High Zn” (Zn-enhanced diet); 2. “Low Zn” (control diet). The specific dietary composition has been previously described [27,28,29]. The NRC recommendations and requirements for poultry were consulted to formulate the diets that were used in these studies with the aim of meeting the nutrient supplies for the broiler, excluding Zn.

2.2. 16S rRNA PCR (Polymerase Chain Reaction) Amplification and Sequencing

Microbial genomic DNA was extracted from cecal samples using the PowerSoil DNA isolation kit, as described by the manufacturer (MoBio Laboratories Ltd., Carlsbad, CA, USA). Bacterial 16S rRNA gene sequences were PCR-amplified from each sample using the 515F-806R primers for the V4 hypervariable region of the 16S rRNA gene, including 12-base barcodes, as previously published [14]. The PCR procedure reactions consisted of 12.5 μL of KAPA HiFi HotStart ReadyMix (kit KK2601, Kapa Biosystems, Woburn, MA, USA), 10 μM of each primer, and 10–100 ng of DNA template. The reaction conditions consisted of an initial denaturing step for 3 min at 95 °C followed by 31 cycles of 20 s at 98 °C, 15 s at 60 °C, and 20 s at 72 °C. Triplicate PCR reactions were performed for each sample, which were combined and then purified with Ampure magnetic purification beads (Agencourt, Danvers, MA, USA). Purified PCR products were quantified using a Quant-iT PicoGreen dsDNA assay (Invitrogen, Carlsbad, CA, USA). Equimolar ratios of total samples were pooled and sequenced at the Faculty of Medicine of the Bar Ilan University (Safed, Israel) using a MiSeq Sequencer (Illumina, Madison, WI, USA).

2.3. 16S rRNA Gene Sequence Analysis

For quality filtering of raw data, sequences with Phred <20 or shorter than 75% of the expected length were discarded, as well as sequences containing primer mismatches, incorrect barcodes, ambiguous bases, or homopolymer runs in excess of six bases. The sequences that passed the quality filters were analyzed using the QIIME software package. Sequences were classified taxonomically using the Greengenes (GG) reference database at a confidence threshold of 80%. The GG taxonomies were used to generate summaries of the taxonomic distributions of operational taxonomic units (OTUs) across different levels (phylum, order, family, and genus). To standardize sequence counts across samples with uneven sampling, we randomly selected 22,450 sequences per sample (rarefaction) and used these as a basis to compare abundances of OTUs across samples. For phylogenetic-tree-based analyses, each OTU was represented by a single sequence that was aligned using PyNAST. A phylogenetic tree was built with Fast-Tree and used for estimates of α-diversity (within-sample diversity using Faith’s phylogenetic diversity) and β-diversity (between-sample diversity using unweighted and weighted UniFrac). For polygenetic diversity (PD) measurements, the means and standard errors for given categories were calculated from 100 iterations using a rarefaction of 16,837 sequences per sample. Metagenome functional predictive analysis was carried out using the PICRUSt software. Briefly, OTU abundance was normalized by 16S rRNA gene copy number, identified, and compared to a phylogenetic reference tree using the Greengenes database, and was assigned functional traits and abundance based on known genomes and prediction using the Kyoto Encyclopedia of Genes and Genomes (KEGG). Data representing significant fold-change differences in functional pathways between experimental groups were plotted [14].

2.4. Statistical Analyses

All values are reported as the mean ± SEM. Statistical analysis was performed using SAS version 9.3 (SAS Institute, Cary, NC, USA). Analysis of variance (ANOVA) was carried out to identify significant differences between the means of the experimental groups of birds, unless otherwise specified. Nonparametric factorial Kruskal–Wallis sum-rank tests were used to compare the relative abundance of distinct taxonomic units. Unweighted UniFrac, a phylogenetic measure of the degree of similarity between microbial communities, was used to assess phylogenetic diversity. Spearman’s rank correlation was employed to assess significant associations between bacterial groups and biomarkers of Zn status. Multivariate association with linear models (MaAsLin) was used to identify potential correlations between OTU abundance and host phenotype. Significant p-values (p < 0.05) associated with microbial clades and functions identified by the linear discriminant analysis effect size (LEfSe) were corrected for multiple comparisons using the Benjamini and Hochberg false discovery rate (FDR) correction.

3. Results and Discussion

3.1. Chronic Zn Defiency and Gut Microbiome

In the first study, we investigated how chronic zinc deficiency alters chick gut microbiota composition and function [27]. In this study, we aimed at the assessment of zinc physiological status and dietary deficiency with respect to the intestinal microbiome. Although the gut environment is central to Zn homeostasis and is affected by suboptimal Zn status, we know little about the effects of chronic dietary Zn deficiency on the composition and function of the gut microbiome. Therefore, this study examined how a four-week period of Zn deficiency affected the composition and genetic potential of the cecal microbiota in broiler chickens fed a moderately Zn-deficient diet. Cecal contents were collected for analyzing compositional and functional alterations in the microbiota.

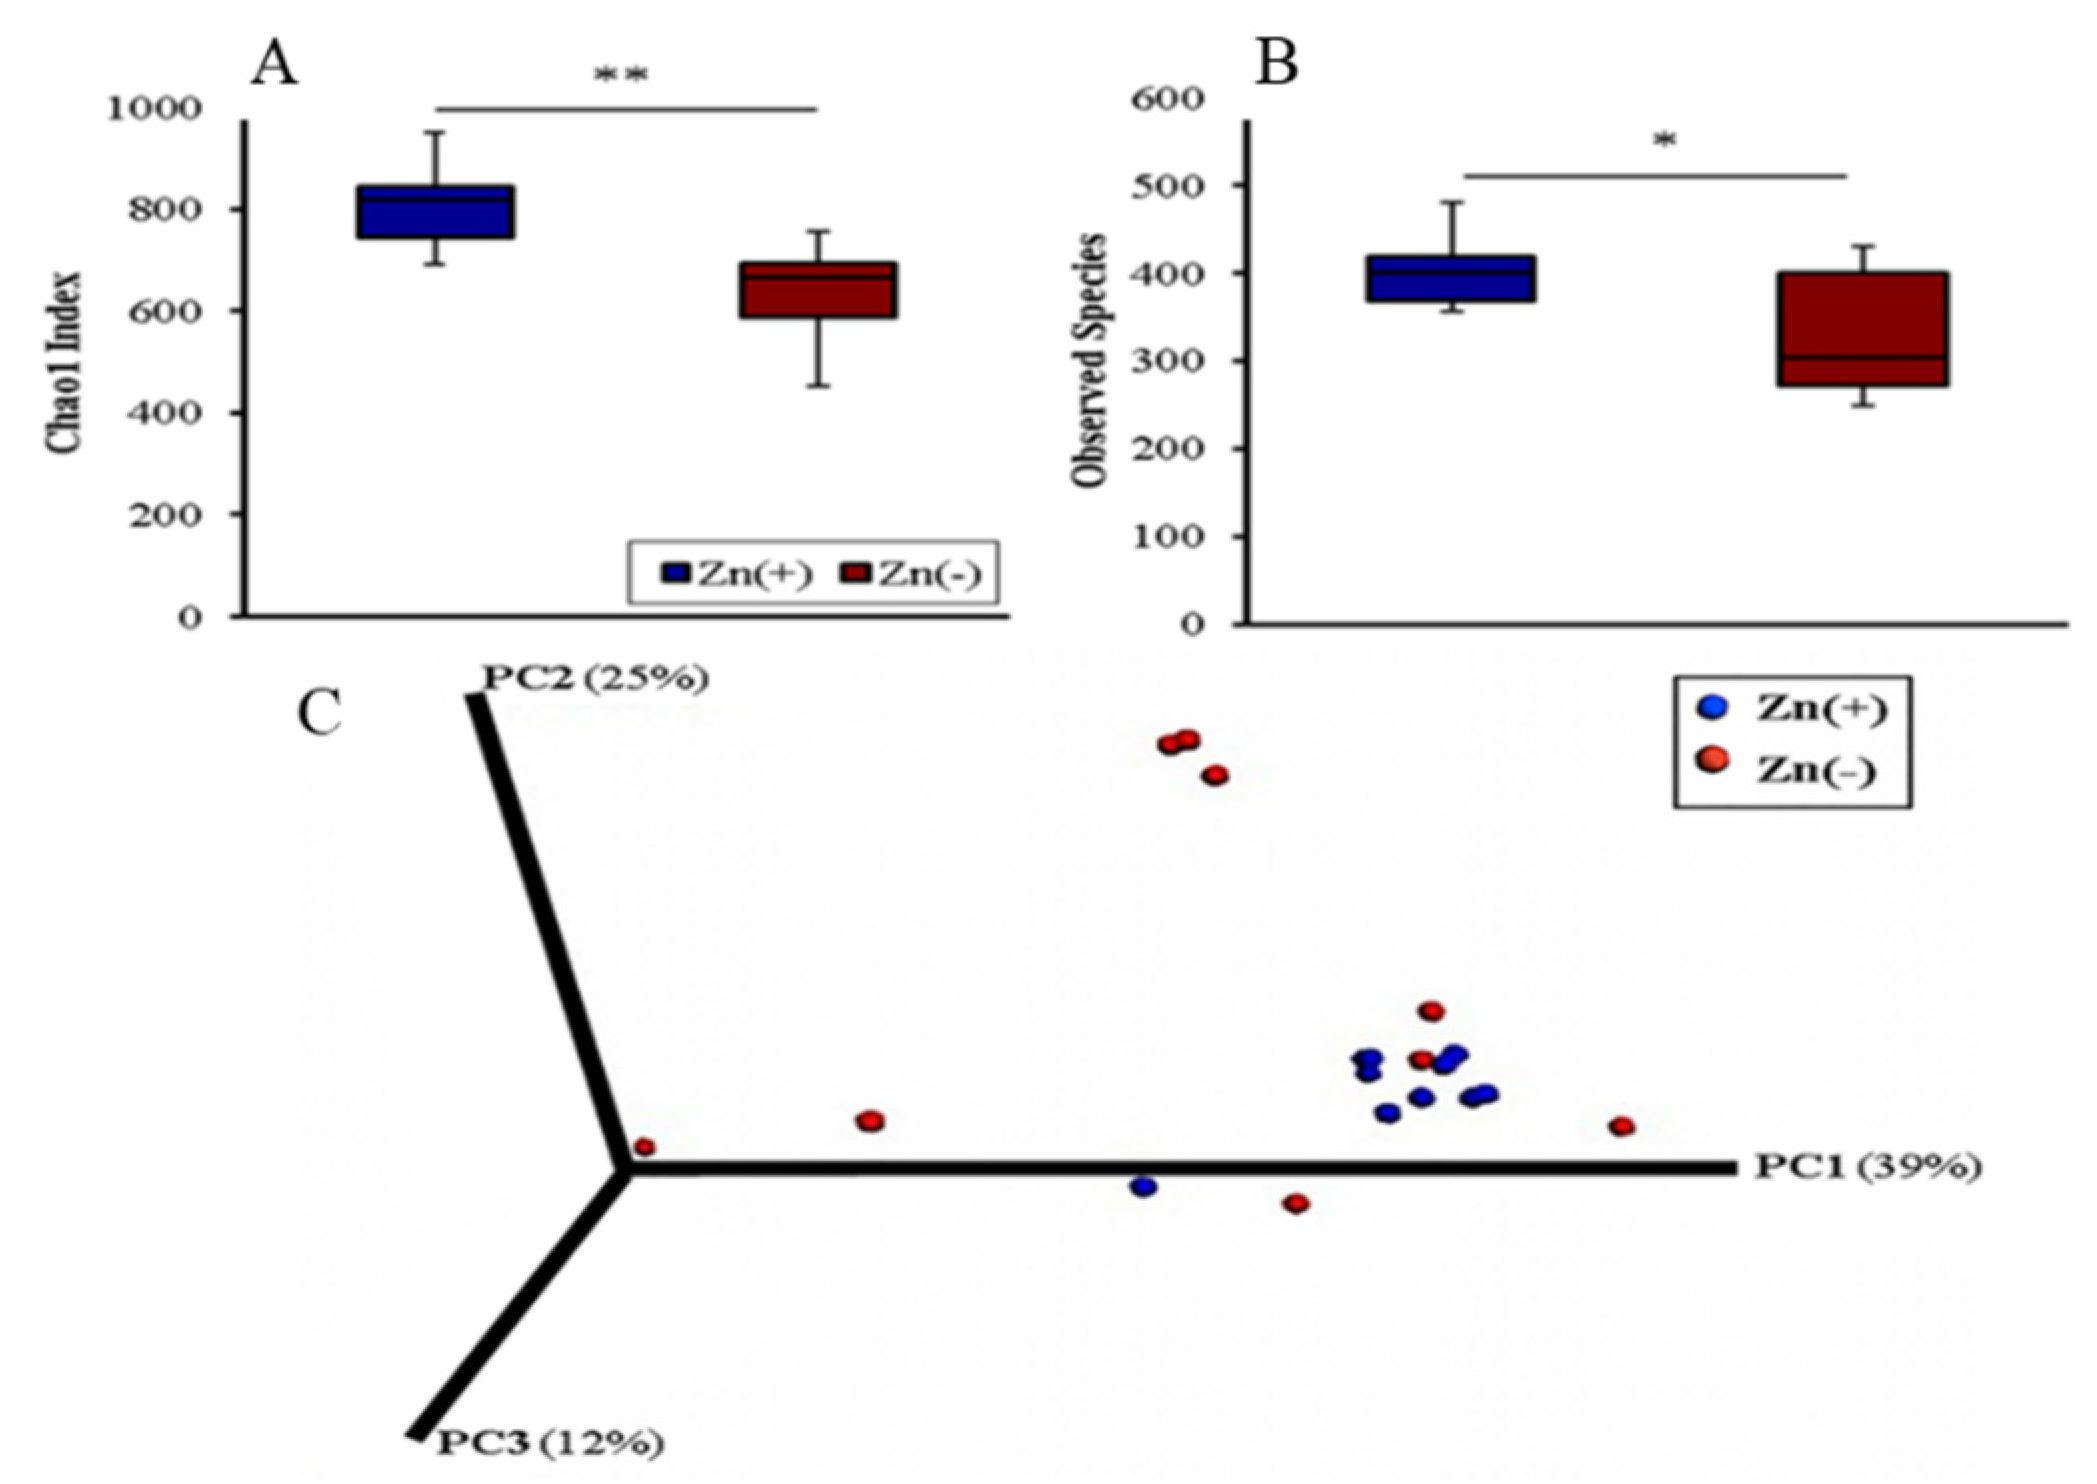
3.1.1. Gut Microbial Diversity of Zn-Deficient Animals Resembles Physiologically Diseased Microbiomes

Cecal samples from the Zn(+) and Zn(−) treatment groups were harvested and used for bacterial DNA extraction and sequencing of the V4 hypervariable region in the 16S rRNA gene. The cecum represents the primary site of bacterial fermentation in Gallus gallus, with its highly diverse and abundant resident microbiota [30]. As in humans, Firmicutes are by far the dominant bacterial phylum in the Gallus gallus cecum, accounting for 70–90% of all sequences [31,32]. The diversity of the cecal microbiota in the Zn(+) and Zn(−) groups was assessed through measures of α-diversity, β-diversity, and overall species richness. The Chao1 index and observed species richness were used to assess α-diversity. For both measures, the Zn-deficient group had significantly lower phylogenetic diversity, indicating a less diverse cecal microbial composition (Figure 1A,B). We utilized weighted UniFrac distances as a measure of β-diversity to assess the effect of chronic Zn deficiency on between-individual variation in bacterial community composition. Principal coordinate analysis demonstrated a significant expansion of β-diversity in the Zn-deficient group (Figure 1C). Interestingly, the same features of lower α-diversity and richness together with higher β-diversity compared to the control, as seen with Zn deficiency, were also found in (gastro intestinal) GI microbiota observed during a deficiency of the trace mineral selenium [33], as well as in various pathological states, such as Crohn’s disease [34], inflammatory bowel disease [35], opportunistic infections [36], diabetes [37], obesity [38], and others [39].

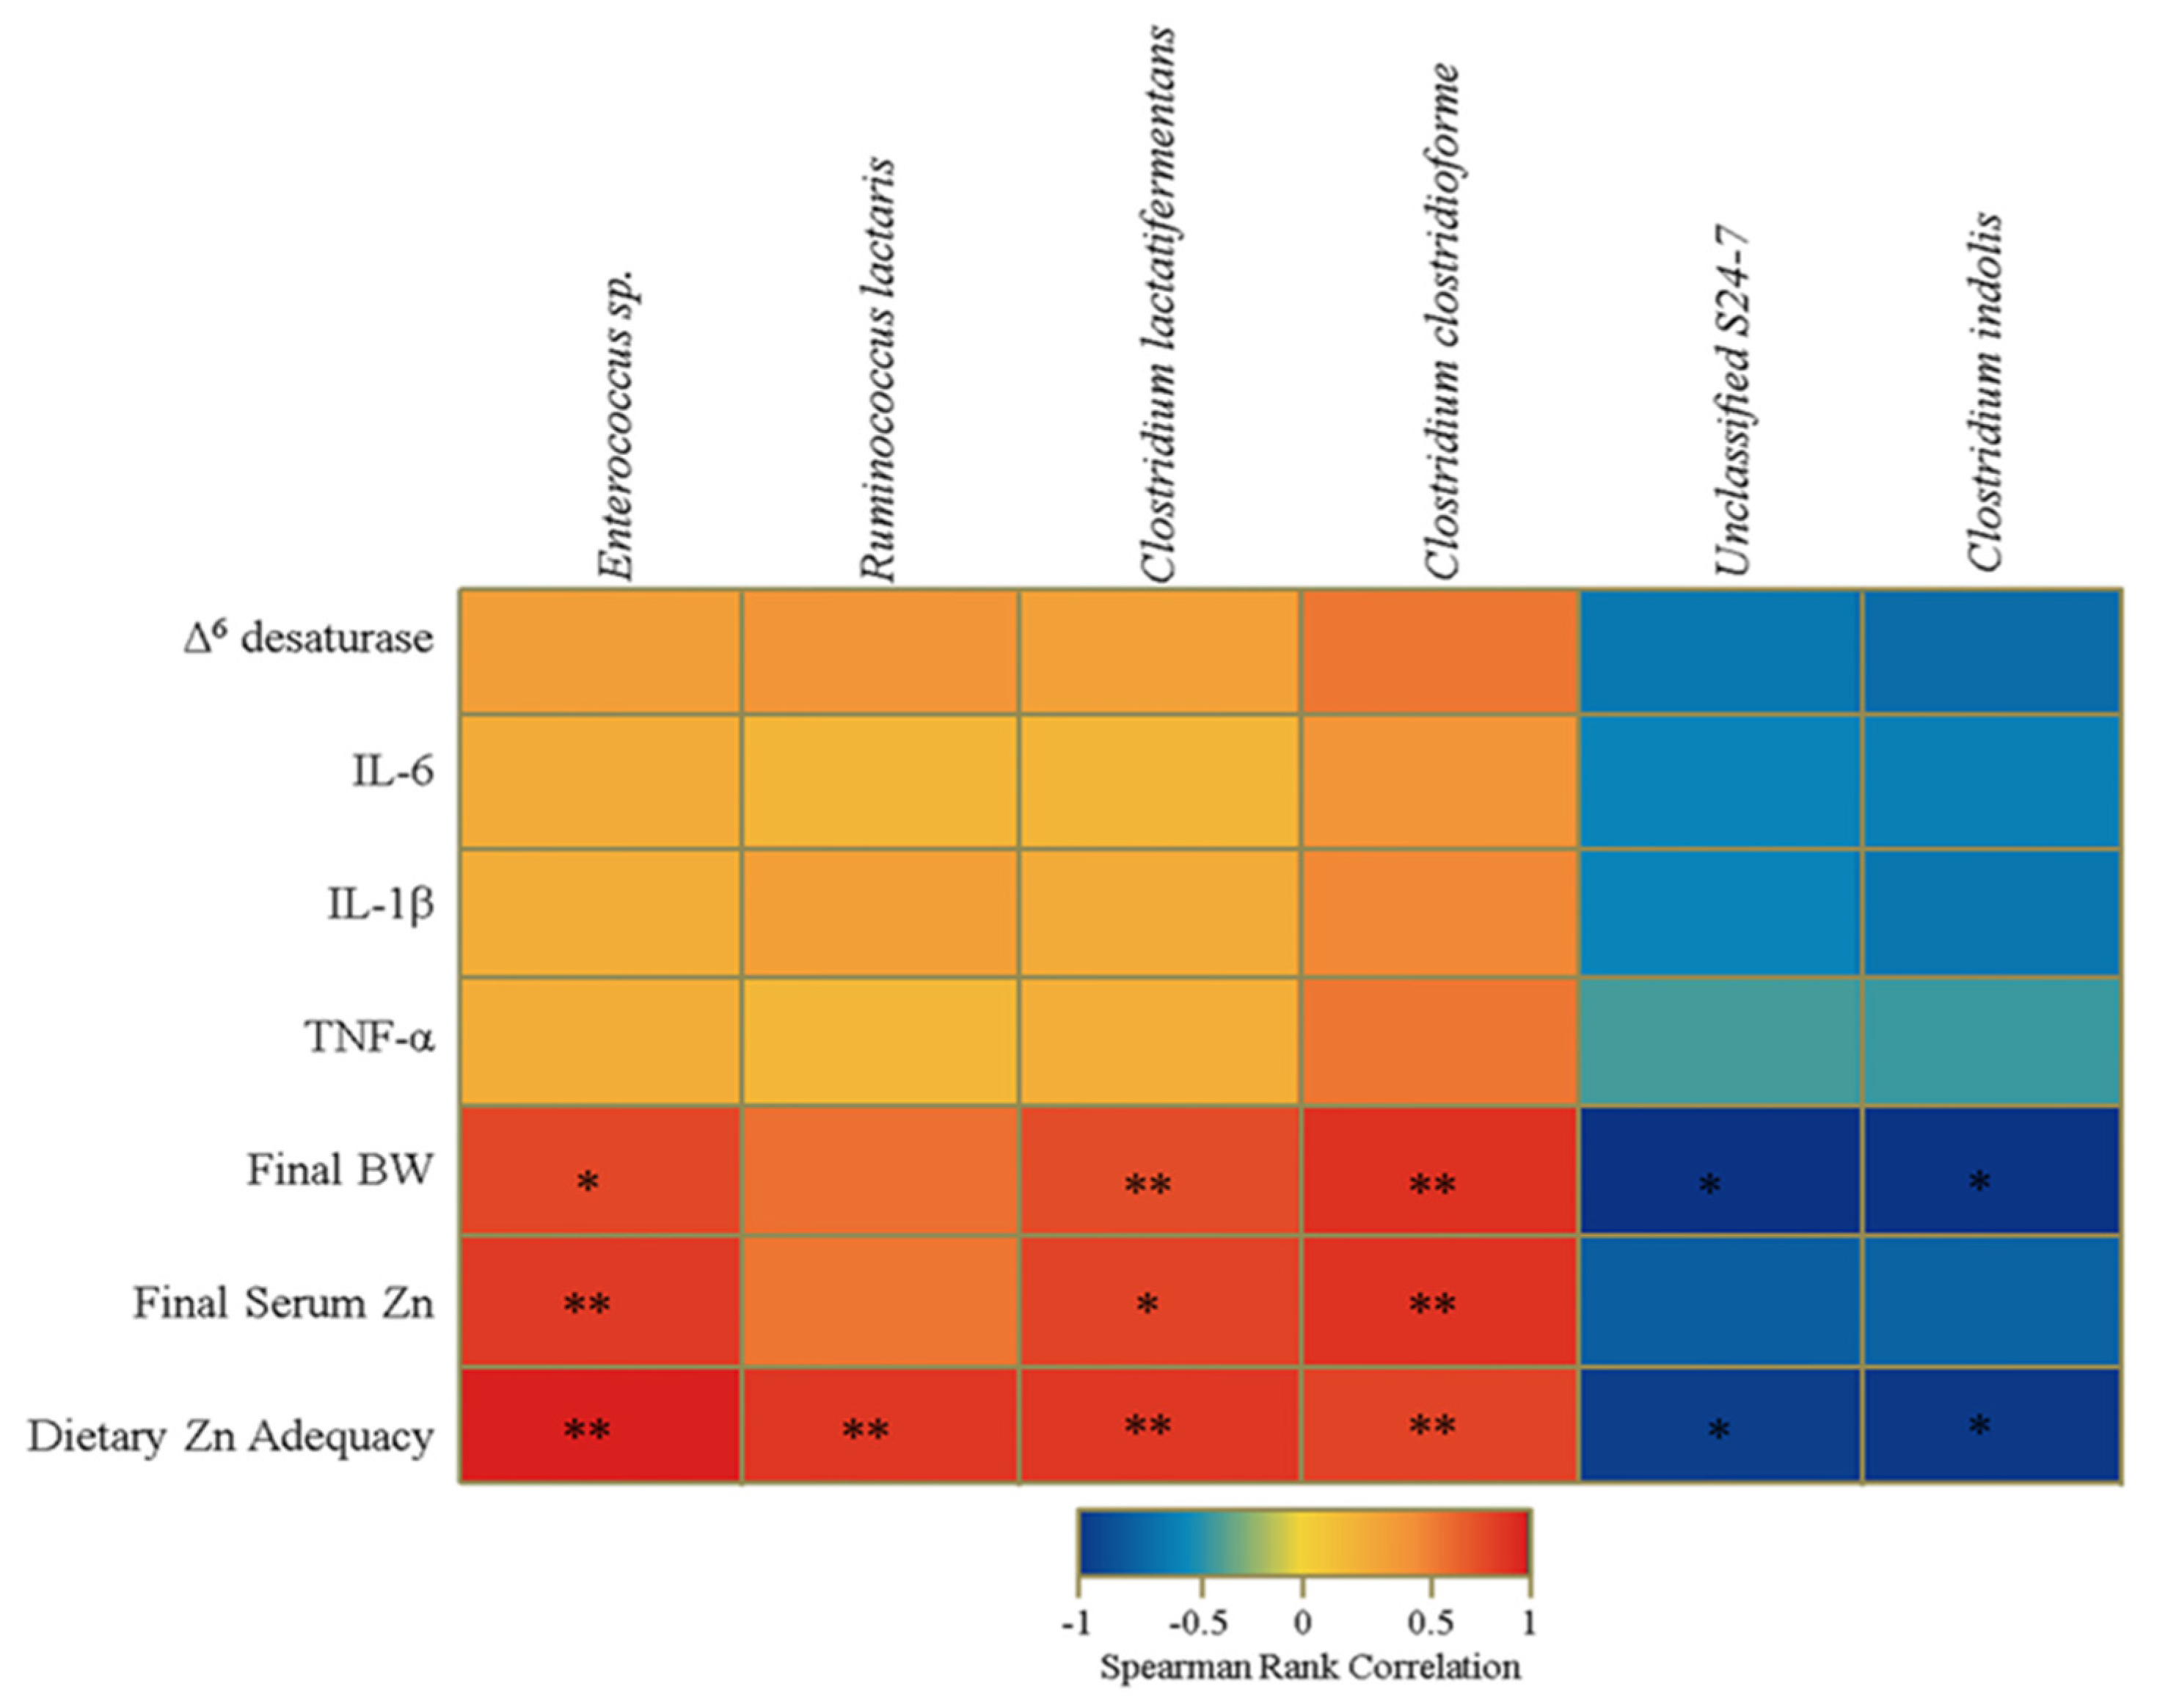
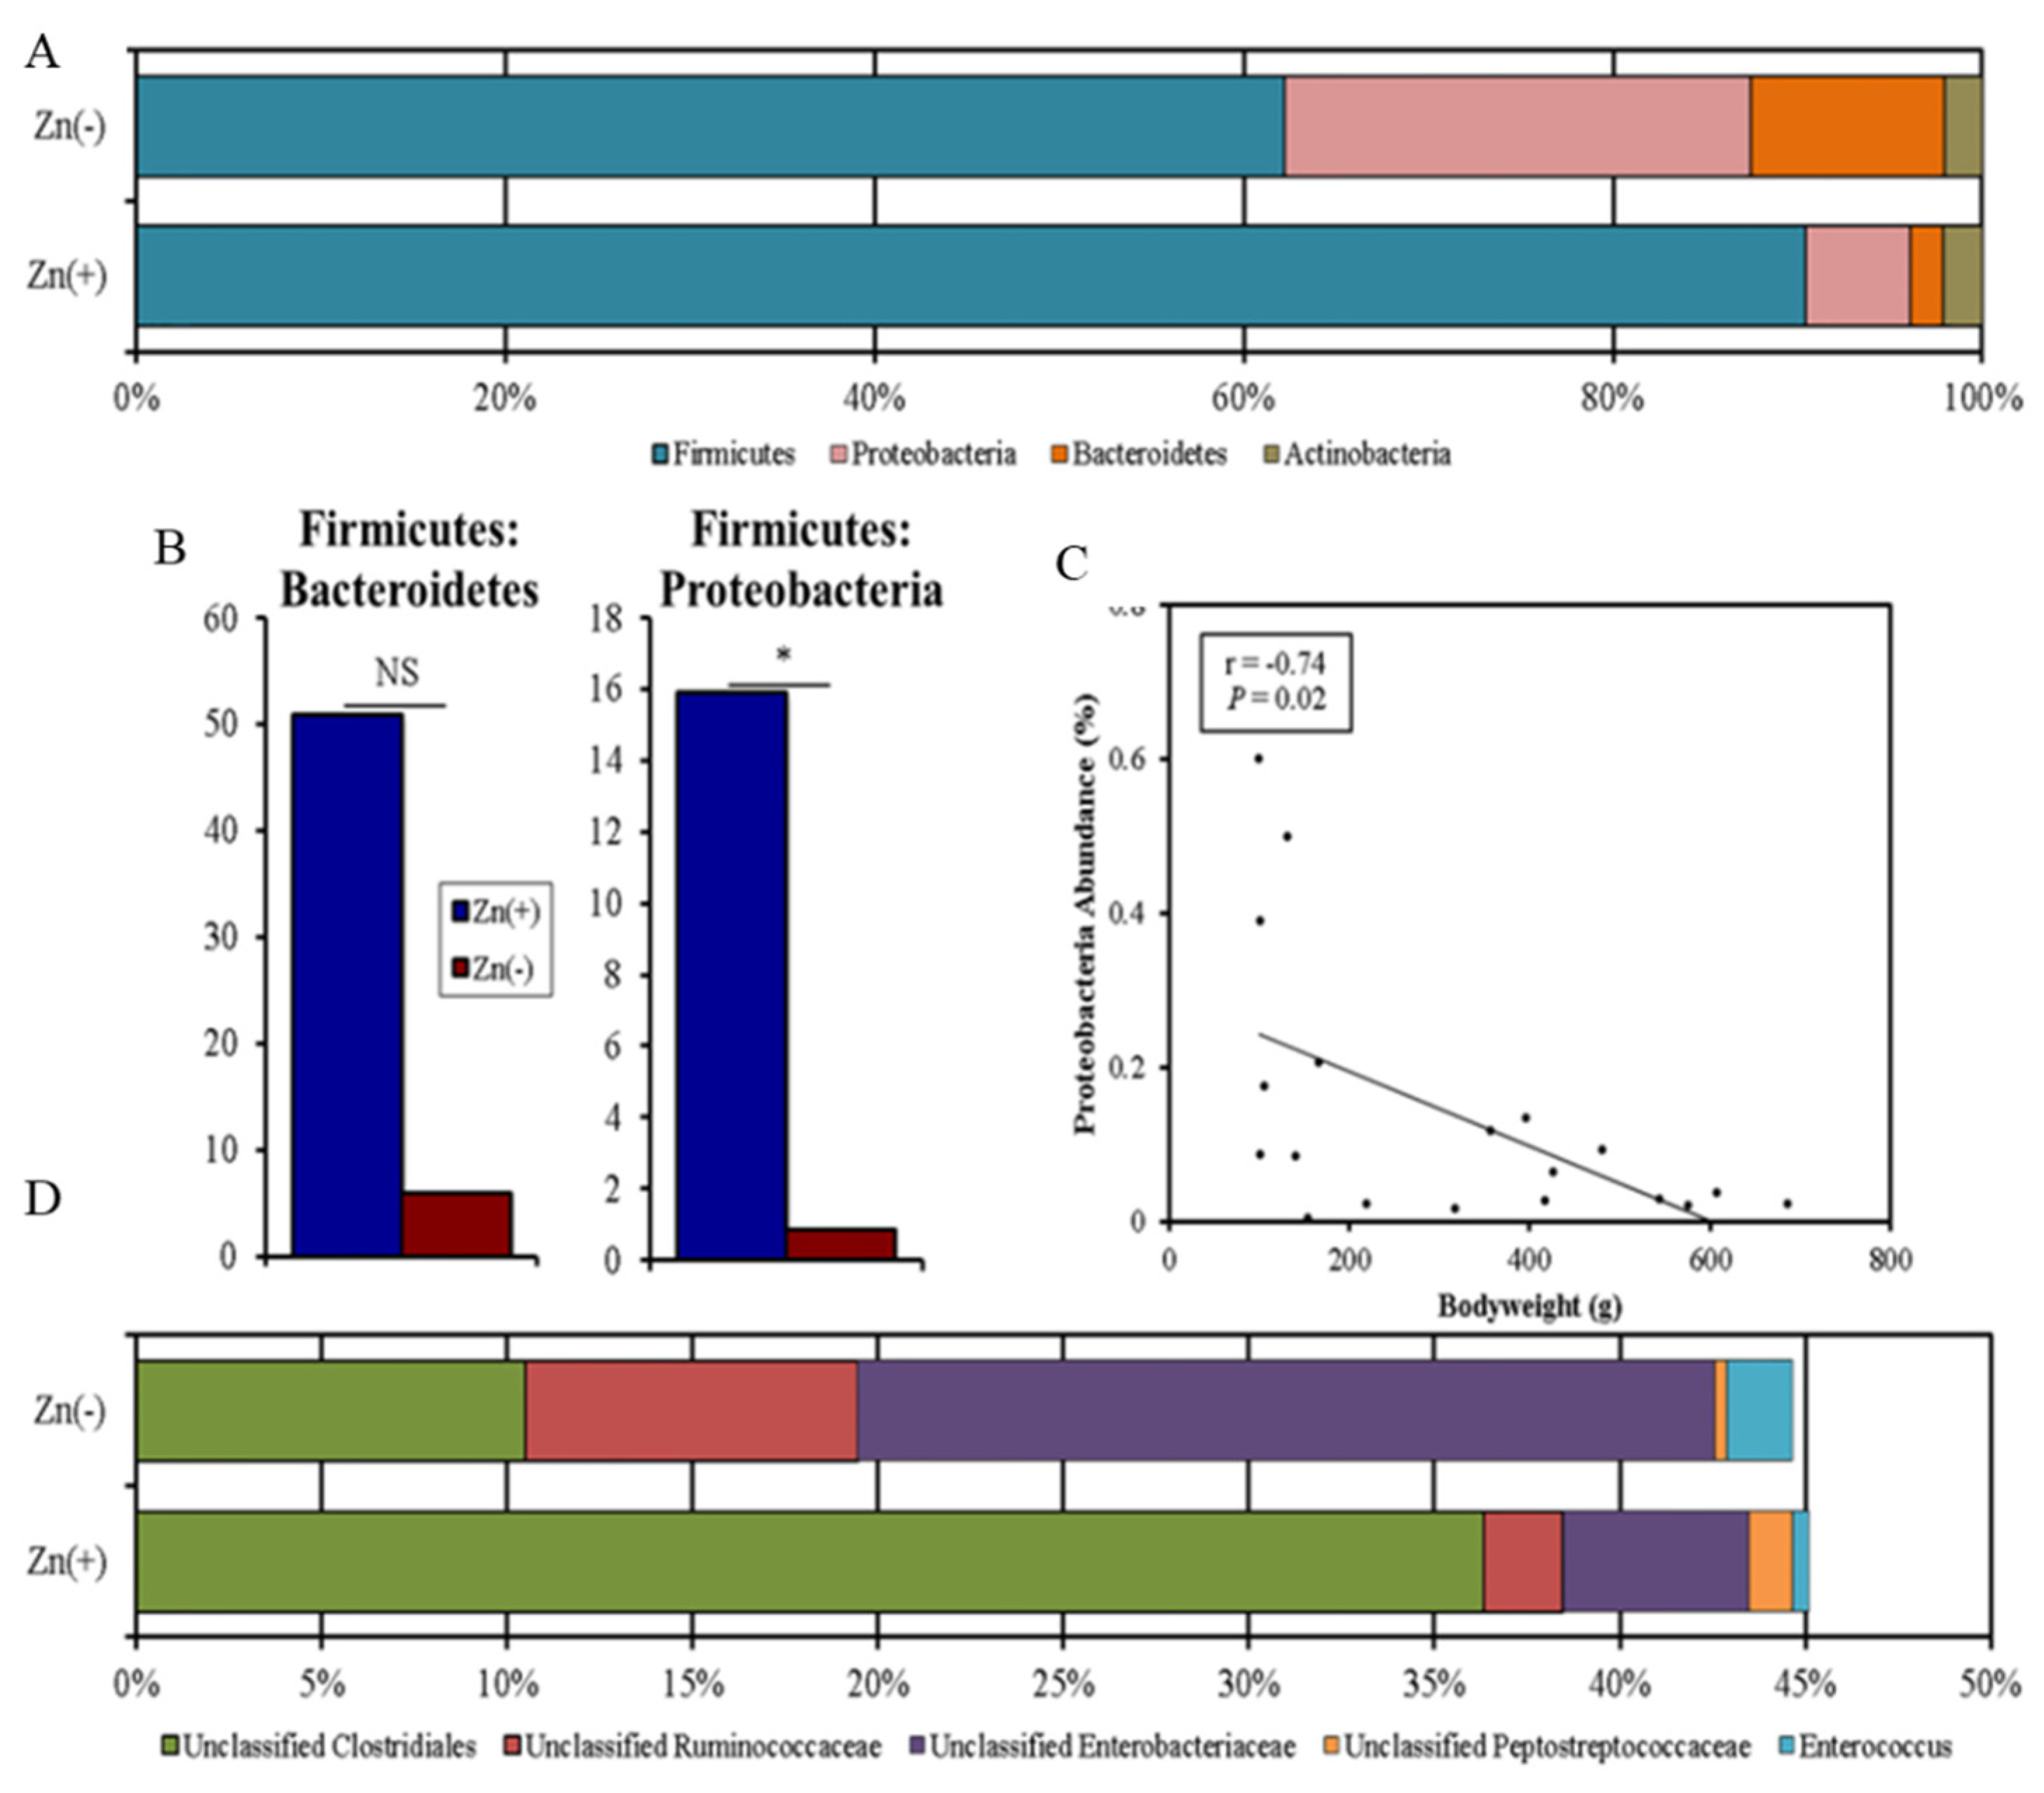
3.1.2. Chronic Zn Deficiency Reshapes the Gut Microbiome

We performed a taxon-based analysis of the cecal microbiota (Figure 2). The 16S rRNA gene sequencing revealed that 98–99% of all bacterial sequences in both the Zn(+) and Zn(−) groups belonged to four major divisions: Firmicutes, Proteobacteria, Bacteroidetes, and Actinobacteria. Bacterial community composition was altered in the Zn-deficient group, where significantly greater abundance of Proteobacteria and significantly lower abundance of Firmicutes (Figure 2A) were observed. In the Zn(−) group, the abundance of Bacteroidetes was increased, whereas that of Actinobacteria was diminished, albeit not significantly. As such, the ratio of Firmicutes to Proteobacteria was significantly lower in the Zn-deficient group (Figure 2B). Further, the abundance of Proteobacteria was inversely correlated with bodyweight (Figure 2C). Because of the central importance of Zn in growth and development, bodyweight is often the first anthropometric measurement to respond to Zn depletion and to quantify the risk of complications related to Zn deficiency [40]. It has been a consistently reliable indicator of low Zn intake and Zn status in multiple cohorts and experimental models, and has been used by numerous others to quantify suboptimal dietary Zn deficiency [41,42]. Likewise in this study, the final bodyweight was strongly correlated with the final serum Zn (α = 0.84, p = 0.0012). At the family level, in the Zn-deficient group, the abundance of Peptostreptococcaceae and unclassified Clostridiales was significantly lower, whereas that of Enterococcaceae and Enterobacteriaceae was significantly enriched. At the genus level, we observed that, compared with their Zn-replete counterparts, Zn-deficient animals had significantly higher relative abundance of Enterococcus, unclassified Enterobacteriaceae, and unclassified Ruminococcaceae, and significantly lower relative abundance of unclassified Clostridiales and unclassified Peptostreptococcaceae (Figure 2D).
We next investigated whether taxonomic shifts at the genus level were associated with host phenotype, as defined by bodyweight and serum Zn (as measured on day 28), two commonly utilized biomarkers of Zn deficiency. Among the Zn-replete animals, a significant inverse correlation was obtained between average serum Zn levels and Eggerthella abundance. There was also a significant positive correlation between body weight and Rikenellaceae abundance in this group. In the Zn-deficient group, a significant positive correlation was obtained between bodyweight and the abundance of Peptostreptococcaceae. The ratios of certain bacterial groups may be predictive of shifts in the genetic capacity of the microbiome in certain physiological processes (e.g., the Firmicutes to Bacteroidetes ratio) and caloric extraction from the diet (Figure 3) [43]. Studies have yet to characterize or relate taxonomic changes induced by dietary Zn deficiency to markers of the phenotype, yet such ratio analyses may further define a cecal microbiota signature of the deficiency. Our analysis revealed that several ratios of the significantly altered genera in the Zn(−) group were also significantly different during Zn deficiency. The ratios of the relative abundance of unclassified Clostridiales to Enterococcus (UC:E), unclassified Clostridiales to Ruminococcaceae (UC:R), unclassified Clostridiales to unclassified Enterobacteriaceae (UC:UE), and Peptostreptococcaceae to Enteroccocus (P:E) were significantly different between the Zn(+) and Zn(−) treatment groups (Figure 4B). Additionally, there was a significant treatment-specific correlation between one of these ratios, Peptostreptococcaceae to Enterococcus, and the bodyweight in the Zn-deficient group. At the species level, we identified a strong positive correlation between Ruminococcus lactaris, Enterococcus sp., Clostridium lactatifermentans, and Clostridium clostridioforme and Zn adequacy, as well as between the latter three operational taxonomic units (OTUs) and the final bodyweight and serum Zn measurements (Figure 5). The levels of two additional bacterial species, Clostridium indolis and an unclassified member of the Bacteroidales (Unclassified S24–7), were inversely correlated with final bodyweight and dietary Zn adequacy. Although not significant, this interesting trend in correlation is presented in Figure 3.

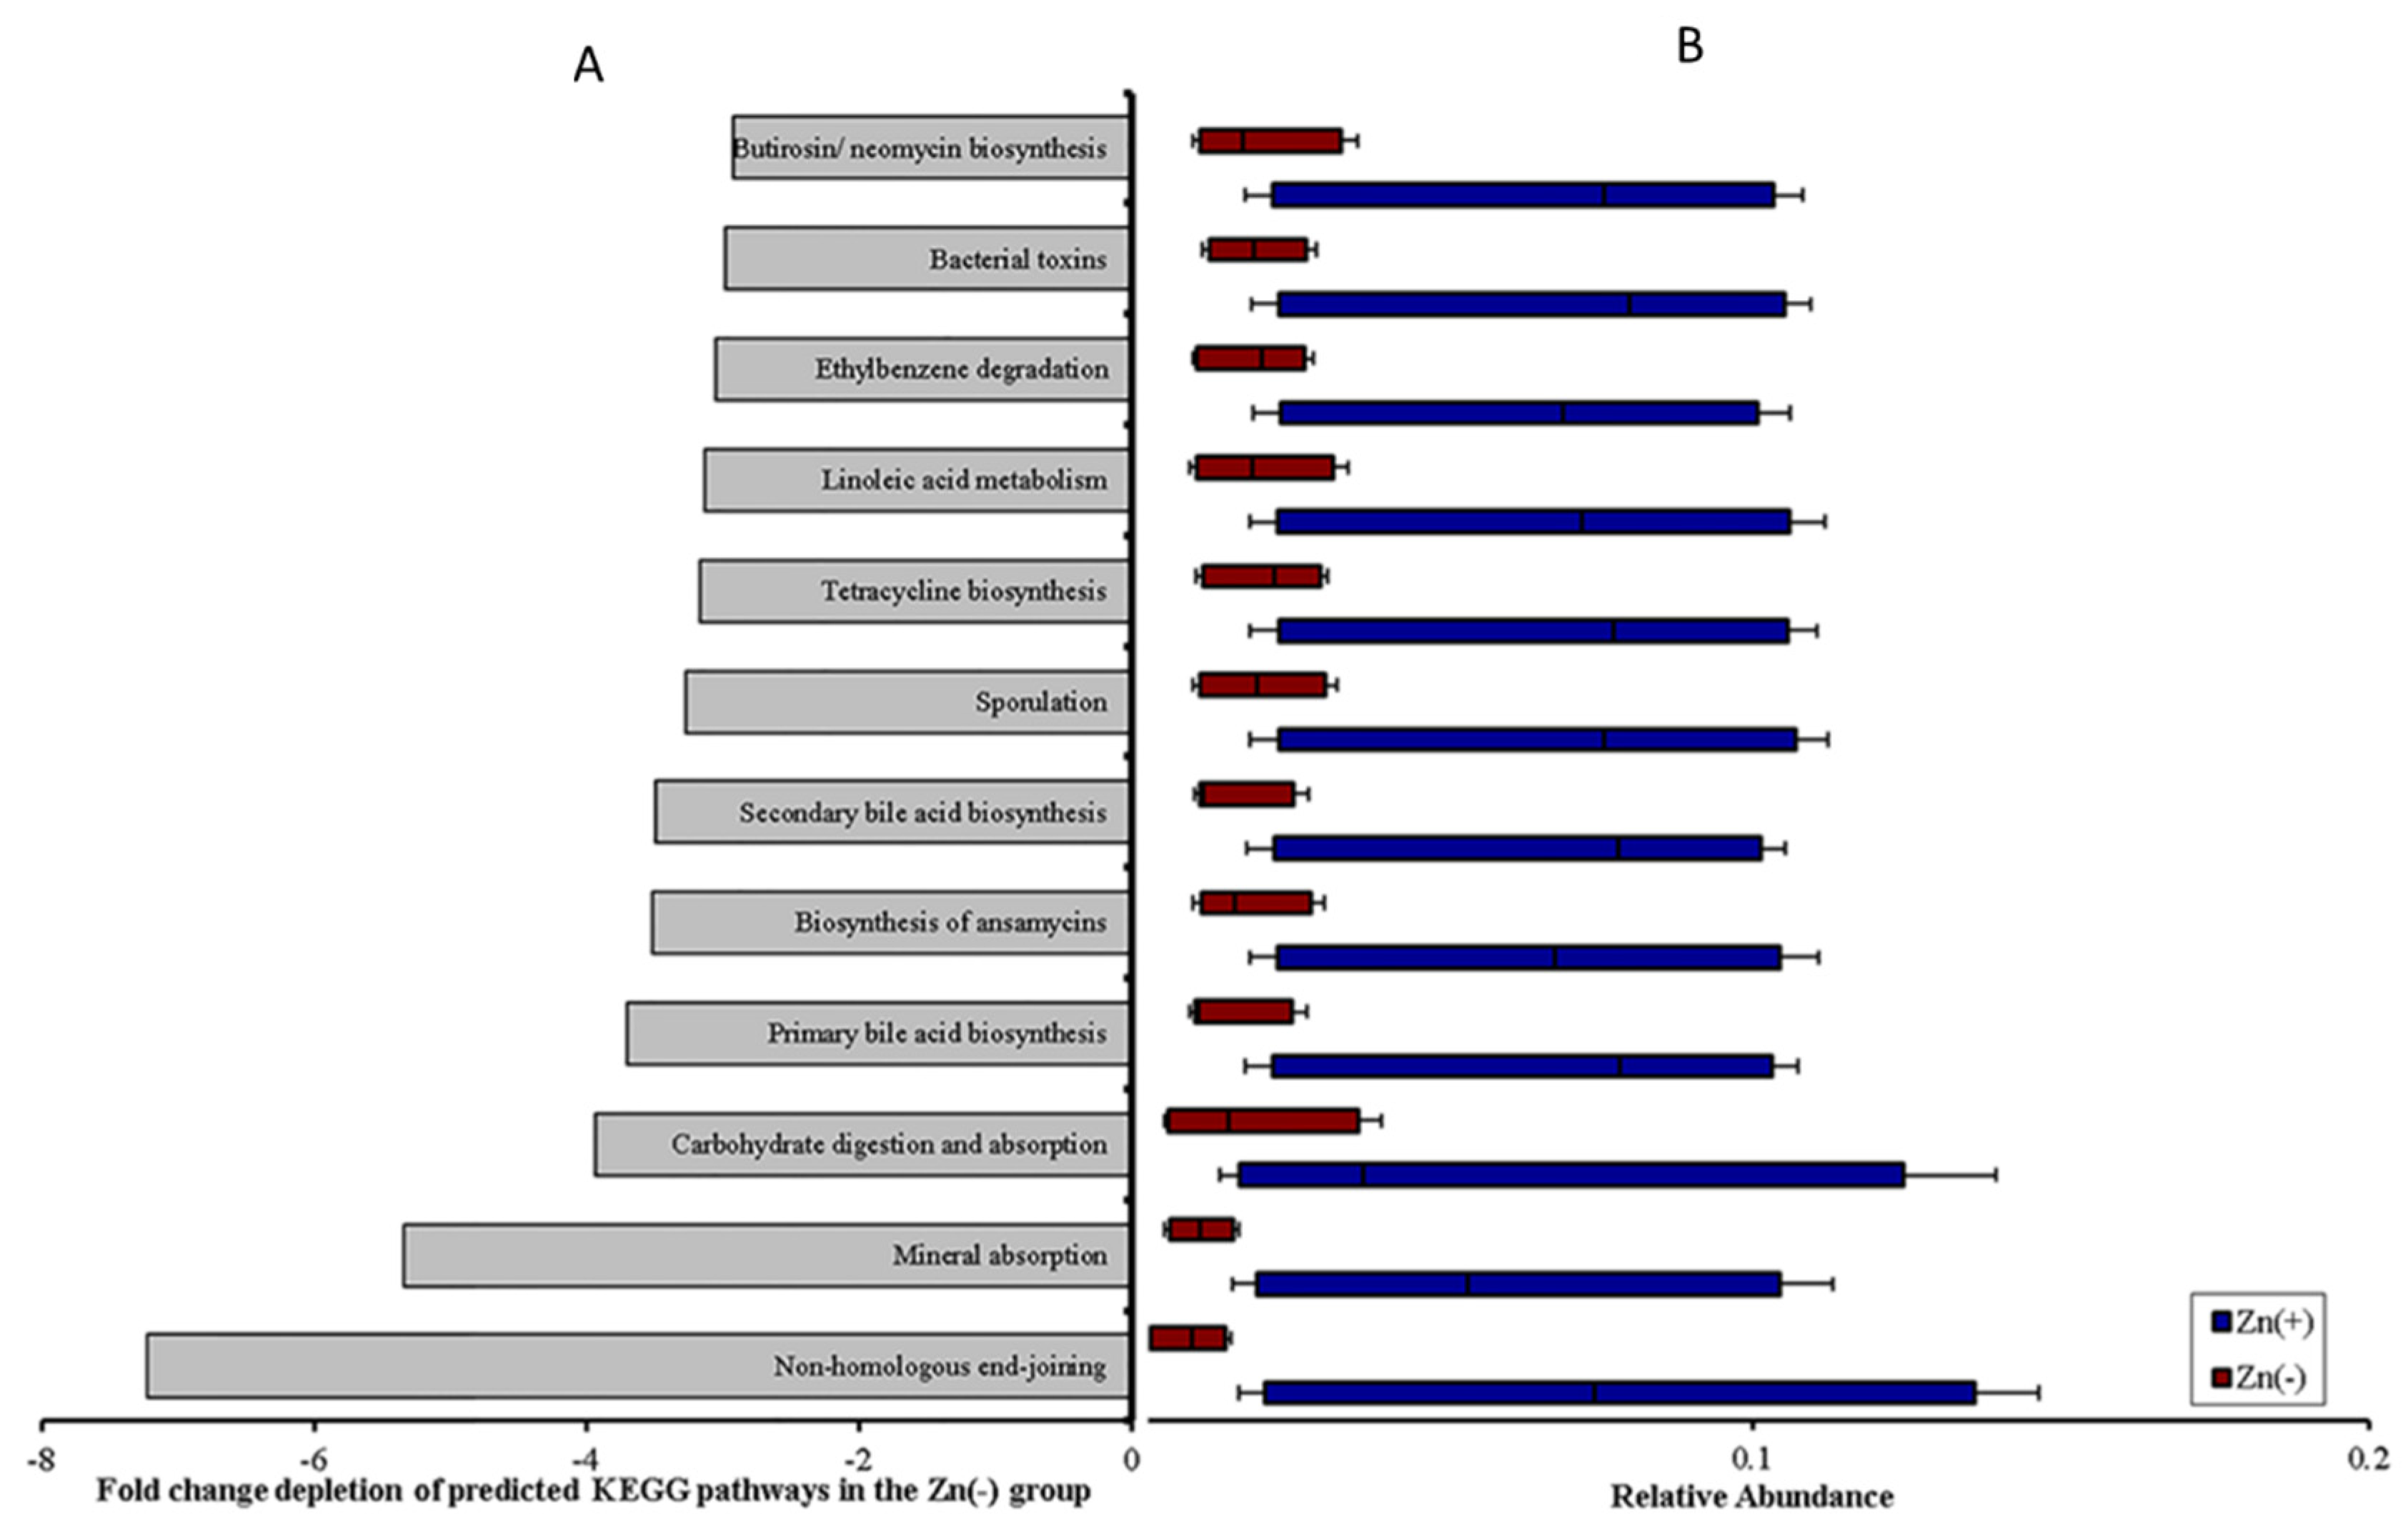
3.1.3. Functional Alterations in the Genetic Capacity of Cecal Microbiota under Zn Deficiency Conditions

We next sought to understand whether the genetic capacity of the microbiota may influence host Zn status, since there were significant community shifts associated with physiological markers of Zn deficiency. The study of metagenomic alterations among various phenotypes (e.g., inflammatory bowel disease, obesity) and between healthy and diseased subjects has helped to elucidate how the functional shifts of the microbiota may affect the trajectory of the disease process [44]. However, the medical significance of alterations in the metabolic or functional capacity of the host microbiome under Zn deficiency conditions is unknown. Metagenome functional predictive analysis was carried out using the PICRUSt software [45], the OUT abundance was normalized using the 16S rRNA gene copy number and identified using the Greengenes database, and the prediction of Kyoto Encyclopedia of Genes and Genomes (KEGG) orthologs was calculated [45]. Considering that dietary Zn depletion was the singular variable in our experiments, 12 of the 265 (4.5%) KEGG metabolic pathways analyzed were differentially expressed between the Zn-deficient and adequate groups (Figure 4A,B). Non-homologous end-joining was most significantly depleted in Zn deficiency, which was an expected finding, as Zn fingers are found in the catalytic subunit of DNA polymerase [46,47] and are essential for DNA binding and repair [48]. Further, we observed that even basic cecal microbiome metabolism was perturbed under Zn deficiency; pathways involving lipid metabolism, carbohydrate digestion and absorption, and, most pertinent to this study, mineral absorption were significantly depleted in the Zn(−) group (Figure 6). Other disruptions in microbial pathways involving the biosynthesis of bile acid and secondary metabolites as well as xenobiotic detoxification reflect the fundamental requirement of dietary Zn in Zn finger motifs and in copper–zinc superoxide dismutase/glutathione enzymes, respectively. Finally, we utilized a GC-MS (gas chromatograph–mass spectrometer) to analyze the SCFA concentration in the cecal contents of Zn(−) and Zn(+) birds (Figure 7). SCFAs are produced by bacterial fermentation and serve as a primary metabolic substrate for colonocytes [48]. We observed a significant decrease in the concentration of acetate (C2) and hexanoate (C6) in Zn(−) cecal contents. Pertinent to our results, SCFAs may increase dietary Zn absorption via a decrease in luminal pH in the intestines [49], thereby increasing Zn solubility, and/or via stimulation of the proliferation of intestinal epithelial cells, leading to an increase in the overall absorptive area of the intestines [50]. In this study, a decrease in SCFA concentration in the Zn(−) group may have followed from either the observed bacterial composition shifts and/or the decreased output of carbohydrate metabolism and fermentation via changes in microbial metabolic pathways. In the host, this may initiate a continuous cycle, which serves to limit Zn uptake even in an already Zn-deficient state.
In this study, we revealed a dramatic compositional and functional remodeling that occurs in the Gallus gallus gut microbiota under chronic Zn-deficient conditions. Compositional alterations in bacterial abundance, in part due to host–microbe and microbe–microbe interactions, lead to changes in the functional capacity of the microbiota, such as SCFA output, which can influence the absorption and availability of dietary Zn by the host. Our data suggest that, as a consequence of this remodeling, Zn (–) microbiota have the potential to perpetuate, and perhaps even aggravate, the Zn-deficient condition through the further sequestration of Zn from the host (Figure 8). Such microbiota are not functionally compatible with the physiological needs of the Zn-deficient host. In addition, others have observed decreased luminal Zn solubility in the intestines [51], increased GI inflammation and intestinal permeability, and an overall decline in GI health [52,53] under Zn deficiency. Our findings add to this knowledge by suggesting possible mechanisms by which the gut microbiota may contribute to host Zn deficiency. Further research should determine whether the gut microbiome could represent a modifiable risk factor for chronic Zn deficiency.

3.2. The Alterations in the Gut (Gallus gallus) Microbiota Following the Consumption of a Zinc-Biofortified Wheat (Triticum aestivum)-Based Diet

In the Second Study, We Investigated the Alterations in the Gut (Gallus gallus) Microbiota Following the Consumption of a Zinc-Biofortified Wheat (Triticum aestivum)-Based Diet.
This six-week feeding trial investigated the compositional and functional alterations of the intestinal microbiota in broiler chickens fed a Zn-biofortified wheat-based diet (BZn) versus a pair-fed Zn control wheat-based diet (CZn). We hypothesized that the increased dietary Zn content in the biofortified wheat-based diets would positively alter the gut microbiome in the BZn group and that the relative deficit of Zn in the CZn group would cause an expansion of pathogenic microbiota. A spectrum of Zn status biomarkers was measured on a weekly basis to screen the level of Zn deficiency, and gene expression of a variety of Zn-dependent proteins was measured from relevant tissues at the conclusion of the study. Duodenal samples were taken for identification of villus morphological changes at the conclusion of the study. The 16S rRNA gene sequencing method was utilized to analyze the microbial population’s variations in the intestinal cecal contents.

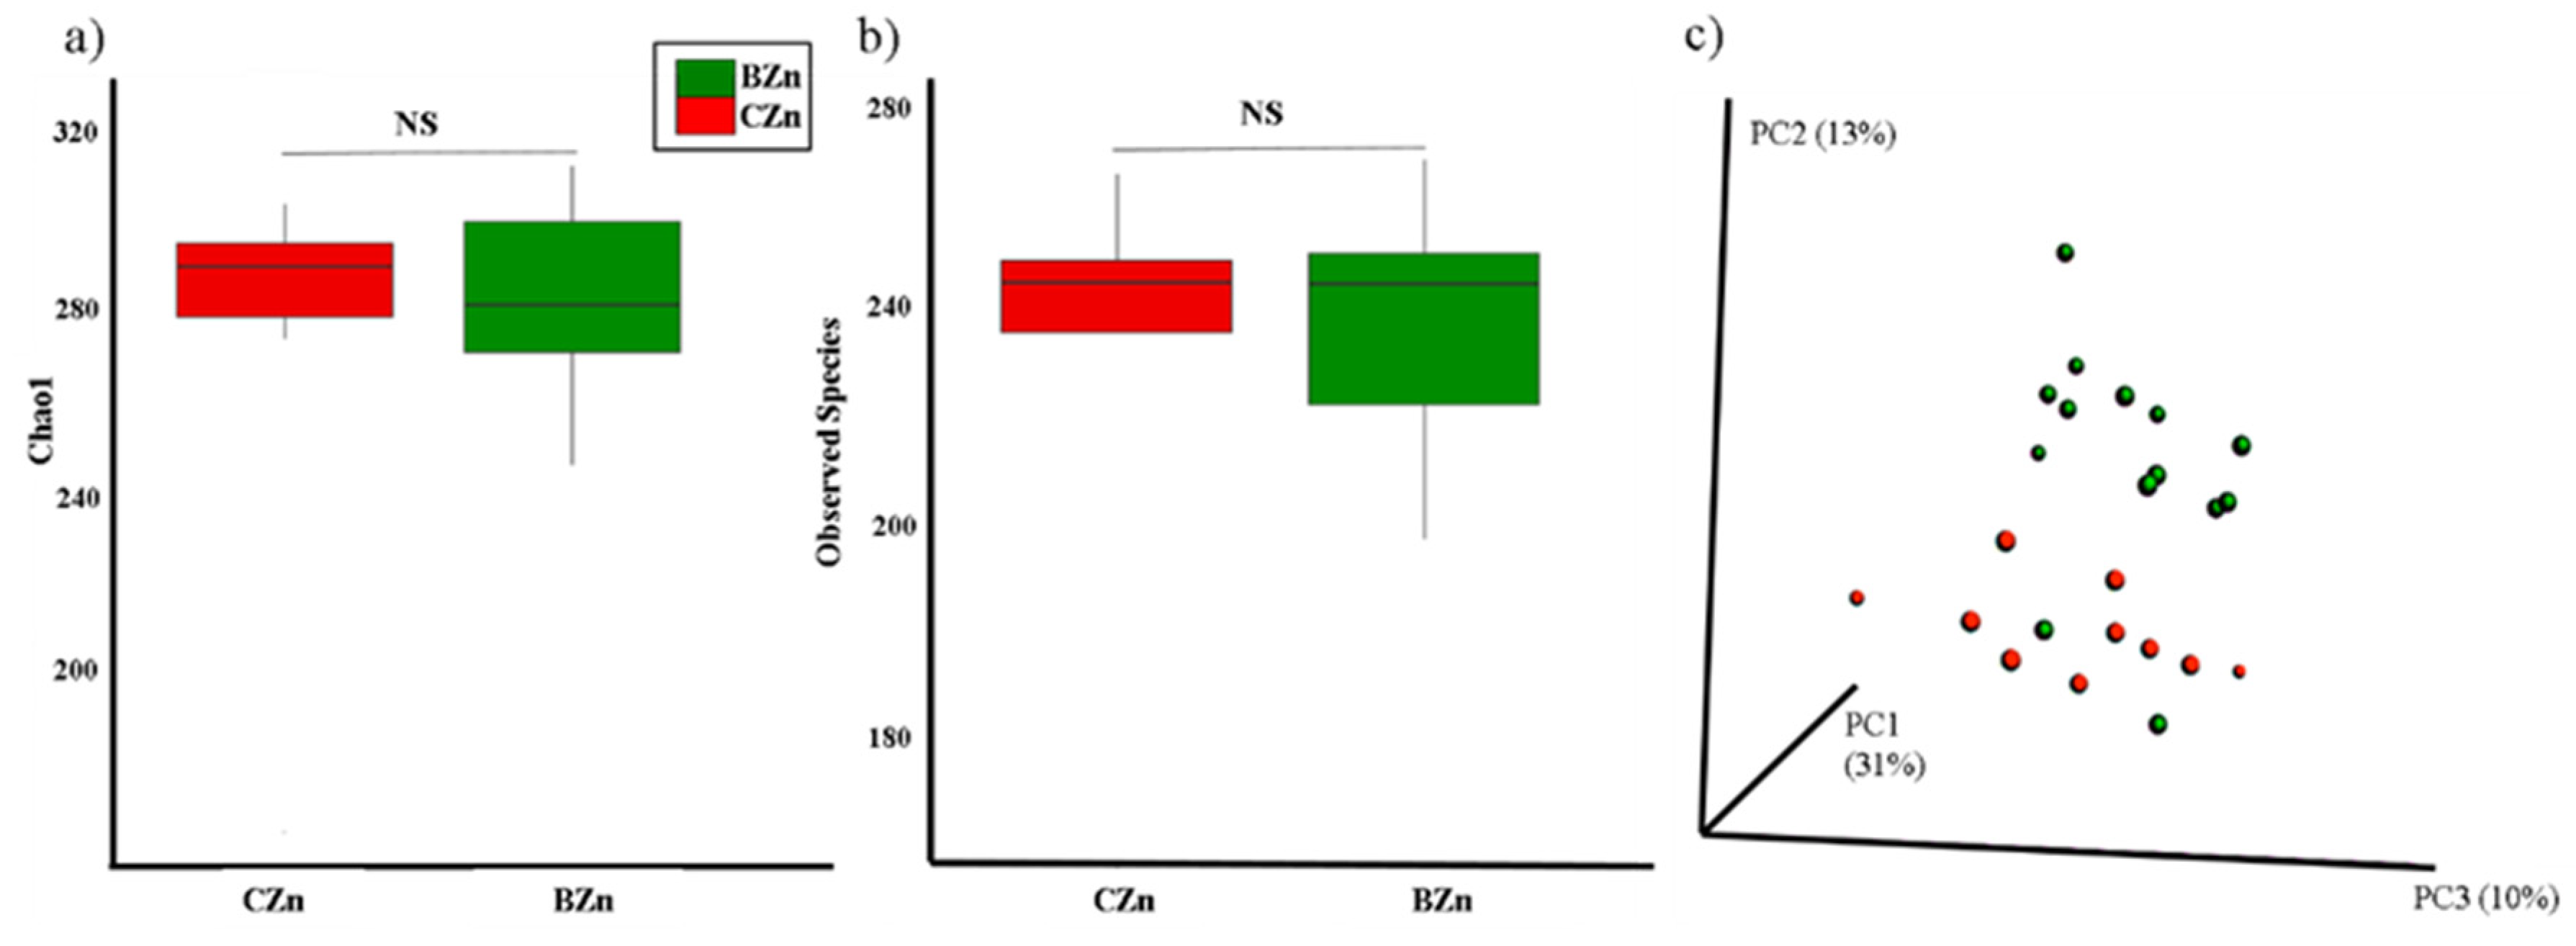
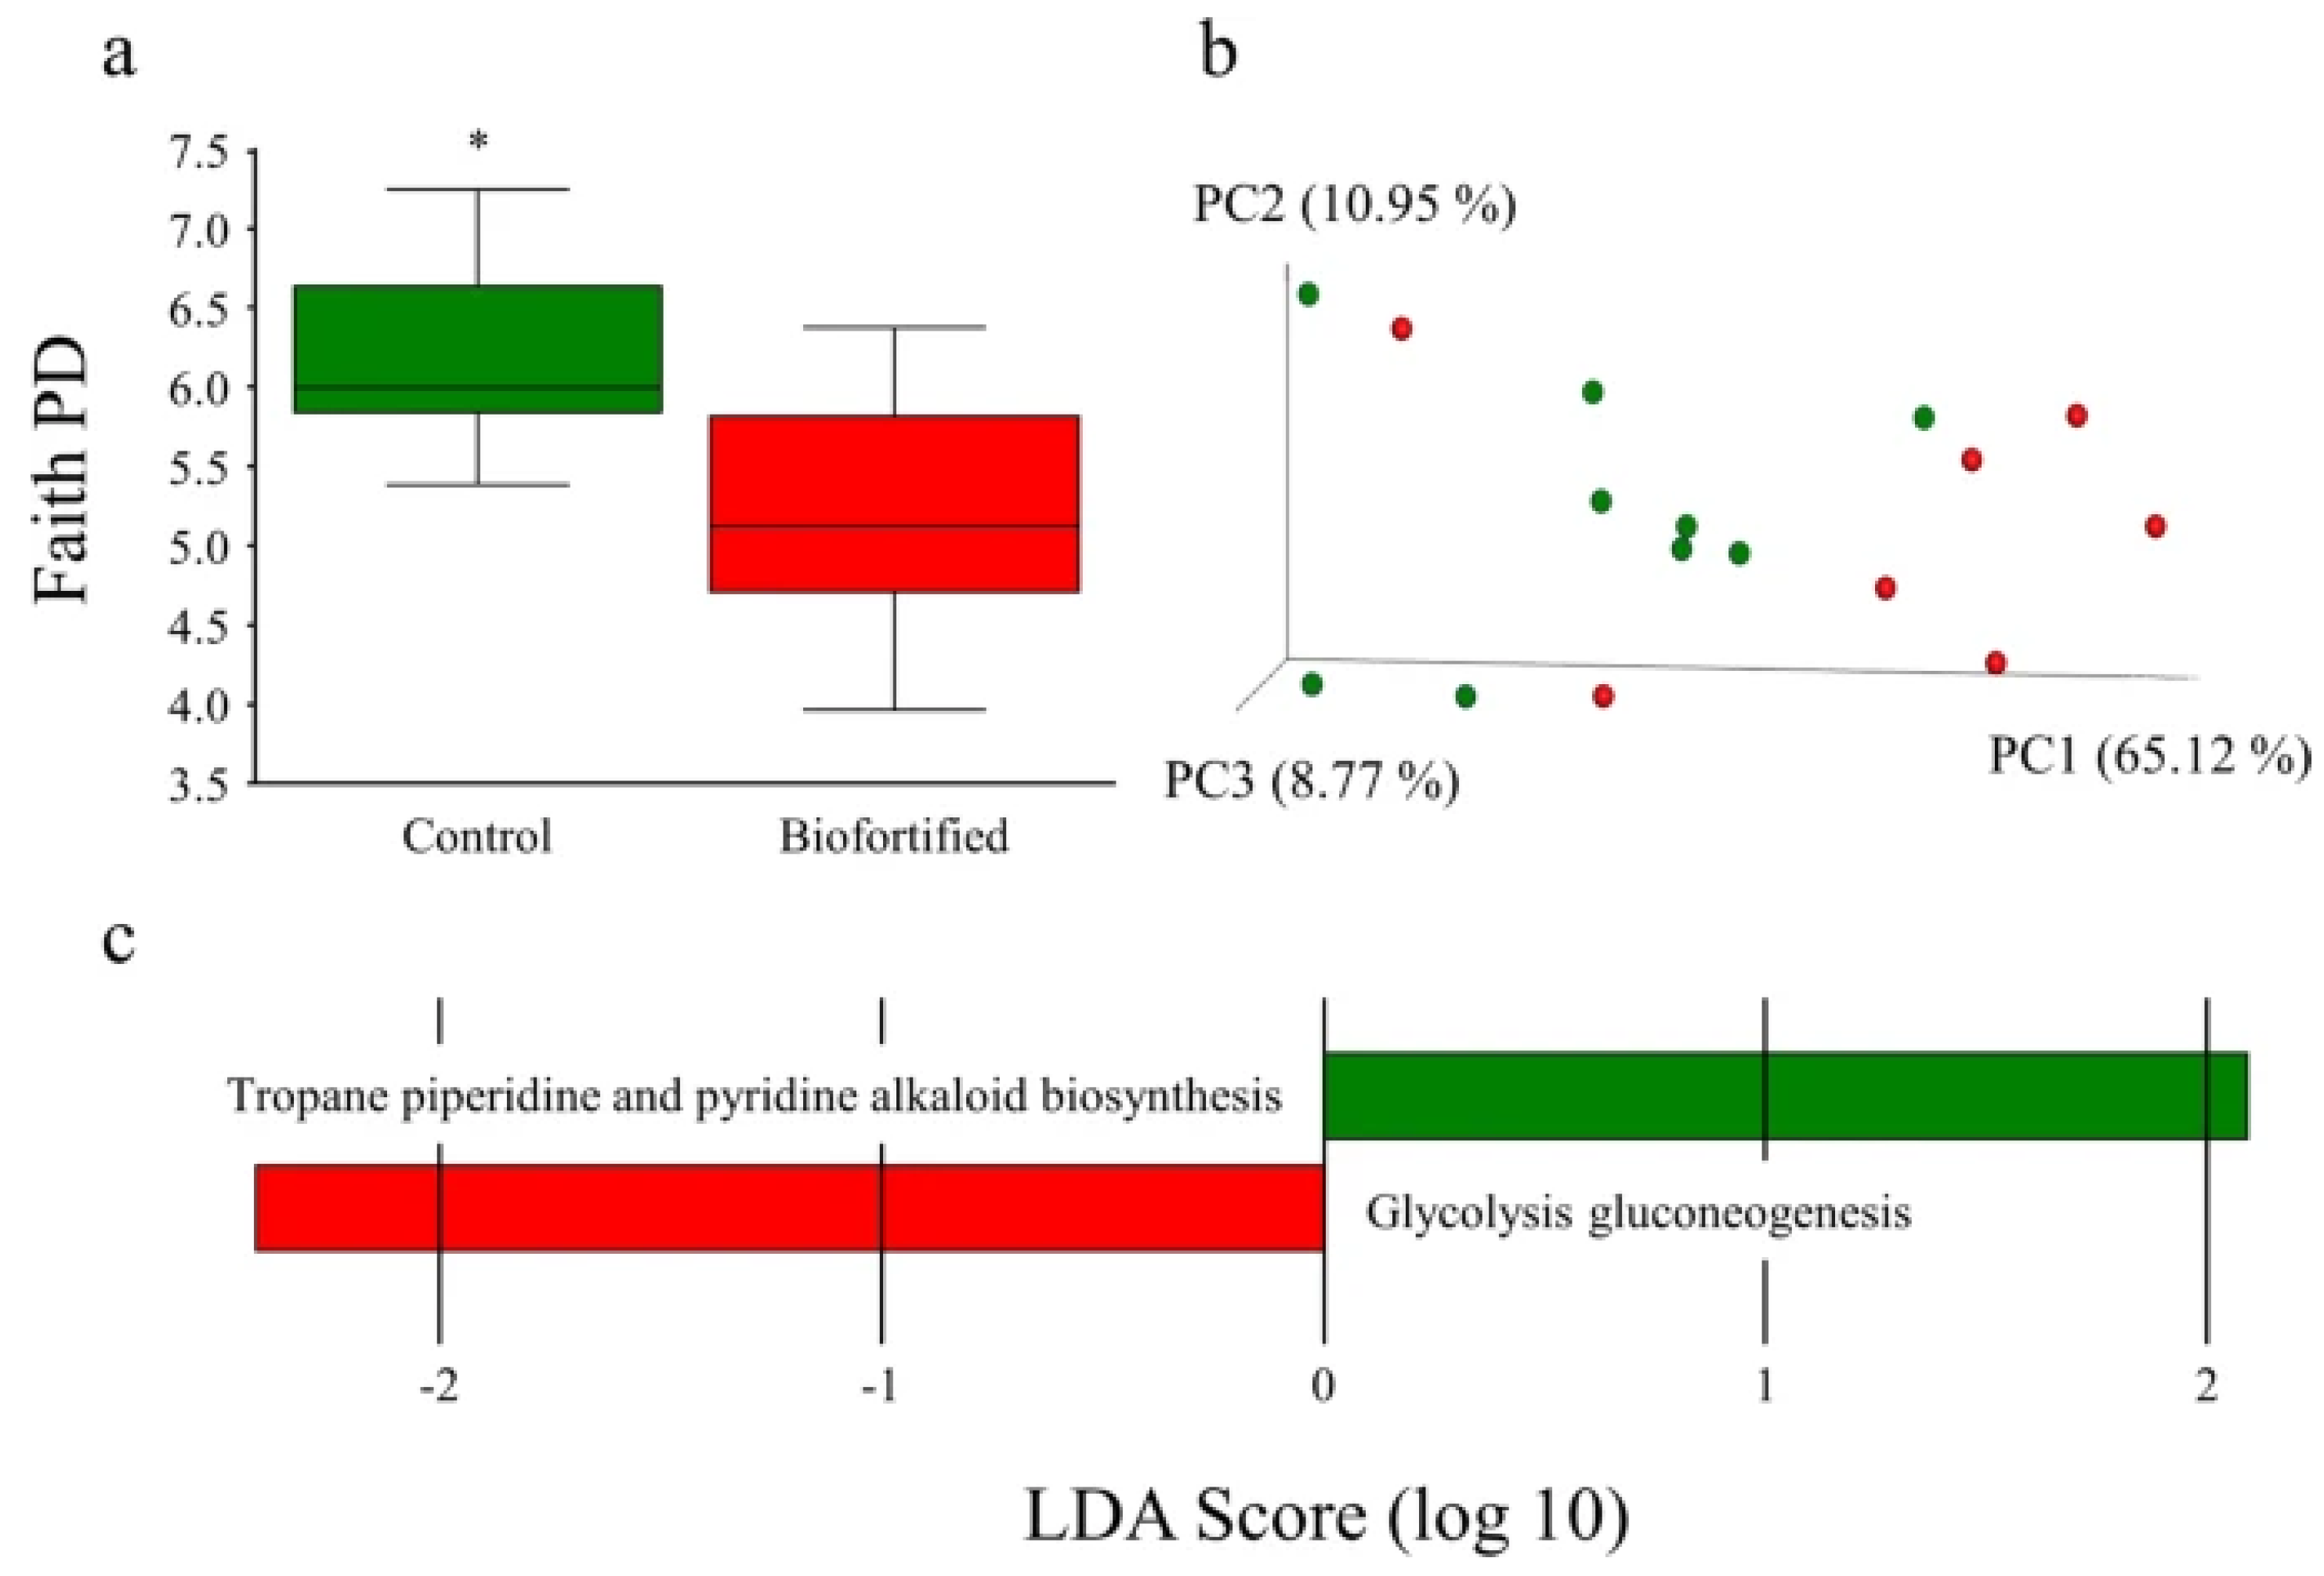
3.2.1. The β-Diversity but Not α-Diversity of the Intestinal Microbiota Is Significantly Altered by the Zn-Biofortified Diet

Cecal content samples from the CZn and BZn treatment groups were collected and used for bacterial DNA extraction and sequencing of the V4 hypervariable region in the 16S rRNA gene. The cecum contains highly diverse and abundant microbiota and represents the primary site of bacterial fermentation in Gallus gallus [30] The diversity of the cecal microbiota between the two treatment groups was assessed initially through measures of α- and β-diversity. The Chao1 index, used to assess α-diversity (Figure 5a), was not significantly different between the CZn and BZn groups (p > 0.05). No difference was obtained in the number of observed species between groups (Figure 5b, p > 0.05). We utilized unweighted UniFrac distances as a measure of β-diversity to assess the effect of the Zn-biofortified diet on between-individual variation in bacterial community composition (Figure 5c). Principal coordinate analysis showed a statistically significant difference in clustering between the CZn and BZn groups, suggesting that individual samples were more similar to other samples within the same group, as opposed to samples of the other group (p < 0.05). Additionally, individual samples of the CZn group clustered significantly closer to each other than did members of the BZn group (p < 0.05).

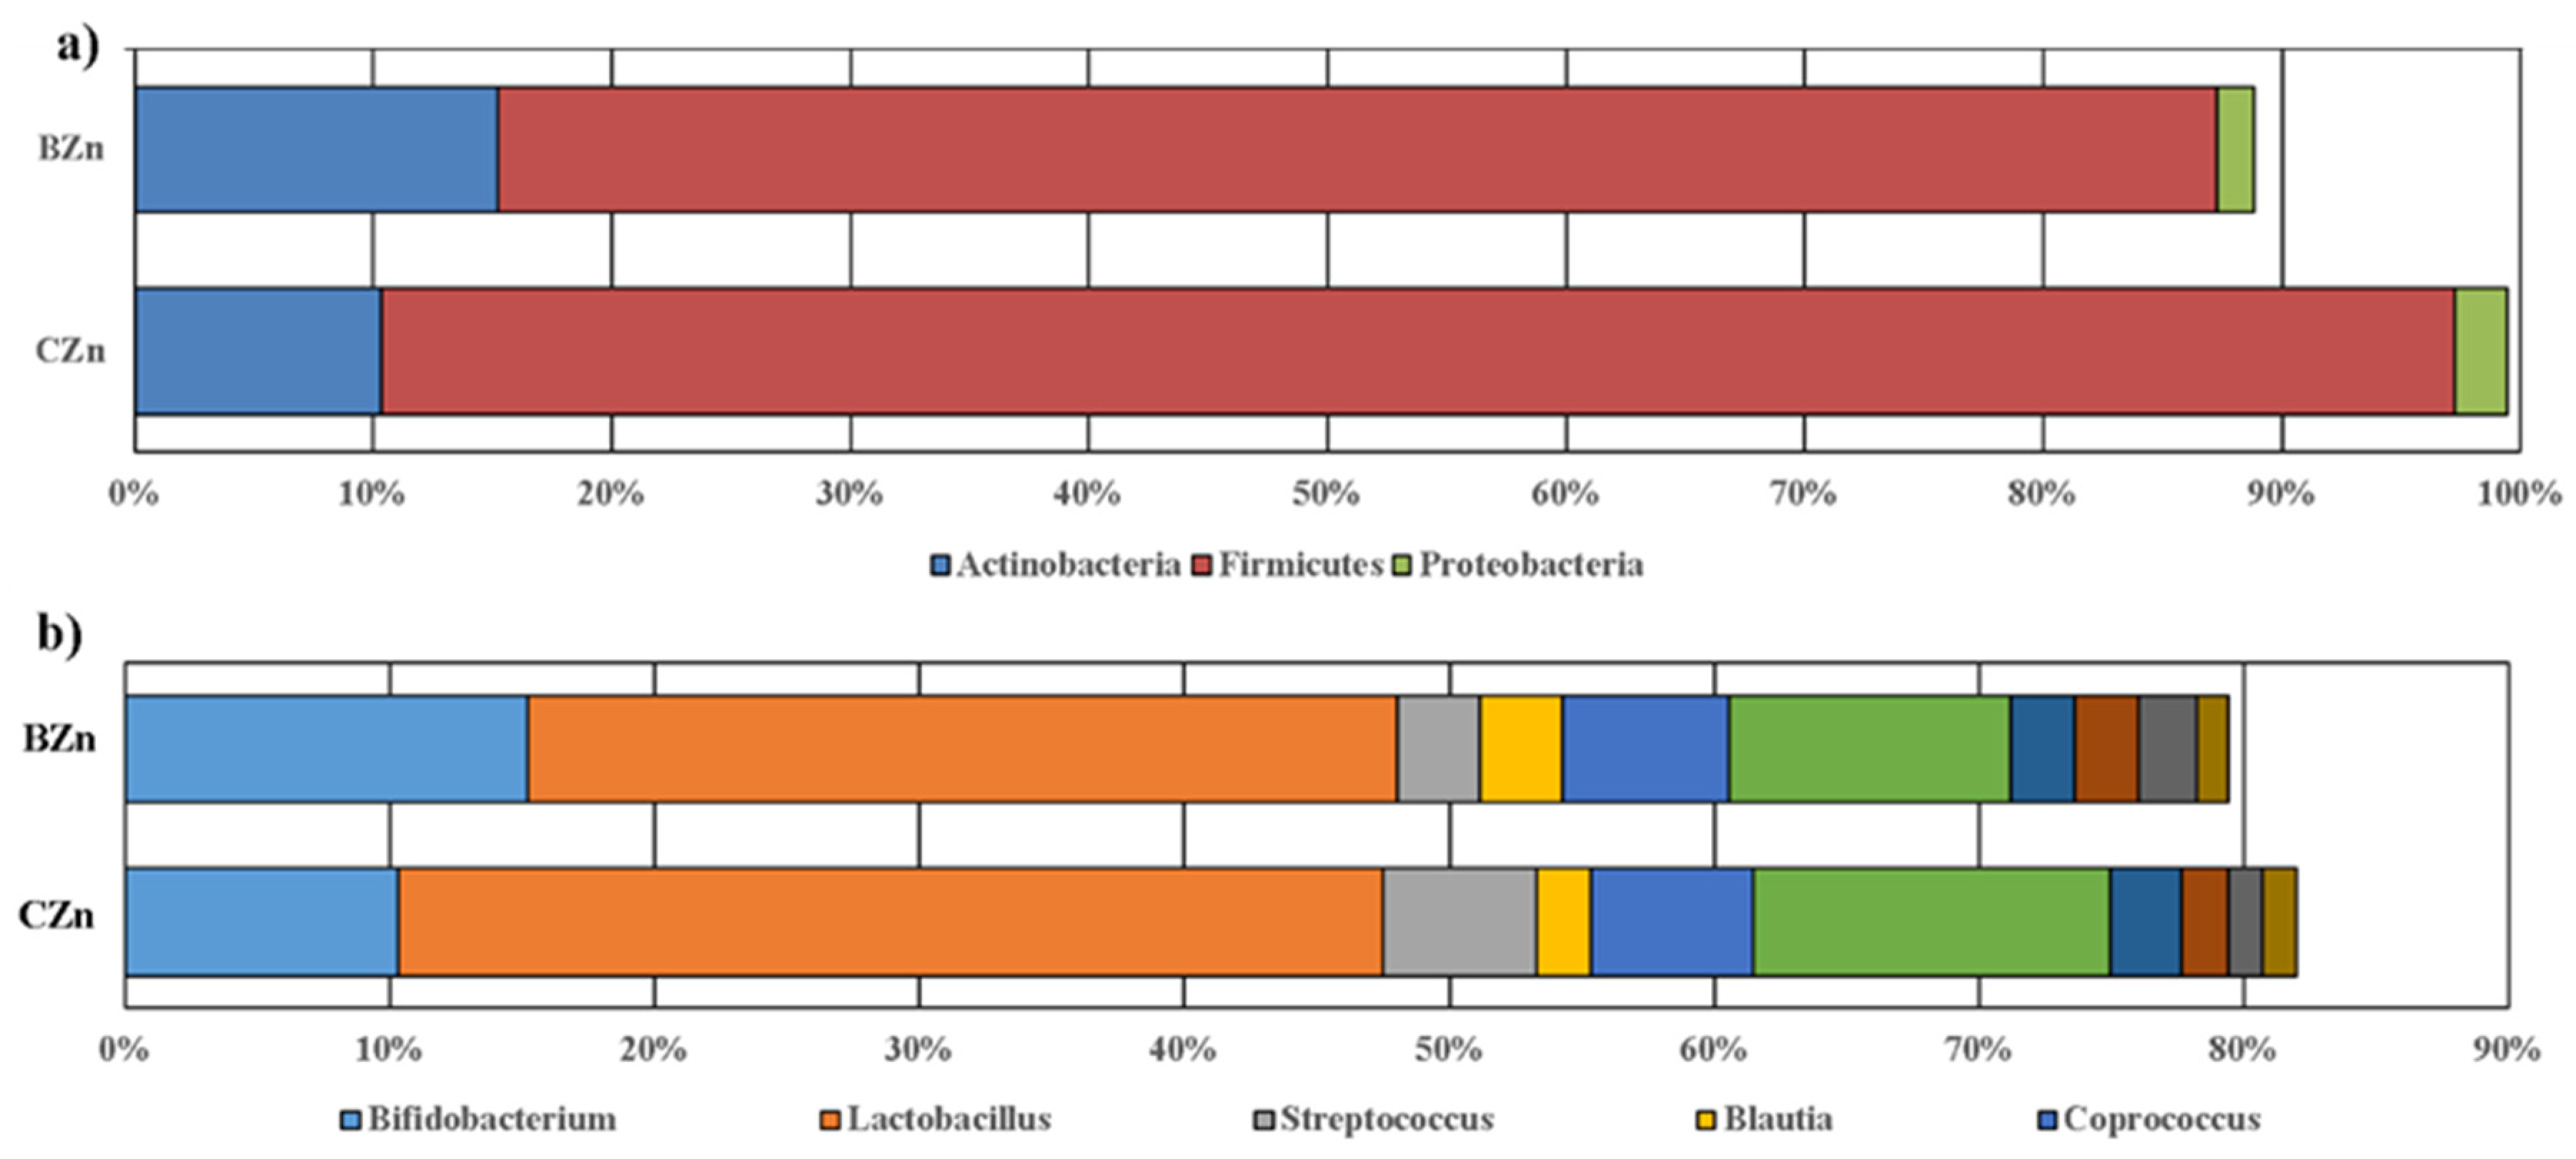
3.2.2. Effects of a Zn-Biofortified Diet on the Composition of the Intestinal Microbiota

We conducted a taxon-based analysis of the cecal microbiota. The 16S rRNA gene sequencing revealed that >98% of all bacterial sequences in both treatment groups were dominated by three major phyla: Firmicutes, Actinobacteria, and Proteobacteria, whereas sequences of Bacteroidetes, Fusobacteria, and Verrucomicrobia were also identified, but in much lower abundance. The differences in abundance between the three dominant phyla were not significant between treatment groups (Figure 6a; p = 0.300, p = 0.300, and p = 0.701). After FDR correction, no significant differences between groups at the genus level were identified (Figure 6b). As in the human gut [54], the Firmicutes phylum vastly predominated in the Gallus gallus cecum [32]. We next investigated whether these taxonomic shifts were associated with the host phenotype as defined by the measured physiologic markers of Zn status, specifically gene expression of the various ZnT and ZIP family transmembrane proteins. In general, ZIP members facilitate Zn influx into the cytosol from extracellular fluid or from intracellular vesicles, while ZnT transporters lower intracellular Zn by mediating Zn efflux from the cell or influx into intracellular vesicles [55]. These proteins are widely transcribed in the brush border of the small intestine [56]. When dietary Zn is low, enterocytes increase ZIP expression with more ZIPs localized to the apical membrane, while ZnT members are downregulated in an attempt to restore Zn homeostasis during depleted intestinal Zn conditions. However, both increased and decreased ZnT expression have been demonstrated in response to Zn deficiency [57,58]. Figure 6a demonstrates that animals with increased ZnT7 expression cluster more closely compared to those with lower expression (q = 0.028). Figure 3 shows two genera, Lachnospiraceae and Erysipelotrichaceae, that were depleted in animals with increased ZnT7 expression, while Figure 3 shows two genera, Phascolarctobacterium and Veillonella, that were enriched in animals with increased ZnT7 expression. Both Veillonella and members of the family Erysipelotrichaceae have been shown to increase in abundance following therapeutic levels of Zn oxide in porcine models, but their interaction with ZnT transporters at more physiologic doses of Zn needs to be further clarified in this animal model [59]. We utilized MaAsLin to identify a significant positive association between the Ruminococcus genus and the BZn group (q = 0.036, Figure 3). Additionally, Δ6 desaturase, a Zn-dependent enzyme that catalyzes fatty acid desaturation, and ZIP9 were also positively correlated with the Ruminococcus genus (q = 0.035 and q = 0.012, respectively).

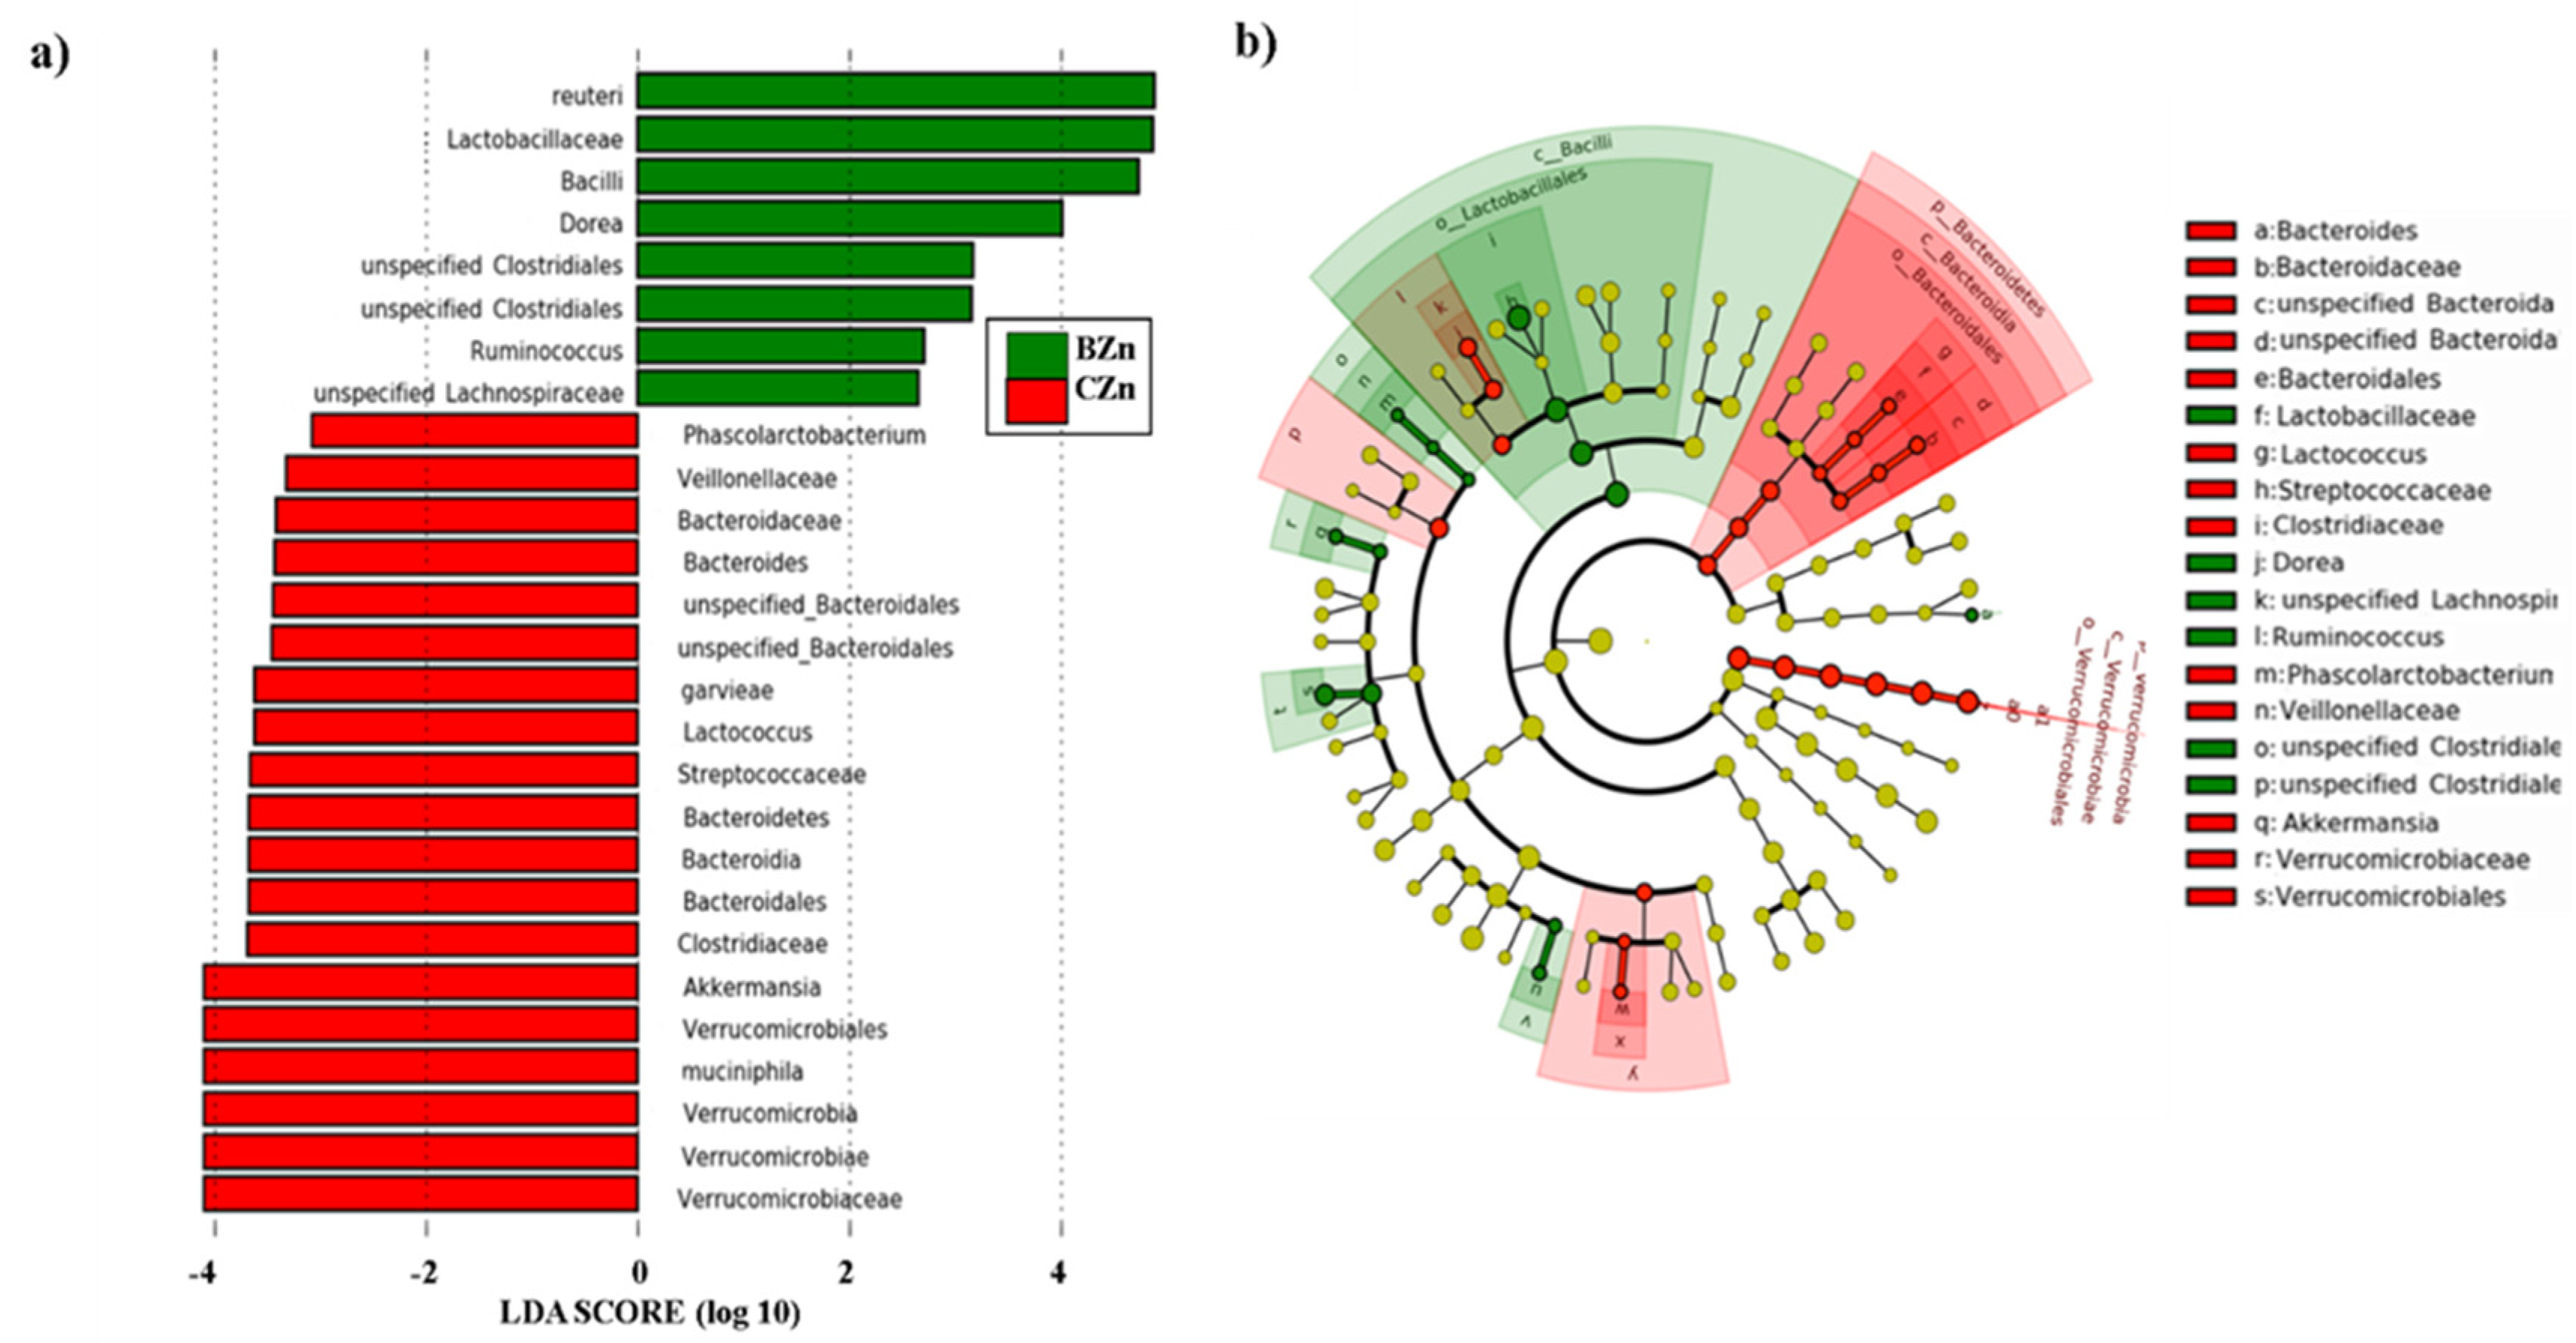
3.2.3. Significant Bacterial Biomarkers Can Discriminate the Intestinal Microbiota of the BZn Versus CZn Groups

For the investigation of relative abundances at all taxonomic levels, we used the linear discriminant analysis effect size (LEfSe) method to investigate significant bacterial biomarkers that could identify differences in the gut microbiota of the BZn and CZn groups [60]. Figure 7a,b presents the differences in abundance between groups at the various taxonomic levels with their respective linear discriminant analysis (LDA) scores. We observed a general taxonomic delineation between the BZn and CZn groups, whereby the SCFA-producing Firmicutes predominated in the BZn group. Specifically, Lactobacillus reuteri (LDA score = 4.94, p = 0.024) and members of the Dorea (LDA score = 4.04, p = 0.010), Clostridiales (LDA score = 3.39, p = 0.008), Ruminococcus (LDA score = 3.35, p = 0.001), and Lachnospiraceae genera (LDA score = 3.21, p = 0.015) were significantly enriched in the BZn group. In the CZn group, however, members of Verrucomicrobia and Bacteroidetes were the predominantly enriched phyla. Specifically, Akkermansia muciniphila (LDA score = 4.17, p = 0.022), Lactococcus (LDA score = 3.57, p = 0.021), and members of the Verrucomicrobium (LDA score = 4.17, p = 0.021), Bacteroides (LDA score = 3.05, p = 0.010), and Bacteroidales (LDA score = 3.46, p = 0.014) genera were significantly enriched in the CZn group.

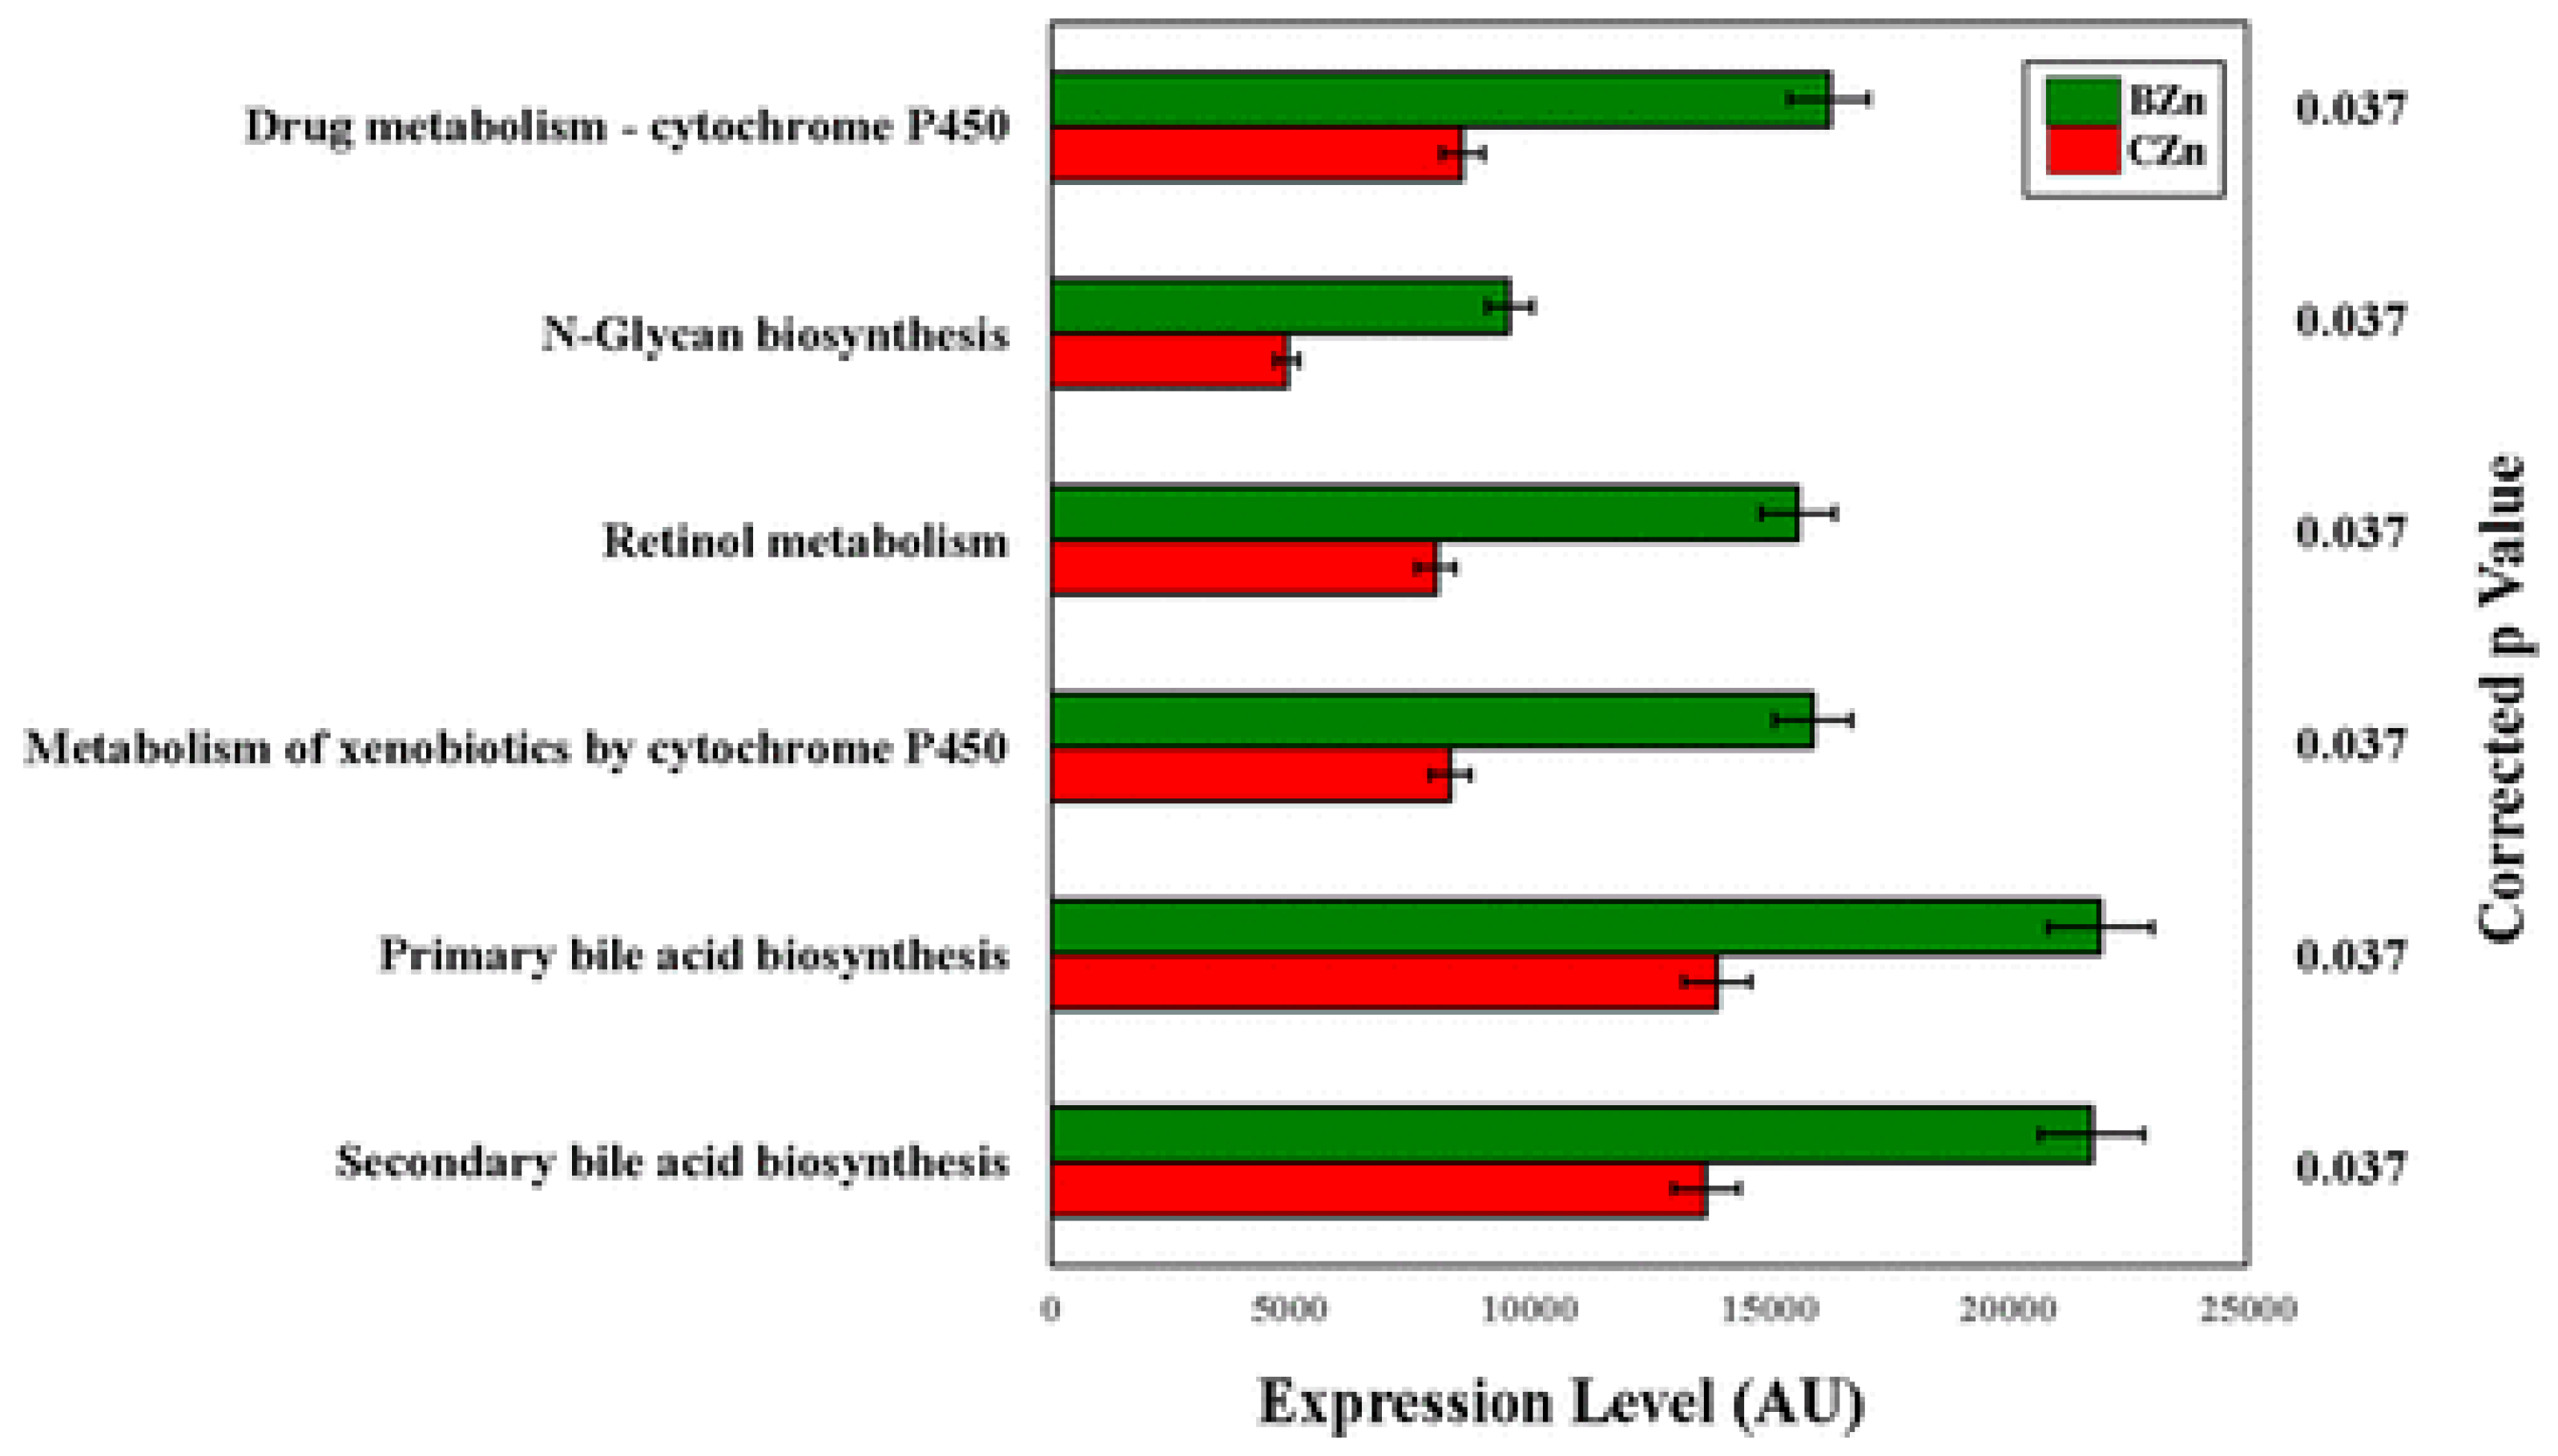
3.2.4. A Zn-Biofortified Diet Alters the Metagenomic Potential of the Intestinal Microbiota

We investigated whether the Zn-biofortified diet influenced the genetic capacity of the microbiota. We recently demonstrated that metagenomic perturbations of the gut microbiota in Gallus gallus influence the severity of Zn deficiency provided by an elemental diet by, among other pathways, decreasing the capacity of resident bacteria of producing beneficial SCFAs for optimal Zn absorption by the host. However, the clinical significance of alterations in the metabolic or functional capacity of the host microbiome from the consumption of a more realistic Zn-biofortified diet has not previously been explored, even though Zn-biofortified diets are consumed on a population-wide level. Using PICRUSt [45], the metagenome functional predictive analysis revealed that in the BZn group, 157 of the 240 (~65%) KEGG metabolic pathways analyzed were differentially enriched as compared to the CZn group (p < 0.05). After FDR correction, 6 of the 240 (~3%) KEGG metabolic pathways analyzed were differentially enriched as compared to the CZn group (Figure 8).
As demonstrated in Figure 6, the taxonomic shifts associated with the Zn-adequate phenotype are similar to our previously published observations: Ruminococcus is strongly correlated with Zn adequacy and elevated Δ6 desaturase activity (a Zn-dependent, rate-limiting enzyme of fatty acid desaturation and biomarker of Zn deficiency). Ruminococcus contributes to a significant bulk of gut SCFA production such that its absence significantly reduces dietary insoluble carbohydrate fermentation [61]. As we have previously described, SCFAs have the potential to increase Zn solubilization and utilization, thereby improving host Zn status. With these new data, increasing evidence now implicates the Ruminococcus genus as an indicator of and potential contributor to improved host Zn status. Further longitudinal trials are needed to identify the specific role of Ruminococcus in host–microbiota Zn balance.
LEfSe analysis revealed that the BZn group was enriched in Bacilli and the lower Lactobacillus. Members of the Lactobacillus genus, such as L. reuteri and other lactic acid bacteria, have been shown to improve gut health in humans and a variety of animal models by increasing villus surface area, goblet cell number per villus, and decreasing colonization of pathogenic microorganisms like Salmonella and enteropathogenic E. coli [62,63]. A major mechanism by which they benefit the host is via improved mucosal barrier integrity from the production of SCFAs [64]. As we and others have previously demonstrated [65], dietary Zn deficiency has a dramatic effect on limiting gut SCFA production, which can further perpetuate a Zn-deficient phenotype. The CZn group, however, was dominated by Bacteroidetes, Verrucomicrobia, and the lower Akkermansia muciniphilia, a novel mucin-degrading bacterium [66]. Increases in Verrucomicrobia and other mucin-degrading bacteria have been demonstrated after ingestion of certain dietary products (i.e., ellagitannins and other polyphenolic compounds) [67]. Conflicting data exist for this group of bacteria as it pertains to Zn deficiency; some animal studies show that therapeutic levels of Zn (specifically Zn oxide) increase Verrucomicrobia, while others show an increase in abundance during Zn deficiency [68]. Clearly, the significance of this group in Zn deficiency is not known, and additional research is needed to explain the conflicting compositional changes from dietary increases in Zn through biofortification versus supplementation [69]. Recent studies demonstrate that both Verrucomicrobia, specifically Akkermansia muciniphilia, and members of the Bacteroidetes possess a significant capacity for lateral gene transfer of Zn-metallopeptidase enzymes [70]. A relative enrichment of these groups in the CZn compared to the BZn group may illustrate a pertinent example of host–microbe interplay; bacteria with the capacity to degrade mucin, an important nutrient contributor to overall mucosal homeostasis, can transfer vital Zn-dependent metalloproteinases when conditions of low luminal Zn exist and production of these enzymes is naturally suppressed. This interplay is highlighted further in the CZn group, where KEGG analysis revealed a significant decrease in bacterial cyp450 production. This enzyme family is responsible for producing the Zn-dependent superoxide dismutase enzyme, which has demonstrated a central role in modulating Zn-deficiency-induced reduction of crypt cell proliferation and villus surface area, and diminishes brush border disaccharidase activity. Therefore, in a mutualistic fashion, the observed proliferation of these bacteria may be explained as a compensatory mechanism to a mucin-rich, Zn-depleted gut. Using these findings, future studies should focus on the specific mechanisms whereby these bacteria may be attempting to restore Zn homeostasis during dietary Zn restriction.
To summarize, the presented findings exhibit a significant remodeling of the intestinal milieu that occurs in animals receiving a clinically relevant Zn-biofortified wheat-based diet. This study is the first to report on how Zn-biofortified wheat affects the composition and metagenome of the intestinal microbiota. Animals who consumed the Zn-biofortified wheat-based diet had increased microbial β-diversity, with concomitant increases in SCFA-producing lactic acid bacteria. Jointly, these observations deliver the indication that ingesting a Zn-biofortified wheat-based diet positively restructures the gut microbiota. As the consumption of Zn-biofortified diets rises due to the increasing application of biofortification strategies, exploring the effects on the gut microbiota from Zn-biofortified staple food crops remains an important strategy for further advancing the efficacy and safety of this method.

3.3. Nicotianamine-Enhanced Fe- and Zn-Biofortified Wheat May Affect Microbial Populations In Vivo (Gallus gallus)

In a third study, we investigated how Nicotianamine-enhanced Fe- and Zn-biofortified wheat may affect microbial populations in vivo (Gallus gallus) [29].
Nicotianamine (NA) is a natural chelator of Fe, zinc (Zn), and other metals in higher plants, and NA-chelated Fe is highly bioavailable in vitro. In graminaceous plants, NA serves as the biosynthetic precursor to 2′-deoxymugineic acid (DMA), a related Fe chelator and enhancer of Fe bioavailability, and increased NA/DMA biosynthesis has been proved to be an effective Fe biofortification strategy in several cereal crops. In this study, we utilized the Gallus gallus model to investigate impacts of NA-chelated enhanced Fe and Zn biofortification on gastrointestinal health and microbiomes when delivered over a period of six weeks as part of a biofortified wheat diet containing increased NA, Fe, Zn, and DMA (long-term exposure).

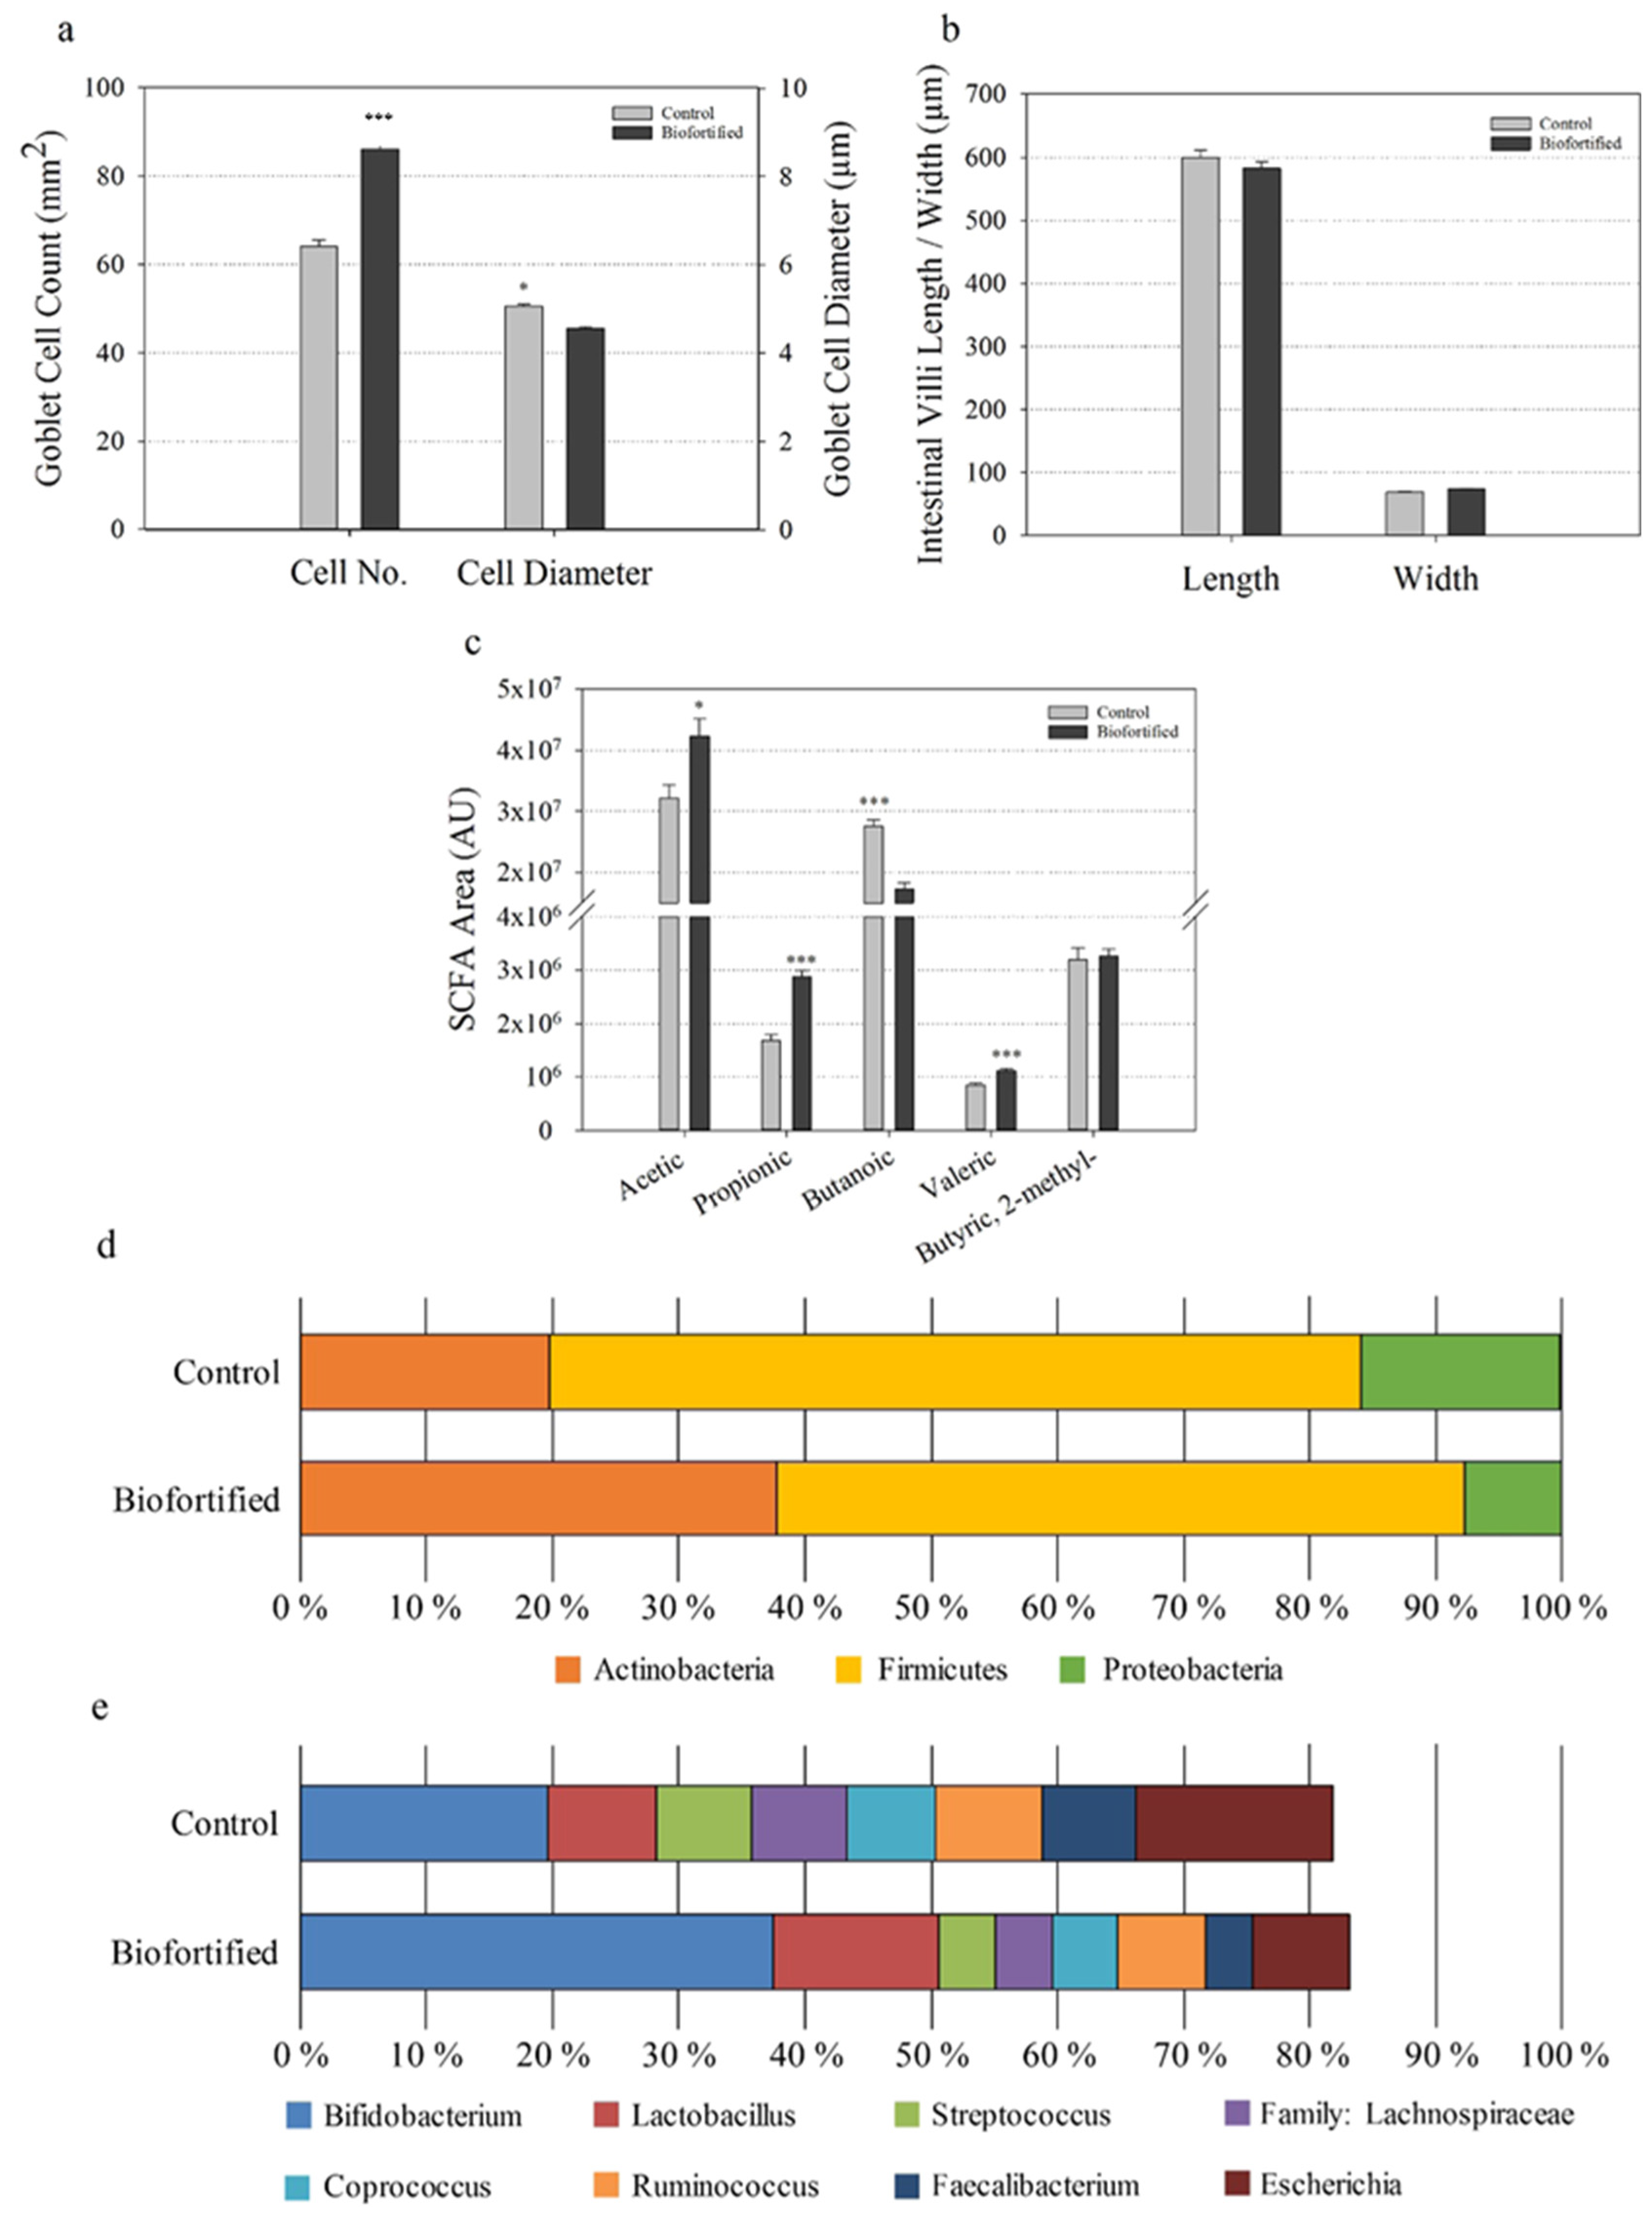
3.3.1. Biofortified White Wheat Flour Increases Goblet Cell Number and Positively Alters Gut Health and the Microbiome

The number of intestinal goblet cells significantly increased, the number of acidic/neutral goblet cells significantly increased, and the diameter of intestinal goblet cells significantly decreased in the ‘Biofortified’ relative to the ‘Control’ chickens (Figure 9a). No differences in intestinal villus length and width were detected (Figure 9b). Short-chain fatty acid (SCFA) production significantly increased for acetic acid, propionic acid, and valeric acid and decreased for butanoic acid in the ‘Biofortified’ relative to the ‘Control’ chickens (Figure 9c). For major bacteria phyla, the proportion of Actinobacteria increased 1.9-fold, while the proportions of Firmicutes and Proteobacteria decreased 1.2- and 2.0-fold, respectively, in ‘Biofortified’ ceca relative to the ‘Control’ (Figure 9d). For major bacterial genera, the proportions of Bifidobacterium and Lactobacillus increased 1.9- and 1.5-fold, respectively, while the proportions of Streptococcus (1.7-fold), Coprococcus (1.4-fold), Ruminococcus (1.2-fold) Faecalibacterium (2-fold), and Escherichia (2-fold) decreased in the ‘Biofortified’ relative to the ‘Control’ group (Figure 9d). The proportion of the family Lachnospiraceae decreased 1.7-fold and was significantly (p = 0.045) lower in the ‘Biofortified’ relative to the ‘Control’ group (Figure 9d). Only one genus, Enterococcus, was significantly (p = 0.010) more abundant in the ‘Biofortified’ (3.5%) relative to ‘Control’ group (>1.0%). The abundance of all families and genera detected decreased 1.5-fold in the ‘Biofortified’ cecum relative to the ‘Control’.

3.3.2. Biofortified White Wheat Flour Significantly Alters Diversity and Metagenomic Potential of the Intestinal Microbiota

Microbial population diversity (α-diversity), represented as Faith’s phylogenetic diversity, significantly decreased in the ‘Biofortified’ cecum relative to the ‘Control’ (Figure 10a). Significant (q = 0.042) separate clustering (β-diversity) of weighted ‘Biofortified’ and ‘Control’ microbial populations was observed (Figure 10b). The family Enterococcaceae (including an unspecified genus) was significantly more abundant and the genus Dorea was significantly less abundant in the ‘Biofortified’ relative to the ‘Control’ group. Microbial glycolysis/gluconeogenesis significantly increased and microbial tropane piperidine and pyridine alkaloid biosynthesis significantly decreased in the ‘Biofortified’ microbial populations relative to ‘Control’ (Figure 10c).
Here, we show for the first time that the benefits of consuming a biofortified diet include altered intestinal functionality, enteric microbiota, and feed energy conversion. Biofortified wheat consumption increased the abundance of Bifidobacterium and Lactobacillus in ‘Biofortified’ ceca relative to Clostridales (comprising Coprococcus Ruminococcus, Faecalibacterium, and the family Lachnospiraceae) and Escherchia (Figure 4), which is strikingly similar to the results obtaining following intraamniotic administration of NA-chelated Fe (Figure 2D) and provides further evidence that NA- and/or DMA-chelated Fe is highly bioavailable and does not persist in the intestinal lumen, where it can contribute to the proliferation of pathogenic bacteria [71,72]. The major phyla observed in this study, Firmicutes, Actinobacteria, and Proteobacteria, are shared between humans and chickens [73,74]. Typically, Firmicutes are the most abundant (70–80%) and Actinobacteria are the least abundant (~5%) phyla in humans and poultry, suggesting that the atypical microbial composition of both the ‘Control’ and ‘Biofortified’ groups (~20% and 38% Actinobacteria, respectively) was due to nutritional insufficiencies in both diets [61,62,63]. Bifidobacterium and Lactobacillus are major probiotic genera within Actinobacteria and Firmicutes, respectively, and both genera symbiotically harvest additional nutrients and energy from the diet for the host [75,76]. These probiotic populations likely inhabit the additional intestinal mucin secreted by increased goblet cells in ‘Biofortified’ chickens (Figure 4), which are both acidic and neutral and provide mucin with an appropriate chemical composition to support these populations [77]. We hypothesize that additional Bifidobacterium and Lactobacilli in the mucosal layer upregulate glycolysis/gluconeogenesis enzymes and increase the production of acetic, propionic, and valeric SCFAs, leading to improved host Fe absorption and carbohydrate metabolism in ‘Biofortified’ chickens relative to the ‘Control’ [78,79]. Improved metabolic capacity in ‘Biofortified’ chickens manifested as reduced cumulative FCR (consuming ~20% less for the same weight gain) and increased glycogen storage in both liver and pectoral tissues relative to the ‘Control’. Improved food energy conversion due to increased Bifidobacterium/Lactobacillus relative to Escherchia was observed following prebiotic supplementation in broiler chickens, suggesting that these effects may be due to NA and/or DMA acting as prebiotics in the biofortified diet. Administering extracts of biofortified white flour (containing NA and DMA) increased intestinal goblet cell number and villus surface in ‘B WF’ relative to ‘C WF’, suggesting that even short-term exposure to biofortified wheat positively affects intestinal morphology.

4. Conclusions

Overall, the data presented here indicate that a subject’s zinc physiological status and dietary zinc levels significantly affect and reshape the composition and function of the intestinal microbiome. Zn deficiency caused by insufficient dietary Zn leads to poor Zn physiological status and induces a decrease in gut microbial diversity and an outgrowth of bacteria particularly suited to low Zn conditions, leading to dysbiosis. Lack of dietary Zn also leads to alterations in the functional capacity of the microflora, causing multiple effects, including decreased expression of pathways related to mineral (i.e., Zn) absorption and carbohydrate digestion and fermentation. A decrease in the latter pathway may also cause a depression in the production of SCFAs, compounds responsible for improving the bioavailability of Zn. Altogether, these microbial effects may decrease Zn absorbability and disturb GI health, thereby perpetuating a Zn-deficient state. Red arrows and orange-lined boxes denote observations of this study, and dashed arrows and black-lined boxes describe published findings.

Conflicts of Interest

The authors declare no conflict of interest.

References

  1. Gaither, L.A.; Eide, D.J. Eukaryotic zinc transporters and their regulation. BioMetals 2001, 14, 251–270. [Google Scholar] [CrossRef] [PubMed]
  2. Berg, J.M.; Shi, Y. The galvanization of biology: A growing appreciation for the roles of zinc. Science 1996, 271, 1081–1085. [Google Scholar] [CrossRef] [PubMed]
  3. Solomons, N.W.; Jacob, R.A. Studies on the bioavailability of zinc in humans: Effects of heme and nonheme iron on the absorption of zinc. Am. J. Clin. Nutr. 1981, 34, 475–482. [Google Scholar] [CrossRef]
  4. King, J.C.; Cousins, R.J. Zinc. In Modern Nutrition in Health and Disease; Lippincott Williams & Wilkins Press: Alphen aan den Rijn, The Netherlands, 2006; pp. 271–528. [Google Scholar]
  5. Wintergerst, E.S.; Maggini, S.; Hornig, D.H. Contribution of selected vitamins and trace elements to immune function. Ann. Nutr. Metab. 2007, 51, 301–323. [Google Scholar] [CrossRef] [PubMed]
  6. Rink, L. Zinc and the immune system. Proc. Nutr. Soc. 2000, 59, 541–552. [Google Scholar] [CrossRef] [PubMed]
  7. Wessells, K.R.; Brown, K.H. Estimating the global prevalence of zinc deficiency: Results based on zinc availability in national food supplies and the prevalence of stunting. PLoS ONE 2012, 7, e50568. [Google Scholar] [CrossRef]
  8. Maret, W.; Sandstead, H.H. Zinc requirements and the risks and benefits of zinc supplementation. J. Trace Elem. Med. Biol. 2006, 20, 3–18. [Google Scholar] [CrossRef]
  9. Sandstead, H.H.; Smith, J.C., Jr. Deliberations and evaluations of approaches, endpoints and paradigms for determining zinc dietary recommendations. J. Nutr. 1996, 126, 2410S–2418S. [Google Scholar] [CrossRef]
  10. Gibson, R.S.; Hess, S.Y.; Hotz, C.; Brown, K.H. Indicators of zinc status at the population level: A review of the evidence. Br. J. Nutr. 2008, 99, S14–S23. [Google Scholar] [CrossRef]
  11. Lowe, N.M.; Fekete, K.; Decsi, T. Methods of assessment of zinc status in humans: A systematic review. Am. J. Clin. Nutr. 2009, 89, S2040–S2051. [Google Scholar] [CrossRef]
  12. Reed, S.; Qin, X.; Ran-Ressler, R.; Brenna, J.T.; Glahn, R.P.; Tako, E. Dietary zinc deficiency affects blood linoleic acid: Dihomo-ihlinolenic acid (LA:DGLA) ratio; a sensitive physiological marker of zinc status in vivo (Gallus gallus). Nutrients 2014, 6, 1164–1180. [Google Scholar] [CrossRef] [PubMed]
  13. Guyatt, G.H.; Oxman, A.D.; Ali, M.; Willan, A.; McIlroy, W.; Patterson, C. Laboratory diagnosis of iron-deficiency anemia: An overview. J. Gen. Intern. Med. 1992, 7, 145–153. [Google Scholar] [CrossRef] [PubMed]
  14. Brugnara, C. Iron deficiency and erythropoiesis: New diagnostic approaches. Clin. Chem. 2003, 49, 1573–1578. [Google Scholar] [CrossRef] [PubMed]
  15. Smith, J.C.; McDaniel, E.G.; McBean, L.D.; Doft, F.S.; Halstead, J.A. Effect of microorganisms upon zinc metabolism using germfree and conventional rats. J. Nutr. 1972, 102, 711–719. [Google Scholar] [CrossRef] [PubMed]
  16. Gielda, L.M.; DiRita, V.J. Zinc competition among the intestinal microbiota. mBio 2013, 3, e00171-12. [Google Scholar] [CrossRef]
  17. Vahjen, W.; Pieper, R.; Zentek, J. Increased dietary zinc oxide changes the bacterial core and enterobacterial composition in the ileum of piglets. J. Anim. Sci. 2001, 89, 2430–2439. [Google Scholar] [CrossRef]
  18. Pieper, R.; Vahjen, W.; Neumann, K.; VanKessel, A.G.; Zentek, J. Dose-dependent effects of dietary zinc oxide on bacterial communities and metabolic profiles in the ileum of weaned pigs. J. Anim. Physiol. Anim. Nutr. 2012, 96, 825–833. [Google Scholar] [CrossRef]
  19. Vahjen, W.; Pieper, R.; Zentek, J. Bar-Coded Pyrosequencing of 16S rRNA Gene Amplicons Reveals Changes in Ileal Porcine Bacterial Communities Due to High Dietary Zinc Intake. Appl. Environ. Microbiol. 2010, 76, 6689–6691. [Google Scholar] [CrossRef]
  20. Starke, I.C.; Pieper, R.; Neumann, K.; Zentek, J.; Vahjen, W. The impact of high dietary zinc oxide on the development of the intestinal microbiota in weaned piglets. FEMS Microbiol. Ecol. 2014, 87, 416–427. [Google Scholar] [CrossRef]
  21. Hojberg, O.; Canibe, N.; Poulsen, D.; Hedemann, M.S.; Jensen, B.B. Influence of dietary zinc oxide and copper sulfate on the gastrointestinal ecosystem in newly weaned pigs. Appl. Environ. Microbiol. 2005, 71, 2267–2277. [Google Scholar] [CrossRef]
  22. Broom, L.J.; Miller, H.M.; Kerr, K.G.; Knapp, J.S. Effects of zinc oxide and Enterococcus faecium SF68 dietary supplementation on the performance, intestinal microbiota and immune system of weaned piglets. Res. Vet. Sci. 2006, 80, 45–54. [Google Scholar] [CrossRef] [PubMed]
  23. Crane, J.K.; Naeher, T.M.; Shulgina, I.; Zhu, C.; Boedeker, E.C. Effect of zinc in enteropathogenic Escherichia coli infection. Infect. Immun. 2007, 75, 5974–5984. [Google Scholar] [CrossRef] [PubMed]
  24. Sturniolo, G.C.; di Leo, V.; Ferronato, A.; D’Odorico, A.; D’Inca, R. Zinc supplementation tightens leaky gut in Crohn’s disease. Inflamm. Bowel Dis. 2001, 7, 94–98. [Google Scholar] [CrossRef] [PubMed]
  25. Salgueiro, M.J.; Zubillaga, M.; Lysionek, A.; Sarabia, M.I.; Caro, R.; de Paoli, T.; Hager, A.; Weill, R.; Boccio, J. Zinc as an essential micronutrient: A review. Nutr. Res. 2000, 20, 737–755. [Google Scholar] [CrossRef]
  26. Bhutta, Z.A.; Darmstadt, G.L.; Hasan, B.S.; Haws, R.A. Community-based interventions for improving perinatal and neonatal health outcomes in developing countries: A review of the evidence. Pediatrics 2005, 115, 519–617. [Google Scholar] [CrossRef]
  27. Reed, S.; Neuman, H.; Moscovich, S.; Glahn, R.P.; Koren, O.; Tako, E. Chronic Zinc Deficiency Alters Chick Gut Microbiota Composition and Function. Nutrients 2015, 7, 9768–9784. [Google Scholar] [CrossRef]
  28. Reed, S.; Knez, M.; Uzan, A.; Stangoulis, J.C.R.; Glahn, R.P.; Koren, O.; Tako, E. Alterations in the Gut (Gallus gallus) Microbiota Following the Consumption of Zinc Biofortified Wheat (Triticum aestivum)-Based Diet. J. Agric. Food Chem. 2018, 66, 6291–6299. [Google Scholar] [CrossRef]
  29. Beasley, J.T.; Johnson, A.A.T.; Kolba, N.; Bonneau, J.P.; Glahn, R.P.; Ozeri, L.; Koren, O.; Tako, E. Nicotianamine-chelated iron positively affects iron status, intestinal morphology and microbial populations in vivo (Gallus gallus). Sci. Rep. 2020, 10, 2297. [Google Scholar] [CrossRef]
  30. Mead, G.C. Bacteria in the gastrointestinal tract of birds. Gastrointest. Microbiol. 1997, 2, 216–240. [Google Scholar]
  31. Lan, P.T.; Hayashi, H.; Sakamoto, M.; Benno, Y. Phylogenetic analysis of cecal microbiota in chicken by the use of 16S rDNA clone libraries. Microbiol. Immunol. 2002, 46, 371–382. [Google Scholar] [CrossRef]
  32. Wei, S.; Morrison, M.; Yu, Z. Bacterial census of poultry microbiome. Poult. Sci. 2013, 92, 671–683. [Google Scholar] [CrossRef] [PubMed]
  33. Kasaikina, M.V.; Kravtsova, M.A.; Lee, B.C.; Seravalli, J.; Peterson, D.A.; Walter, J.; Legge, R.; Benson, A.K.; Hatfield, D.L.; Gladyshev, V.N. Dietary selenium affects host selenoproteome expression by influencing the gut microbiota. FASEB J. 2011, 25, 2492–2499. [Google Scholar] [CrossRef] [PubMed]
  34. Manichanh, C.; Rigottier-Gois, L.; Bannaud, E.; Gloux, K.; Pelletier, E.; Frangeul, L.; Nalin, R.; Jarrin, C.; Chardon, P.; Marteau, P.; et al. Reduced diversity of faecal microbiota in Crohn’s disease revealed by a metagenomic approach. Gut 2006, 55, 205–211. [Google Scholar] [CrossRef]
  35. Ott, S.J.; Musfeldt, M.; Wenderoth, D.F.; Hampe, J.; Brant, O.; Folsch, U.R.; Timmis, K.N.; Schreiber, S. Reduction in diversity of the colonic mucosa associated bacterial microflora in patients with active inflammatory bowel disease. Gut 2004, 53, 685–693. [Google Scholar] [CrossRef]
  36. Perez-Cobas, A.E.; Artacho, A.; Ott, S.J.; Moya, A.; Gosalbes, M.J.; Latorre, A. Structural and functional changes in the gut microbiota associated to Clostridium difficile infection. Front. Microbiol. 2014, 5, 335. [Google Scholar]
  37. Giongo, A.; Gano, K.A.; Crabb, D.B.; Mukherjee, N.; Novelo, L.L.; Casella, G.; Drew, J.C.; Ilonen, J.; Knip, M.; Hyöty, H.; et al. Toward defining the autoimmune microbiome for type 1 diabetes. ISME J. 2011, 5, 82–91. [Google Scholar] [CrossRef]
  38. Turnbaugh, P.J.; Hamady, M.; Yatsunenko, T.; Cantarel, B.L.; Duncan, A.; Ley, R.E.; Sogin, M.L.; Jones, W.J.; Roe, B.A.; Affourtit, J.P.; et al. A core gut microbiome in obese and lean twins. Nature 2009, 457, 480–484. [Google Scholar] [CrossRef]
  39. Erb-Downward, J.R.; Thompson, D.L.; Han, M.K.; Freeman, C.M.; McCloskey, L.; Schmidt, L.A.; Young, V.B.; Toews, G.B.; Curtis, J.L.; Sundaram, B.; et al. Analysis of the lung microbiome in the “healthy” smoker and in COPD. PLoS ONE 2011, 6, e16384. [Google Scholar] [CrossRef]
  40. Osendarp, S.; van Raaji, J.M.; Darmstadt, G.L.; Baqui, A.H.; Hautvast, J.G.; Fuchs, G.J. Zinc supplementation during pregnancy and effects on growth and morbidity in low birthweight infants: A randomised placebo controlled trial. Lancet 2001, 357, 1080–1085. [Google Scholar] [CrossRef]
  41. Caulfield, L.; Black, R.E. Zinc deficiency. In Comparative Quantification of Health Risks: Global and Regional Burden of Disease Attributable to Selected Major Risk Factors; Ezzati, M., Lopez, A.D., Rodgers, A., Murray, C.L.J., Eds.; World Health Organization: Geneva, Switzerland, 2004; Volume 1, pp. 257–279. [Google Scholar]
  42. Rossi, L.; Migliaccio, S.; Corsi, A.; Marzia, M.; Bianco, P.; Teti, A.; Gambelli, L.; Cianfarani, S.; Paoletti, F.; Branca, F. Reduced growth and skeletal changes in zinc-deficient growing rats are due to impaired growth plate activity and inanition. J. Nutr. 2001, 131, 1142–1146. [Google Scholar] [CrossRef] [PubMed]
  43. Ley, R.E.; Backhed, F.; Turnbaugh, P.; Lozupone, C.A.; Knight, R.D.; Gordon, J.I. Obesity alters gut microbial ecology. Proc. Natl. Acad. Sci. USA 2005, 102, 11070–11075. [Google Scholar] [CrossRef] [PubMed]
  44. Greenblum, S.; Turnbaugh, P.J.; Borenstein, E. Metagenomic systems biology of the human gut microbiome reveals topological shifts associated with obesity and inflammatory bowel disease. Proc. Natl. Acad. Sci. USA 2001, 109, 594–599. [Google Scholar] [CrossRef]
  45. Langille, M.G.; Zaneveld, J.; Caporaso, J.G.; McDonald, D.; Knights, D.; Reyes, J.A.; Clemente, J.C.; Burkepile, D.E.; Vega Thurber, R.L.; Knight, R.; et al. Predictive functional profiling of microbial communities using 16S rRNA marker gene sequences. Nat. Biotechnol. 2013, 31, 814–821. [Google Scholar] [CrossRef] [PubMed]
  46. Sanchez Garcia, J.; Ciufo, L.F.; Yang, X.; Kearsey, S.E.; MacNeill, S.A. The C-terminal zinc finger of the catalytic subunit of DNA polymerase delta is responsible for direct interaction with the B-subunit. Nucleic Acids Res. 2004, 32, 30005–30016. [Google Scholar] [CrossRef] [PubMed]
  47. Ho, E.; Ames, B.N. Low intracellular zinc induces oxidative DNA damage, disrupts p53, NFκB, and AP1 DNA binding, and affects DNA repair in a rat glioma cell line. Proc. Natl. Acad. Sci. USA 2002, 99, 16770–16775. [Google Scholar] [CrossRef]
  48. Cummings, J.H. Short chain fatty acids in the human colon. Gut 1981, 22, 763–779. [Google Scholar] [CrossRef]
  49. Topping, D.L.; Clifton, P.M. Short-chain fatty acids and human colonic function: Roles of resistant starch and nonstarch polysaccharides. Physiol. Rev. 2001, 81, 1031–1064. [Google Scholar] [CrossRef]
  50. Levrat, M.A.; Remesy, C.; Demigne, C. High propionic acid fermentations and mineral accumulation in the cecum of rats adapted to different levels of inulin. J. Nutr. 1991, 121, 1730–1737. [Google Scholar] [CrossRef]
  51. Coudray, C.; Feillet-Coudray, C.; Gueux, E.; Mazur, A.; Rayssiguier, Y. Dietary Inulin Intake and Age Can Affect Intestinal Absorption of Zinc and Copper in Rats. J. Nutr. 2006, 136, 117–122. [Google Scholar] [CrossRef]
  52. Wapnir, R.A. Zinc Deficiency, Malnutrition and the Gastrointestinal Tract. J. Nutr. 2000, 130, 1388S–1092S. [Google Scholar] [CrossRef]
  53. Rodriguez, P.; Darmon, N.; Chappuis, P.; Candalh, C.; Blaton, M.A.; Bouchaud, C.; Heyman, M. Intestinal paracellular permeability during malnu-trition in guinea pigs: Effect of high dietary zinc. Gut 1996, 39, 416–442. [Google Scholar] [CrossRef]
  54. Eckburg, P.B.; Bik, E.M.; Bernstein, C.N.; Purdom, E.; Dethlefsen, L.; Sargent, M.; Gill, S.R.; Nelson, K.E.; Relman, D.A. Diversity of the human intestinal microbial flora. Science 2005, 308, 1635–1638. [Google Scholar] [CrossRef] [PubMed]
  55. Cousins, R.J.; Liuzzi, J.P.; Lichten, L.A. Mammalian zinc transport, trafficking, and signals. J. Biol. Chem. 2006, 281, 24085–24089. [Google Scholar] [CrossRef] [PubMed]
  56. Kirschke, C.P.; Huang, L. ZnT7, a novel mammalian zinc transporter, accumulates zinc in the Golgi apparatus. J. Biol. Chem. 2003, 278, 4096–4102. [Google Scholar] [CrossRef] [PubMed]
  57. Cragg, R.A.; Christie, G.R.; Phillips, S.R.; Russi, R.M.; Küry, S.; Mathers, J.C.; Taylor, P.M.; Ford, D. A novel zinc-regulated human zinc transporter, hZTL1, is localized to the enterocyte apical membrane. J. Biol. Chem. 2002, 277, 22789–22797. [Google Scholar] [CrossRef]
  58. Lichten, L.A.; Cousins, R.J. Mammalian zinc transporters: Nutritional and physiologic regulation. Annu. Rev. Nutr. 2009, 29, 153–176. [Google Scholar] [CrossRef]
  59. Yu, T.; Zhu, C.; Chen, S.; Gao, L.; Lv, H.; Feng, R.; Zhu, Q.; Xu, J.; Chen, Z.; Jiang, Z. Dietary High Zinc Oxide Modulates the Microbiome of Ileum and Colon in Weaned Piglets. Front. Microbiol. 2017, 8, 825. [Google Scholar] [CrossRef]
  60. Segata, N.; Izard, J.; Waldron, L.; Gevers, D.; Miropolsky, L.; Garrett, W.S.; Huttenhower, C. Metagenomic biomarker discovery and explanation. Genome Biol. 2011, 12, R60. [Google Scholar] [CrossRef]
  61. Ze, X.; Duncan, S.H.; Louis, P.; Flint, H.J. Ruminococcus bromii is a keystone species for the degradation of resistant starch in the human colon. ISME J. 2012, 6, 1535–1543. [Google Scholar] [CrossRef]
  62. Edens, F.W.; Parkhurst, C.R.; Casas, I.A.; Dobrogosz, W.J. Principles of ex ovo competitive exclusion and in ovo administration of Lactobacillus reuteri. Poult. Sci. 1997, 76, 179–196. [Google Scholar] [CrossRef]
  63. Roselli, M.; Finamore, A.; Garaguso, I.; Britti, M.S.; Mengheri, E. Zinc oxide protects cultured enterocytes from the damage induced by Escherichia coli. J. Nutr. 2003, 133, 4077–4082. [Google Scholar] [CrossRef] [PubMed]
  64. Mengheri, E.; Nobili, F.; Vignolini, F.; Pesenti, M.; Brandi, G.; Biavati, B. Bifidobacterium animalis protects intestine from damage induced by zinc deficiency in rats. J. Nutr. 1999, 129, 2251–2257. [Google Scholar] [CrossRef] [PubMed]
  65. Spees, A.M.; Lopez, C.A.; Kingsbury, D.D.; Winter, S.E.; Bäumler, A.J. Colonization resistance: Battle of the bugs or Ménage à Trois with the host? PLoS Pathog. 2013, 9, e1003730. [Google Scholar] [CrossRef] [PubMed]
  66. Derrien, M.; Collado, M.C.; Ben-Amor, K.; Salminen, S.; de Vos, W.M. The Mucin degrader Akkermansia muciniphila is an abundant resident of the human intestinal tract. Appl. Environ. Microbiol. 2008, 74, 1646–1648. [Google Scholar] [CrossRef]
  67. Roca-Saavedra, P.; Mendez-Vilabrille, V.; Miranda, J.M.; Nebot, C.; Cardelle-Cobas, A.; Franco, C.M.; Cepeda, A. Food additives, contaminants and other minor components: Effects on human gut microbiota—A review. J. Physiol. Biochem. 2018, 74, 69–83. [Google Scholar] [CrossRef] [PubMed]
  68. Mayneris-Perxachs, J.; Bolick, D.T.; Leng, J.; Medlock, G.L.; Kolling, G.L.; Papin, J.A.; Swann, J.R.; Guerrant, R.L. Protein- and zinc-deficient diets modulate the murine microbiome and metabolic phenotype. Am. J. Clin. Nutr. 2016, 104, 1253–1262. [Google Scholar] [CrossRef] [PubMed]
  69. Derrien, M.; Belzer, C.; de Vos, W.M. Akkermansia muciniphila and its role in regulating host functions. Microb. Pathog. 2017, 106, 171–181. [Google Scholar] [CrossRef]
  70. Nakjang, S.; Ndeh, D.A.; Wipat, A.; Bolam, D.N.; Hirt, R.P. A novel extracellular metallopeptidase domain shared by animal host-associated mutualistic and pathogenic microbes. PLoS ONE 2012, 7, e30287. [Google Scholar] [CrossRef]
  71. Kortman, G.A.M.; Boleij, A.; Swinkels, D.W.; Tjalsma, H. Iron availability increases the pathogenic potential of Salmonella typhimurium and other enteric pathogens at the intestinal epithelial interface. PLoS ONE 2012, 7, 1–7. [Google Scholar] [CrossRef]
  72. Ho, T.D.; Ellermeier, C.D. Ferric Uptake Regulator Fur Control of Putative Iron Acquisition Systems in Clostridium difficile. J. Bacteriol. 2015, 197, 2930–2940. [Google Scholar] [CrossRef]
  73. Reed, S.; Neuman, H.; Glahn, R.P.; Koren, O.; Tako, E. Characterizing the gut (Gallus gallus) microbiota following the consumption of an iron biofortified Rwandan cream seeded carioca (Phaseolus vulgaris L.) bean-based diet. PLoS ONE 2017, 12, e0182431. [Google Scholar] [CrossRef] [PubMed]
  74. Qin, J.; Li, R.; Raes, J.; Arumugam, M.; Burgdorf, K.S.; Manichanh, C.; Nielsen, T.; Pons, N.; Levenez, F.; Yamada, T.; et al. A human gut microbial gene catalogue established by metagenomic sequencing. Nature 2010, 464, 59–65. [Google Scholar] [CrossRef] [PubMed]
  75. Turnbaugh, P.J.; Ley, R.E.; Mahowald, M.A.; Magrini, V.; Mardis, E.R.; Jeffrey, I. An obesity-associated gut microbiome with increased capacity for energy harvest. Nature 2006, 444, 1027–1031. [Google Scholar] [CrossRef] [PubMed]
  76. Vaughan, E.E.; Heilig, H.G.H.J.; Ben-Amor, K.; De Vos, W.M. Diversity, vitality and activities of intestinal lactic acid bacteria and bifidobacteria assessed by molecular approaches. FEMS Microbiol. Rev. 2005, 29, 477–490. [Google Scholar] [CrossRef]
  77. Forder, R.E.A.; Howarth, G.S.; Tivey, D.R.; Hughes, R.J. Bacterial modulation of small intestinal goblet cells and mucin composition during early posthatch development of poultry. Poult. Sci. 2007, 86, 2396–2403. [Google Scholar] [CrossRef]
  78. Oakley, B.B.; Lillehoj, H.S.; Kogut, M.H.; Kim, W.K.; Maurer, J.J.; Pedroso, A.; Lee, M.D.; Collett, S.R.; Johnson, T.J.; Cox, N.A. The chicken gastrointestinal microbiome. FEMS Microbiol. Lett. 2014, 360, 100–112. [Google Scholar] [CrossRef]
  79. Józefiak, D.; Rutkowski, A.; Martin, S.A. Carbohydrate fermentation in the avian ceca: A review. Anim. Feed Sci. Technol. 2004, 113, 1–15. [Google Scholar] [CrossRef]
Figure 1. Microbial diversity of the cecal microbiome. (A) Measures of α-diversity using the Chao1 index [36], and (B) total number of observed species. * p < 0.05, ** p < 0.01, analysis of variance (ANOVA); n = 10 in Zn(+), n = 9 in Zn(−). (C) Measure of β-diversity using weighted UniFrac distances separated by the first three principal components (PCs). Each dot represents one animal, and the colors represent the different treatment groups.
Proceedings 61 00016 g001
Figure 2. Phylum- and genera-level cecal microbiota shifts due to dietary Zn depletion. (A) Phylum-level changes between the Zn(+) and Zn(−) groups as measured at the end of the study (day 28). Only those phyla with abundance > 1% are shown. (B) Increased Firmicutes to Bacteroidetes and Proteobacteria ratios in the Zn(+) group (* p < 0.05, NS = not statistically significant). (C) Inverse correlation between Proteobacteria abundance and bodyweight. (D) Genus-level changes in the Zn(+) and Zn(−) group as measured at the end of the study (day 28). Only genera that were significantly different between groups are shown.
Proceedings 61 00016 g002
Figure 3. Heat map describing a set of Spearman correlations, independently of treatment group, between the relative abundance of different operational taxonomic units (OTUs) and select biological indicators of Zn status. The color indicator ranges from a perfect negative correlation (−1, blue) to a perfect positive correlation (1, red) (* p < 0.05, ** p < 0.01, ANOVA).
Proceedings 61 00016 g003
Figure 4. The functional capacity of the cecal microbiota is perturbed under conditions of Zn deficiency. (A) Fold-change depletion of these pathways in the Zn(−) group (all p < 0.01, Student’s t–test). (B) Relative abundance of differentially expressed Kyoto Encyclopedia of Genes and Genomes (KEGG) microbial metabolic pathways in cecal microbiota. Treatment groups are indicated by the different colors (all p < 0.05, ANOVA).
Proceedings 61 00016 g004
Figure 5. Microbial diversity of the cecal microbiome. (a) Measure of α-diversity using the Chao1 index and (b) α-diversity using the Observed Species Index. (c) Measure of β-diversity using the unweighted UniFrac distances separated by the first three principal components (PCoA). Each dot represents one animal, and the colors represent the different treatment groups.
Proceedings 61 00016 g005
Figure 6. Compositional changes of gut microbiota in response to a biofortified diet. (a) Phylum-level changes in the control wheat-based diet (CZn) and Zn-biofortified wheat-based diet (BZn) groups as measured at the end of the study (day 42). Only phyla with abundance ≥1% are displayed. (b) Genus-level changes in the CZn and BZn groups as measured at the end of the study (day 42). Only genera with abundance ≥5% are displayed.
Proceedings 61 00016 g006
Figure 7. The linear discriminant analysis effect size (LEfSe) method to identify the most differentially enriched taxa in the BZn and CZn groups. (a) Taxonomic cladogram obtained using LEfSe analysis of the 16S rRNA sequences. Treatment groups are indicated by the different colors, where the brightness of each dot is proportional to its effect size. (b) Computed linear discriminant analysis (LDA) scores of the relative abundance difference between the CZn and BZn groups. Negative LDA scores (red) are enriched in the CZn group, while positive LDA scores (green) are enriched in the BZn group.
Proceedings 61 00016 g007
Figure 8. The functional capacity of the gut microbiota is altered with a Zn-biofortified diet: relative abundance of differentially enriched KEGG microbial metabolic pathways in the microbiota. Treatment groups are indicated by the different colors, and p-values are displayed on the y-axis.
Proceedings 61 00016 g008
Figure 9. Intestinal functionality, short-chain fatty acid production, and cecal microbial composition following consumption of experimental diets. (a) Chicken intestinal goblet cell number and diameter (µm). (b) Chicken intestinal villus length and width (µm). (c) Cecal short-chain fatty acid (SCFA) composition. Bars represent the mean ± SEM of nine biological replicates. Relative abundance of microbial populations at the levels of (d) phyla and (e) families and genera. Asterisks denote significant differences for * p < 0.05 and *** p ≤ 0.001 as determined by Student’s t-test. AU: arbitrary units.
Proceedings 61 00016 g009
Figure 10. Microbial diversity and metabolic capacity following consumption of experimental diets. (a) Microbial α-diversity of chicken ceca using Faith’s phylogenetic diversity (PD). (b) Microbial β-diversity of chicken ceca using unweighted UniFrac distances separated by three principal components (PCs). Each dot represents either a ‘Control’ (green) or ‘Biofortified’ (red) chicken. (c) Computed linear discriminant analysis (LDA) scores of differences in relative microbial abundance and metabolic capacity, respectively. Positive LDA scores (green) are enriched in ‘Control’ and negative LDA scores (red) are enriched in ‘Biofortified’. Asterisks denote significant differences for * p < 0.05 as determined by a Kruskal–Wallis test.
Proceedings 61 00016 g010
Publisher’s Note: MDPI stays neutral with regard to jurisdictional claims in published maps and institutional affiliations.

