Proceeding Paper

Indication of the Coronavirus Model Using a Nanowire Biosensor †

1
Federal State Research Institution State Research Center of Virology and Biotechnology “Vector”, 630559 Koltsovo, Russia
2
Rzhanov Institute of Semiconductor Physics, Siberian Branch of the Russian Academy of Sciences, 630090 Novosibirsk, Russia
*
Author to whom correspondence should be addressed.
Presented at the 1st International Electronic Conference on Biosensors, 2–17 November 2020; Available online: https://iecb2020.sciforum.net/.
Proceedings 2020, 60(1), 50; https://doi.org/10.3390/IECB2020-07228
Published: 5 November 2020
(This article belongs to the Proceedings of The 1st International Electronic Conference on Biosensors)

Abstract

:
The presented results indicate virus-like particles of the coronavirus (CVP) using a nanowire (NW) biosensor based on silicon-on-insulator technology. In the experiment, we used suspensions of CVP and of specific antibodies to the virus. Measurements of the current value of the field-effect transistor before and after the introduction of the CVP on the surface of the nanowire were performed. Results showed antibody + CVP complexes on the phase section with the surface of the nanowire modulate the current of the field-effect transistor; CVP has an electrically positive charge on the phase section “nanowire surface-viral suspension»; antibody + CVP complexes have an electrically negative charge on the phase section “nanowire surface-viral suspension”; the sensitivity of the biosensor is made up of 10−18 M; the time display was 200–300 s.

1. Introduction

In early 2020, the World Health Organization announced an outbreak of coronavirus infection 2019-nCoV, which was first reported on 31 December 2019 in Wuhan, China, but on 11 March, given the rapid increase in the number of cases worldwide, it was characterized as the COVID-19 coronavirus pandemic [1]. The COVID-19 pandemic has been accompanied by profound changes in everyday life; countries are experiencing economic downturns, and many traditional social, economic, and public health systems are under unprecedented strain. The health and social protection systems were shocked. The measures taken to control transmission of the virus have had extensive and profound socioeconomic consequences [2].
Coronaviruses (Cov) are a large family of RNA-containing viruses that cause illness from the common cold to more serious diseases such as Middle East respiratory syndrome (MERS-Cov) and severe acute respiratory syndrome (SARS-Cov). A new coronavirus (nCoV) is a strain not previously detected in humans [3]. Researchers note the most characteristic symptoms of the disease—fatigue, shortness of breath, headaches, fever, kidney failure, dry cough, bronchitis—but sometimes register specific pneumonia of the lungs, including with a fatal outcome. Currently, information about the clinical prevention and treatment of this disease is still limited [3,4,5]. At the time of writing, there were no WHO-recommended medicines or vaccines designed to prevent or treat infection caused by the new coronavirus (2019-nCoV). At the same time, both in Russia and abroad, vaccines against coronavirus are being developed [6]. Other factors of containment of the coronavirus that the WHO notes are laboratory diagnostics. The most common method of laboratory diagnostics for 2019-nCoV is polymerase chain reaction (PCR). For this, the main type of biomaterial is a smear from the nasopharynx and/or mouth. In Russia, diagnostics are performed using test systems that have a Roszdravnadzor registration certificate and are approved for use in laboratories in the Russian Federation [6]. The method of PCR analysis gives a direct indication of the presence of a specific section of the pathogen’s DNA in the material taken from the patient. Another effective method of ELISA diagnosis is based on specific binding of antigens and antibodies in the sample with further detection of their enzyme label [7].
The development of new more sensitive and rapid methods of virus indication and the study of the fundamental properties of virus-like coronavirus particles is an urgent problem in the treatment of epidemics and pandemics. The aim of this work is to indicate the virus of similar coronavirus particles using a KNI-NP transistor and study its properties as a particle.

2. Materials and Methods

The following materials and equipment were used in the research.
N-channel silicon nanowire field-effect transistors (Si-NW FET) were used as biosensors [8]. Schematic and optical images of the n-channel SI-NW FET biosensor obtained using an atomic force microscope (AFM) are shown Figure 1a–c. The thickness of the silicon layer (Si) was 28–30 nm, the thickness of the hidden dielectric (BOX, buried oxide) was 200 nm. The channel width of the sensor element of the transistor located between the contact areas of the source S and the drain D was W = 3 microns, the length L = 10 microns (Figure 1a). During measurements, the voltage between the drain and the source of the transistor was Vds = 0.15 V. The structure BG gate was used as the second controlling electrode. It provided modulation of the electronic channel conductivity and selection of the transistor operating point mode in the Ids sub-threshold region (Vbg). A grounded reference platinum Pt electrode (RE) was inserted directly before measurements into a drop of viral suspension, which removed the possibility of an undesirable induced constant electric charge of the viral suspension.
The experiments used CVP based on vesicular stomatitis virus that was not capable of replication. The CVP was modified by the s surface protein of the SARS-CoV-2 coronavirus. The remaining virion-forming proteins are represented by vesicular stomatitis virus proteins and genomic RNA defective in the g VSV coding region. The initial concentration of HPV in the viral suspension was 1010 particles/mL. In experimental samples, the amount of HPV was varied in the range from 10−18 to 10−13 M.
Specific antibodies to CVP were obtained based on the m396 antibody interacting with SARS [9]. To increase the affinity of antibodies to SARS-CoV-2, its structure was changed; L (leucine) in position 54 was replaced by V (valine).
Immediately before the experiment, the initial suspensions of antibodies and HPV were diluted with distilled water. Dilution was carried out, among other things, in order to create a suspension that did not conduct electric current. The high conductivity of the suspensions causes the transistors to be inoperable. All the biological material used in the work and samples based on them were prepared in the Federal state research center of Virology and biotechnology “vector” of Rospotrebnadzor.
Ethanol 96%, Kemerovo pharmaceutical factory, Kemerovo, Russia,
(3-Aminopropyl) triethoxysilane (APTES), Sigma-Aldrich, MO, USA,
25% ethanol solution of APTES.
Immediately before the experiment, the initial suspensions of antibodies and CVP were diluted with distilled water one hundred times. Dilution was carried out in order to create a non-conducting electric current suspension. The high conductivity of suspensions makes transistors inoperable.
Automatic pipette 1–2 mL and 10–100 mL, Russia.
Atomic force microscope AFM SOLVER P47BIO NT-MDT, Russia.
The surface of the Si-NW FET was divided into two parts to obtain two independent indicator transistors. The first transistor was called experimental, the second control. Sample preparation of the first experimental transistor was carried out in the following technological cycle.
  • The procedure for cleaning the surface of the Si-NW FET was carried out as follows:
    -
    96% ethanol solution with a volume of V = 10 µL was applied and removed with a pipette from the surface of the SI-NW FET 20–30 times, then the surface was washed with distilled water according to the same scheme. The procedure was repeated 3 times. Afterwards the SI-NW FET was totally dried.
  • The cleaned and dried surface of the SI-NW FET was modified by 25% ethanol solution APTES with a volume of V = 5–10 µL. The SI-NW FET was placed in a Petri dish and covered with a lid. A 25% ethanol solution of APTES was previously added to the Petri dish to create the vapors of the specified analyte. The SI-NW FET was in the specified pairs for 5 h, at T = 20 °C. The fill level of the analyte did not exceed the surface height of the SI-NW FET.
  • After 5 h, the surface of the SI-NW FET was washed with distilled water. The procedure was repeated 3 times. Afterwards the SI-NW FET was totally dried.
  • A suspension of diluted antibodies with a volume of V = 5–10 µL was applied to the dry surface of the SI-NW FET. Then the SI-NW FET was placed in a Petri dish with water. The cup was covered with a lid and placed in the refrigerator. SI-NW FET was in the specified water vapor for 2 h, at T = 4 °C. The water fill level did not exceed the surface height of the SI-NW FET. The antibodies were chemically bound to APTES and held on the surface.
  • After 2 h, antibodies were removed from the surface of the SI-NW FET that did not bind to it. The surface was washed with distilled water using a pipette. V = 10 µL of distilled water was applied and removed 20–30 times from the surface of the SI-NW FET. The procedure was repeated 3 times. Next, the surface of the SI-NW FET was dried. Drying was carried out in closed Petri dishes.
  • After this first part, the experimental SI-NW FET as the biosensor was ready for use.
Sample preparation of the second part of SI-NW FET surface differed from the first only in that antibodies were not applied to the surface of the second SI-NW FET.
After completion of all sample preparation procedures, specific antibodies to CVP were found on the surface of the first part of the biosensor, and APTES was found on the surface of the second part.
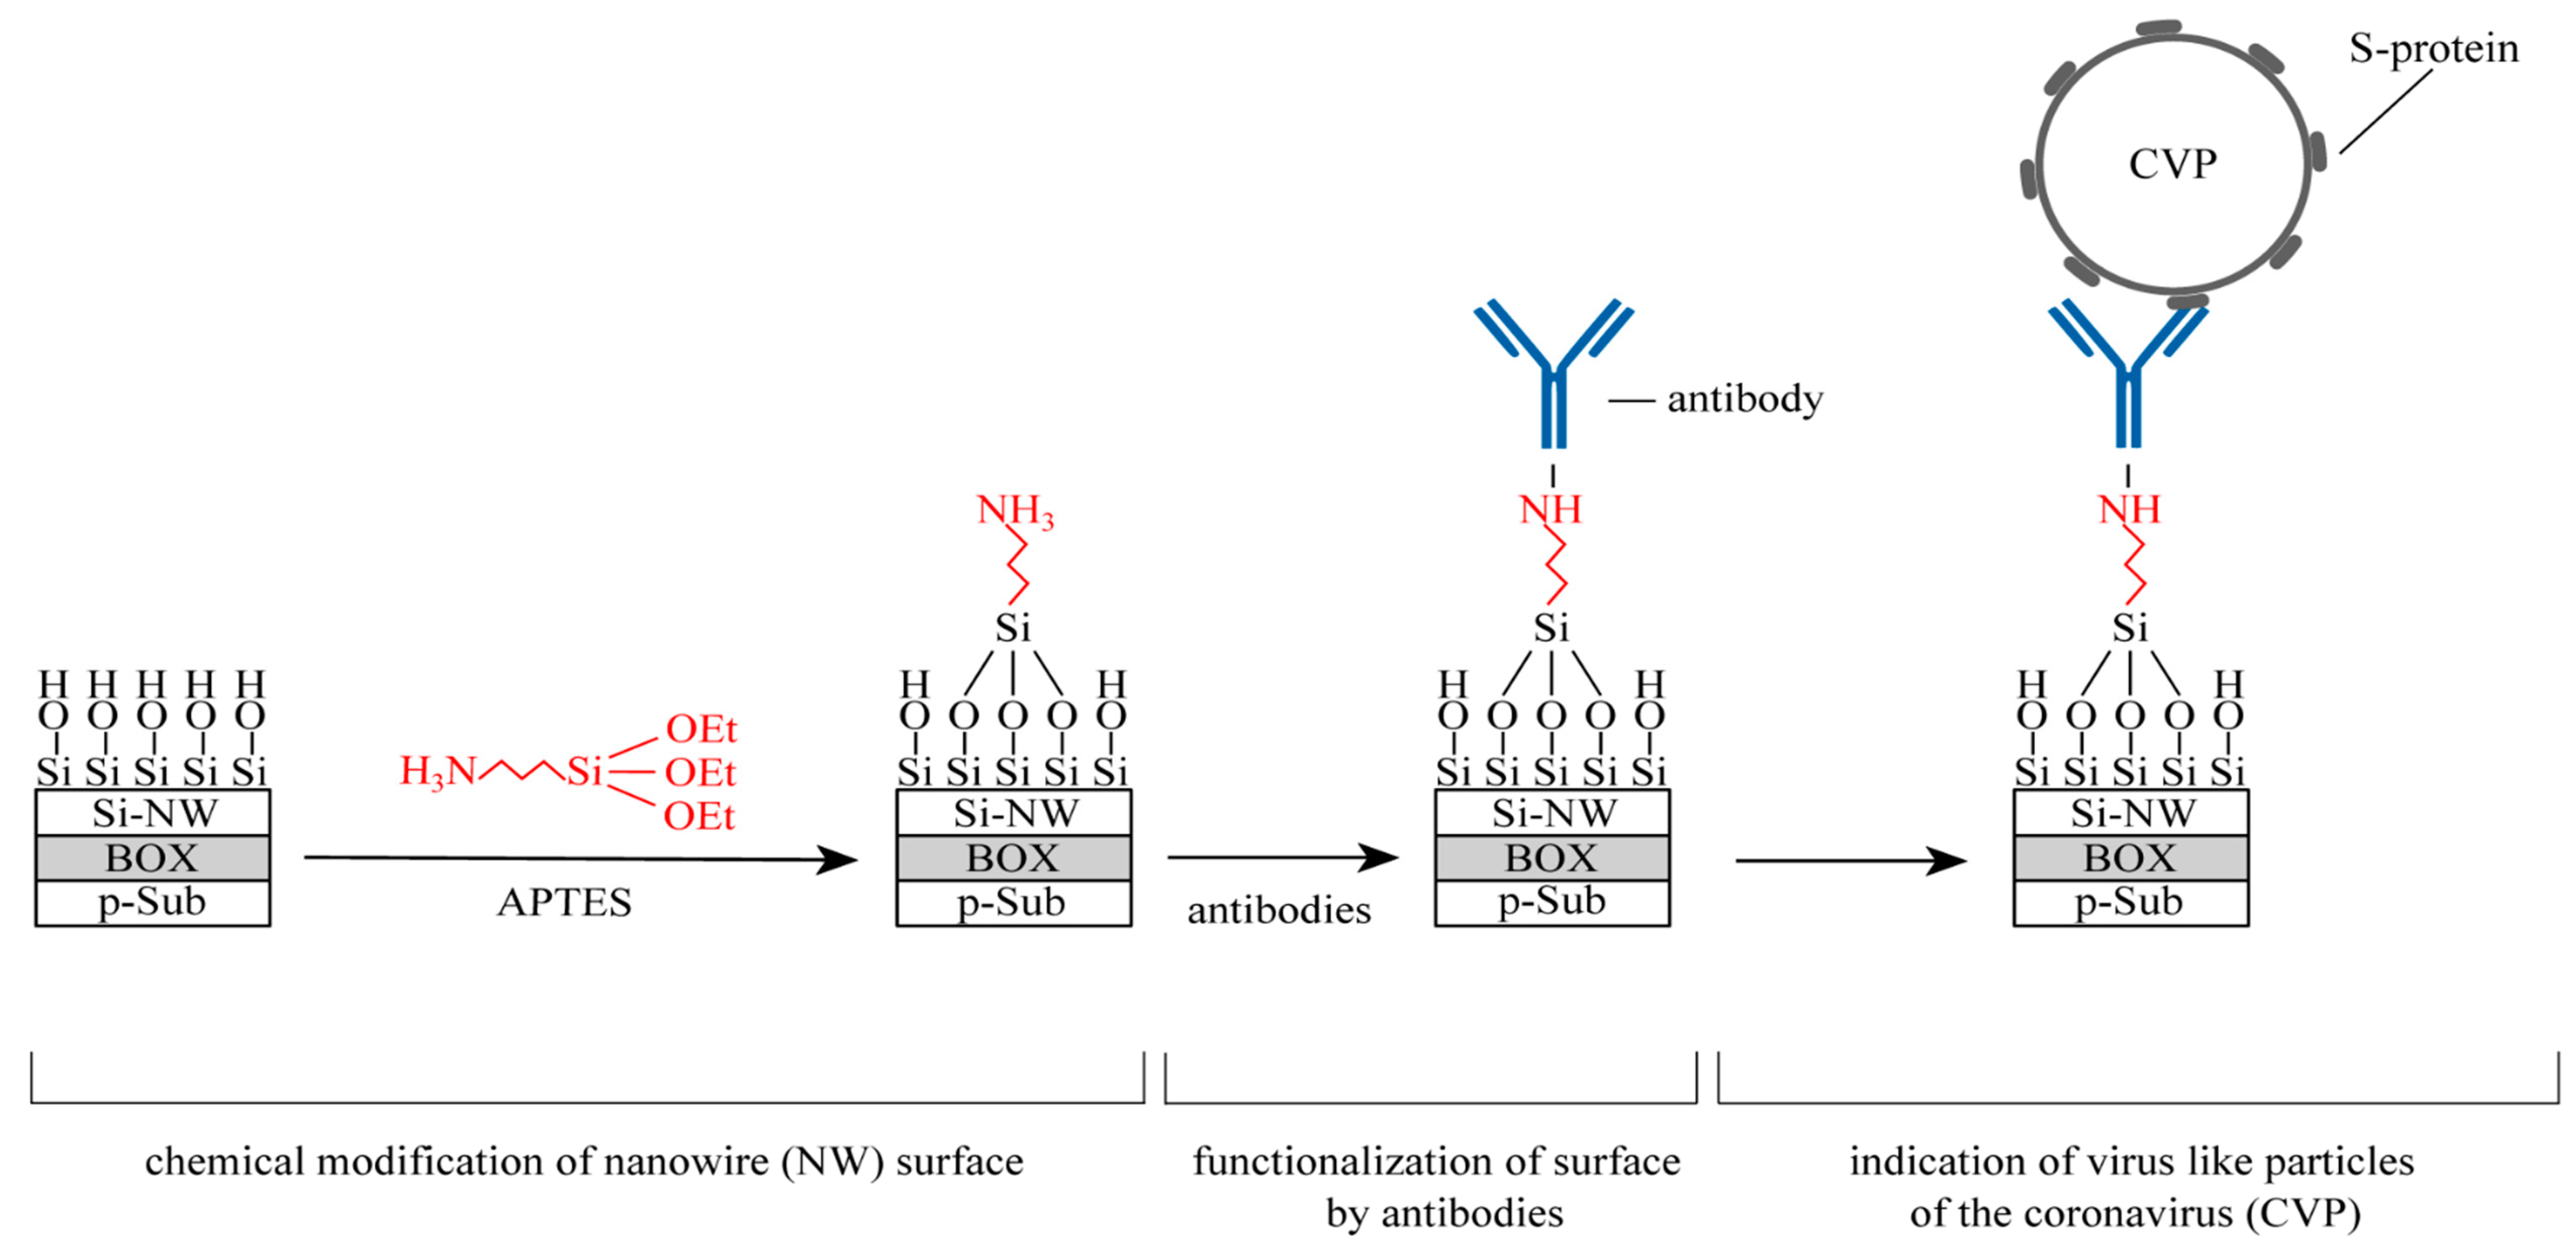
Using atomic force microscopy (AFM) at the stages of sample preparation, the surface of the SI-NW FET was monitored, as shown in Figure 2a,b. Chemical modification and functionalization of the nanowire by antibodies to virus-like coronavirus particles is shown Figure 3.
During the experiment, a 1-mL viral suspension of CVP was applied to the surface of the biosensor by a pipette, so that it covered the experimental and control parts transistor (modified with antibodies and APTES).
Indication of the CVP by biosensor was carried out by measuring the current in the source-drain circuit of the experimental and control transistors in real time. The control was performed using the NI 6363 data collection system (National Instruments, USA). Before starting to register the current, the working point of both SI-NW FET transistors was set in the linear operating mode area of the voltage-ampere characteristic of the transistor. This mode provided a linear dependence of the current value of the transistor on the tested quantity of CVP.

3. Results

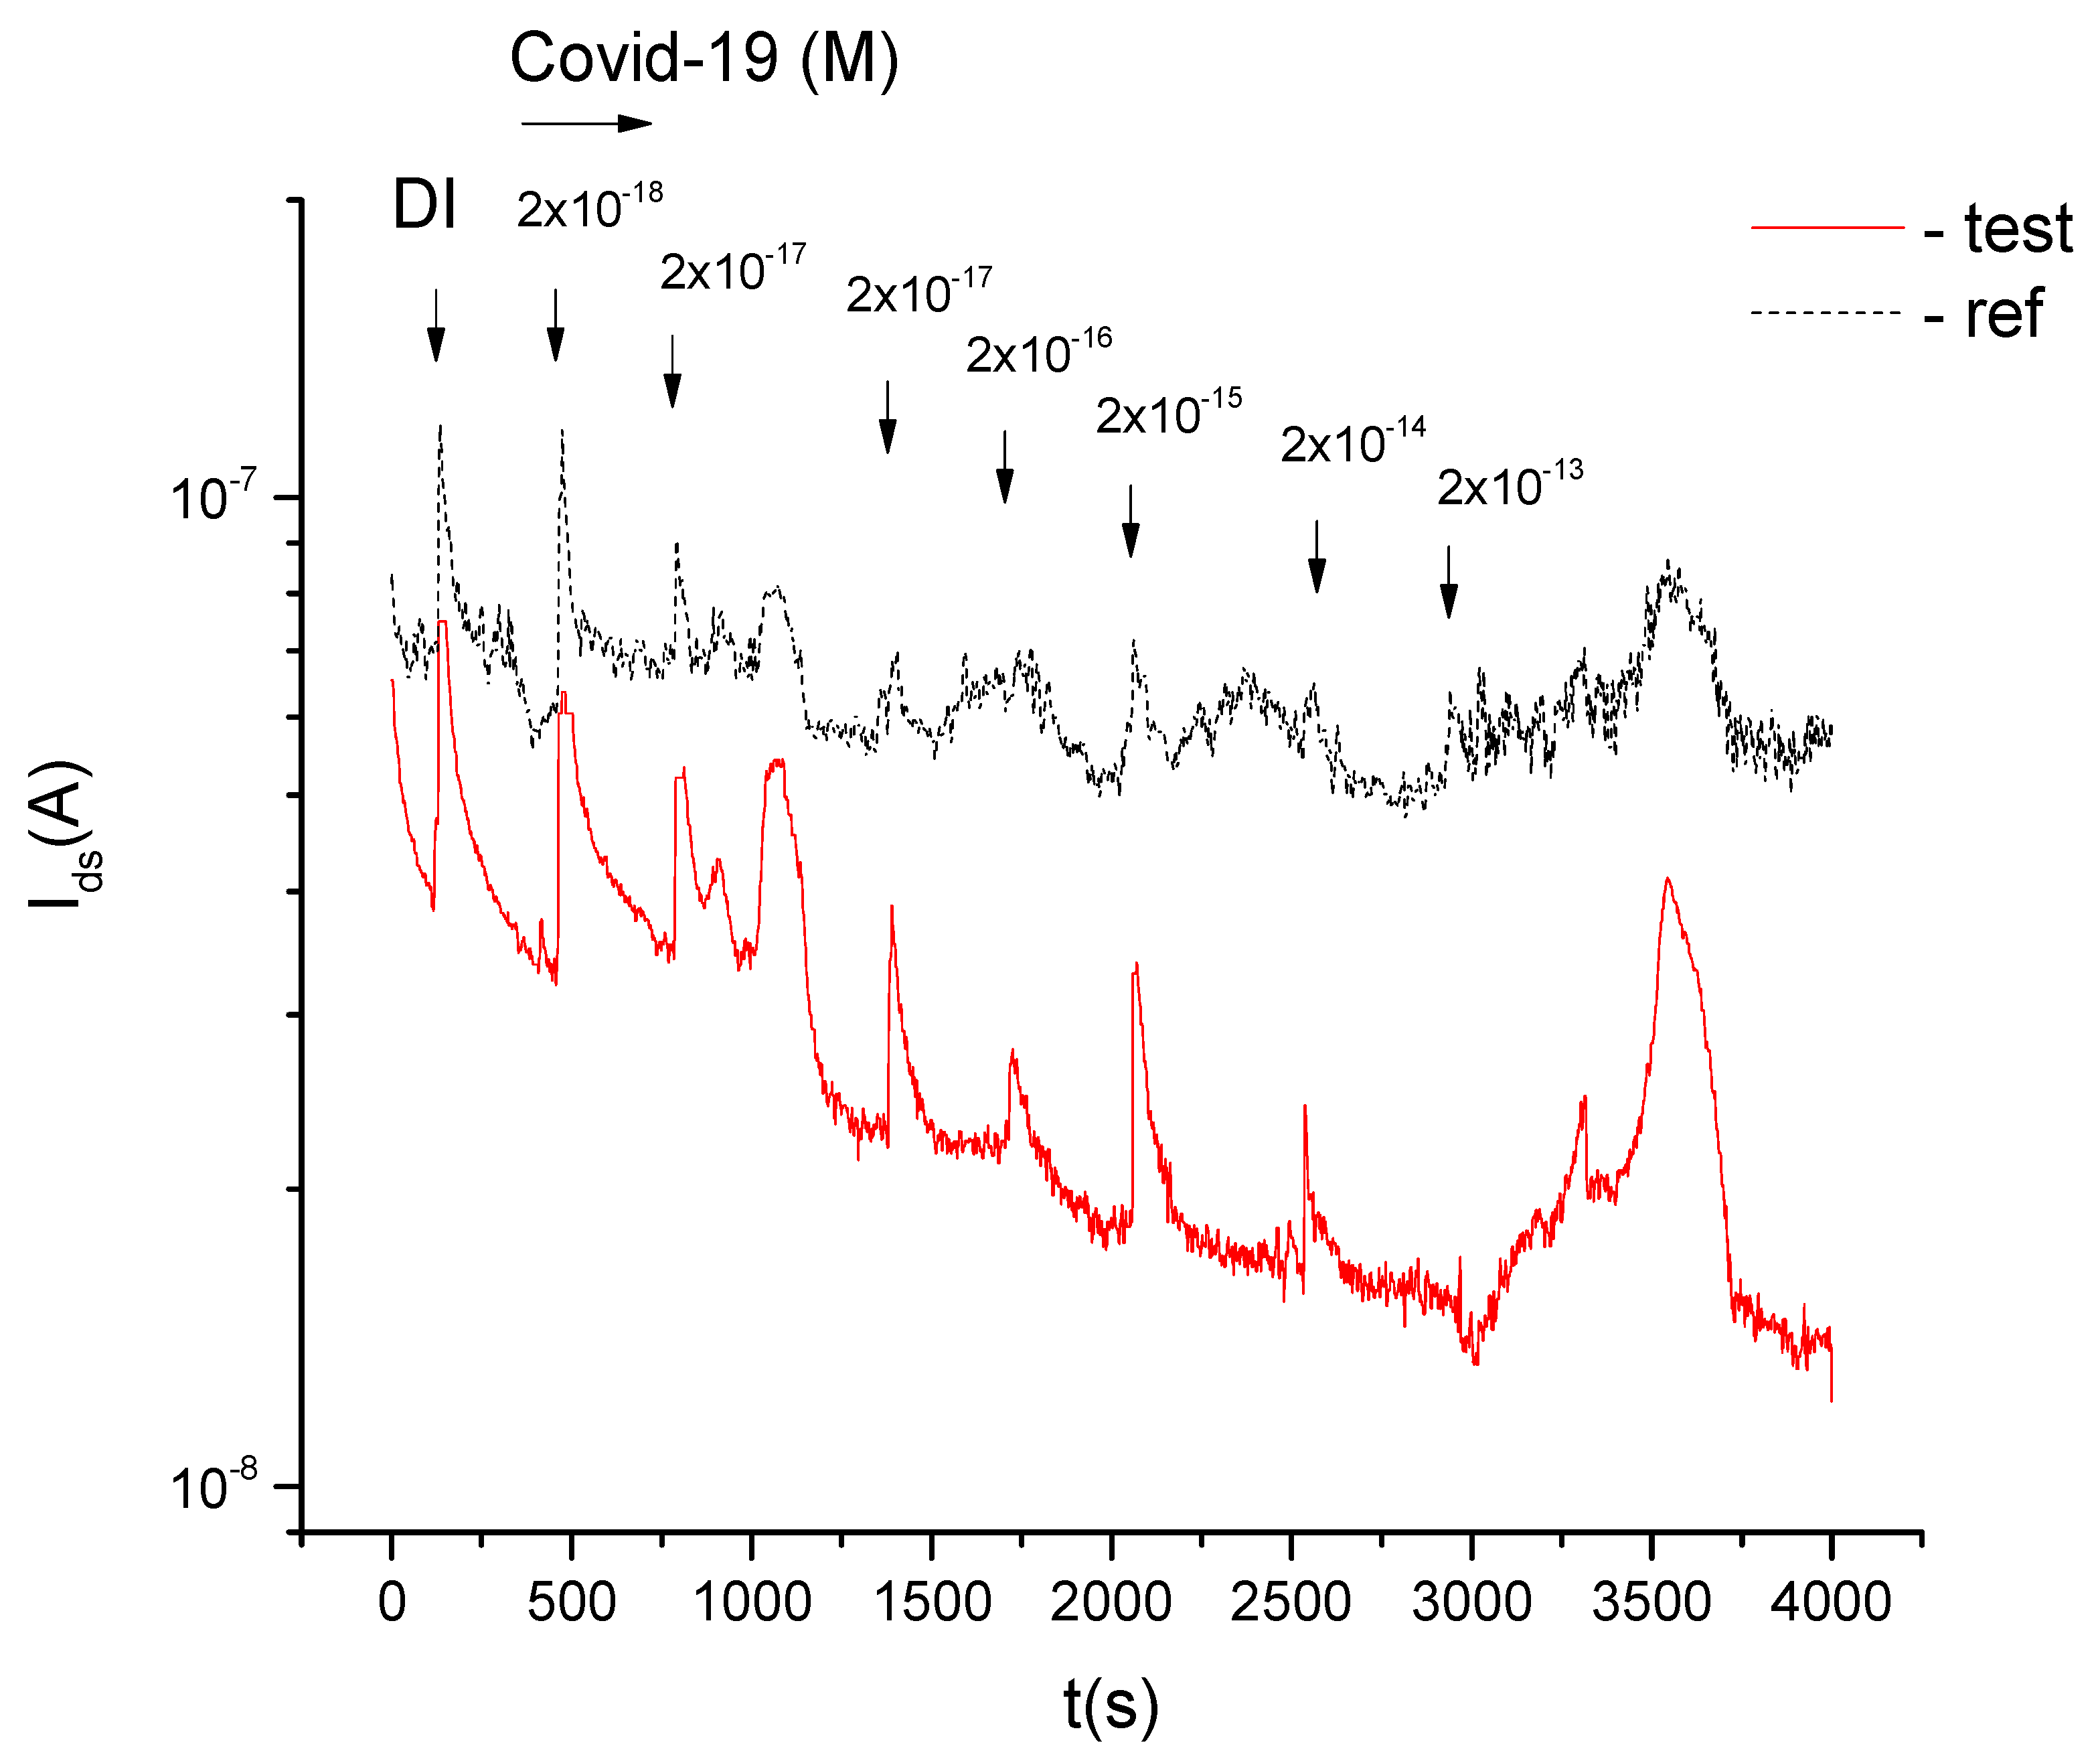
The reaction of two transistors to the introduction of a viral suspension on the surface of the same biosensor is shown Figure 4 and Figure 5. The red and black line currents of two independent transistors of the CNI NP are shown in real time. The red line is a transistor reaction in response to the interaction of a specific antibody with an antigen. The black line is the control—response of the transistor to the presence of the virus, but no antibodies. The reaction of transistors in response to the introduction of a viral suspension in the amount of 10−13 M was studied especially carefully, as shown in Figure 3. The process of current measurement was repeated four times.
Analysis of the dynamics of changes in transistor currents shown in Figure 4 and Figure 5 allowed us to draw conclusions:
-
antibody + CVP complexes, taking into account specific proteins in the suspension at the phase section with the surface of the nanowire, modulate the current of the biosensor field-effect transistor;
-
HPVCS have an electrically positive charge at the phase section “nanowire surface viral suspension»;
-
antibody + HPV complexes have an electrically negative charge on the phase section “surface of the nanowire viral suspension»;
-
the sensitivity of the biosensor is made up of 10−18 M;
-
the display time was 200–300 s.

4. Discussion

The experimental results are consistent with previously published results by other authors in terms of electric charge detection, indication of pathogens, proteins, oligonucleotides, etc. [8,10,11,12]. The results have their own unique total cost—value of electric charges. The difference of signs (positive, negative) between the electric charges for CVP, antibodies, and their antibody + antigen complexes is also noteworthy. It can be assumed that the sign of the electric charge, for example, HPV affects its interaction with the cell membrane. The basis for the assumption is the well-known classical interaction of positive and negative electric charges with each other. Probably, such data are of interest in the field of immunology, molecular biology and virology.
Enzyme-linked immunosorbent assay is based on a specific antibody-antigen relationship [7].
Specific antibodies bind to antigens (for example, CVP) due to the sum of intermolecular interactions. The energy of such a bond is high and amounts to tens of kcal/mol, so these antibody-antigen complexes are stable. The non-specific interaction of HPV also has the ability to bind to HPV, but through weak Van der Waals intermolecular bonds with an energy less than one kcal/mol. Such complexes are unstable and disintegrate. This circumstance allows us to study the fundamental features of specific or non-specific interaction for specific pairs (virus + antibody), by measuring and monitoring the dynamics of the biosensor current. The use of the biosensor has prospects in the development of the technological process of vaccine production, and evaluation of the quality of the material used (antigen, antibodies).
An excess of 10−13 M of the virus in the suspension leads to an increase of the Debye screening length on nanowire biosensors. However, an increase in the biosensor transistor current was observed, rather than a decrease, as is the case with lower amounts of 10−18–10−14 M. This is probably the result of electric recharge of the nanowire surface by a set of positive charges of the CVP [13].

Author Contributions

V.G., O.N., E.Z., B.Z., A.C.—methodology; research. V.G., O.N., D.S., S.A., A.S., B.G.—wrote and edited the article. A.A.—research conceptualization and editing. O.N., D.S., I.M., E.Z., A.A.—resources and validation. G.B.—preparation of the original draft, writing and editing. All authors have read and agreed to the published version of the manuscript.

Funding

This research was funded by State project GZ 11/16 of the industry research program of Rospotrebnadzor for 2016–2020, “Problem-oriented research in the field of epidemiological surveillance of infectious and parasitic diseases”. Manufacturing of sensors and the indication process was carried out in the Rzhanov Institute of Semiconductor Physics, Siberian Branch of the Russian Academy of Sciences, Novosibirsk, Russian Federation, and with the support of the RFBR project No. 18-29-02091.

Acknowledgments

The authors thank the administration of the A. Rzhanov Institute of Semiconductor Physics, Siberian Branch of the Russian Academy of Sciences, Novosibirsk for technical support in the process of research.

Conflicts of Interest

Sponsors played no role in the development of the study; in the collection, analysis, or interpretation of data, in the writing of the manuscript, or in the decision to publish the results.

References

  1. Coronavirus Disease (COVID-19) Pandemic. Available online: https://www.who.int/ru/emergencies/diseases/novel-coronavirus-2019 (accessed on 2 November 2020).
  2. WHO Director-General’s Opening Remarks at the Media Briefing on COVID-1919 11 March 2020 r. Available online: https://www.who.int/ru/dg/speeches/detail/who-director-general-s-opening-remarks-at-the-media-briefing-on-covid-19---11-march-2020 (accessed on 2 November 2020).
  3. Coronavirus. Available online: https://www.who.int/ru/health-topics/coronavirus/coronavirus (accessed on 2 November 2020).
  4. Surveillance Strategies for COVID-19 Human Infection: Interim Guidance, 10 May 2020. Available online: https://apps.who.int/iris/bitstream/handle/10665/332051/WHO-2019-nCoV-National_Surveillance-2020.1-rus.pdf (accessed on 2 November 2020).
  5. Chen, N.; Zhou, M.; Dong, X.; Qu, J.; Gong, F.; Han, Y.; Qiu, Y.; Wang, J.; Liu, Y.; Wei, Y.; et al. Epidemiological and Clinical Characteristics of 99 Cases of 2019-Novel Coronavirus (2019-nCoV) Pneumonia in Wuhan, China. Lancet 2020, 395, 507–513. [Google Scholar] [CrossRef]
  6. Rospotrebnadzor Research Center Has Started Testing a Vaccine Against a New Coronavirus. Available online: http://www.vector.nsc.ru/news/571/ (accessed on 2 November 2020).
  7. Ancelevich, L.M.; Yagudin, L.A. Practical application of enzyme immunoassay in the diagnosis of diseases. Pract. Med. 2014, 3, 28–34. (In Russia) [Google Scholar]
  8. Naumova, O.V.; Fomin, B.I.; Nasimov, D.A.; Dudchenko, N.V.; Devyatova, S.F.; Zhanaev, E.D.; Popov, V.P.; Latyshev, A.V.; Aseev, A.L.; Ivanov, Y.D.; et al. SOI nanowires as sensors for charge detection. Semicond. Sci. Technol. 2010, 25, 055004. [Google Scholar] [CrossRef]
  9. Prabakaran, P.; Gan, J.; Feng, Y.; Zhu, Z.; Choudhry, V.; Xiao, X.; Ji, X.; Dimitrov, D.S. Structure of severe acute respiratory syndrome coronavirus receptor-binding domain complexed with neutralizing antibody. J. Biol. Chem. 2006, 281, 15829–15836. [Google Scholar] [CrossRef] [PubMed]
  10. Parka, J.; Nguyena, H.H.; Woubitc, A.; Kima, M. Applications of field-effect transistor (FET)-type biosensors. Appl. Sci. Converg. Technol. 2014, 23, 61–71. [Google Scholar] [CrossRef]
  11. Yang, F.; Zhang, G.-J. Silicon nanowire-transistor biosensor for study of molecule-molecule interactions. Rev. Anal. Chem. 2014, 33, 95–10. [Google Scholar] [CrossRef]
  12. Dmitrienko, E.; Naumova, O.; Fomin, B.; Kupryushkin, M.; Volkova, A.; Amirkhanov, N.; Semenov, D.; Pyshnaya, I.; Pyshnyi, D. Surface modification of SOI-FET sensors for label-free and specific detection of short RNA analyte. Nanomedicine 2016, 11, 2073–2082. [Google Scholar] [CrossRef] [PubMed]
  13. Stern, E.; Wagner, R.; Sigworth, F.J.; Breaker, R.; Fahmy, T.M.; Reed, M.A. Importance of the Debye screening length on nanowire field effect transistor sensors. Nano Lett. 2007, 7, 3405–3409. [Google Scholar] [CrossRef] [PubMed]
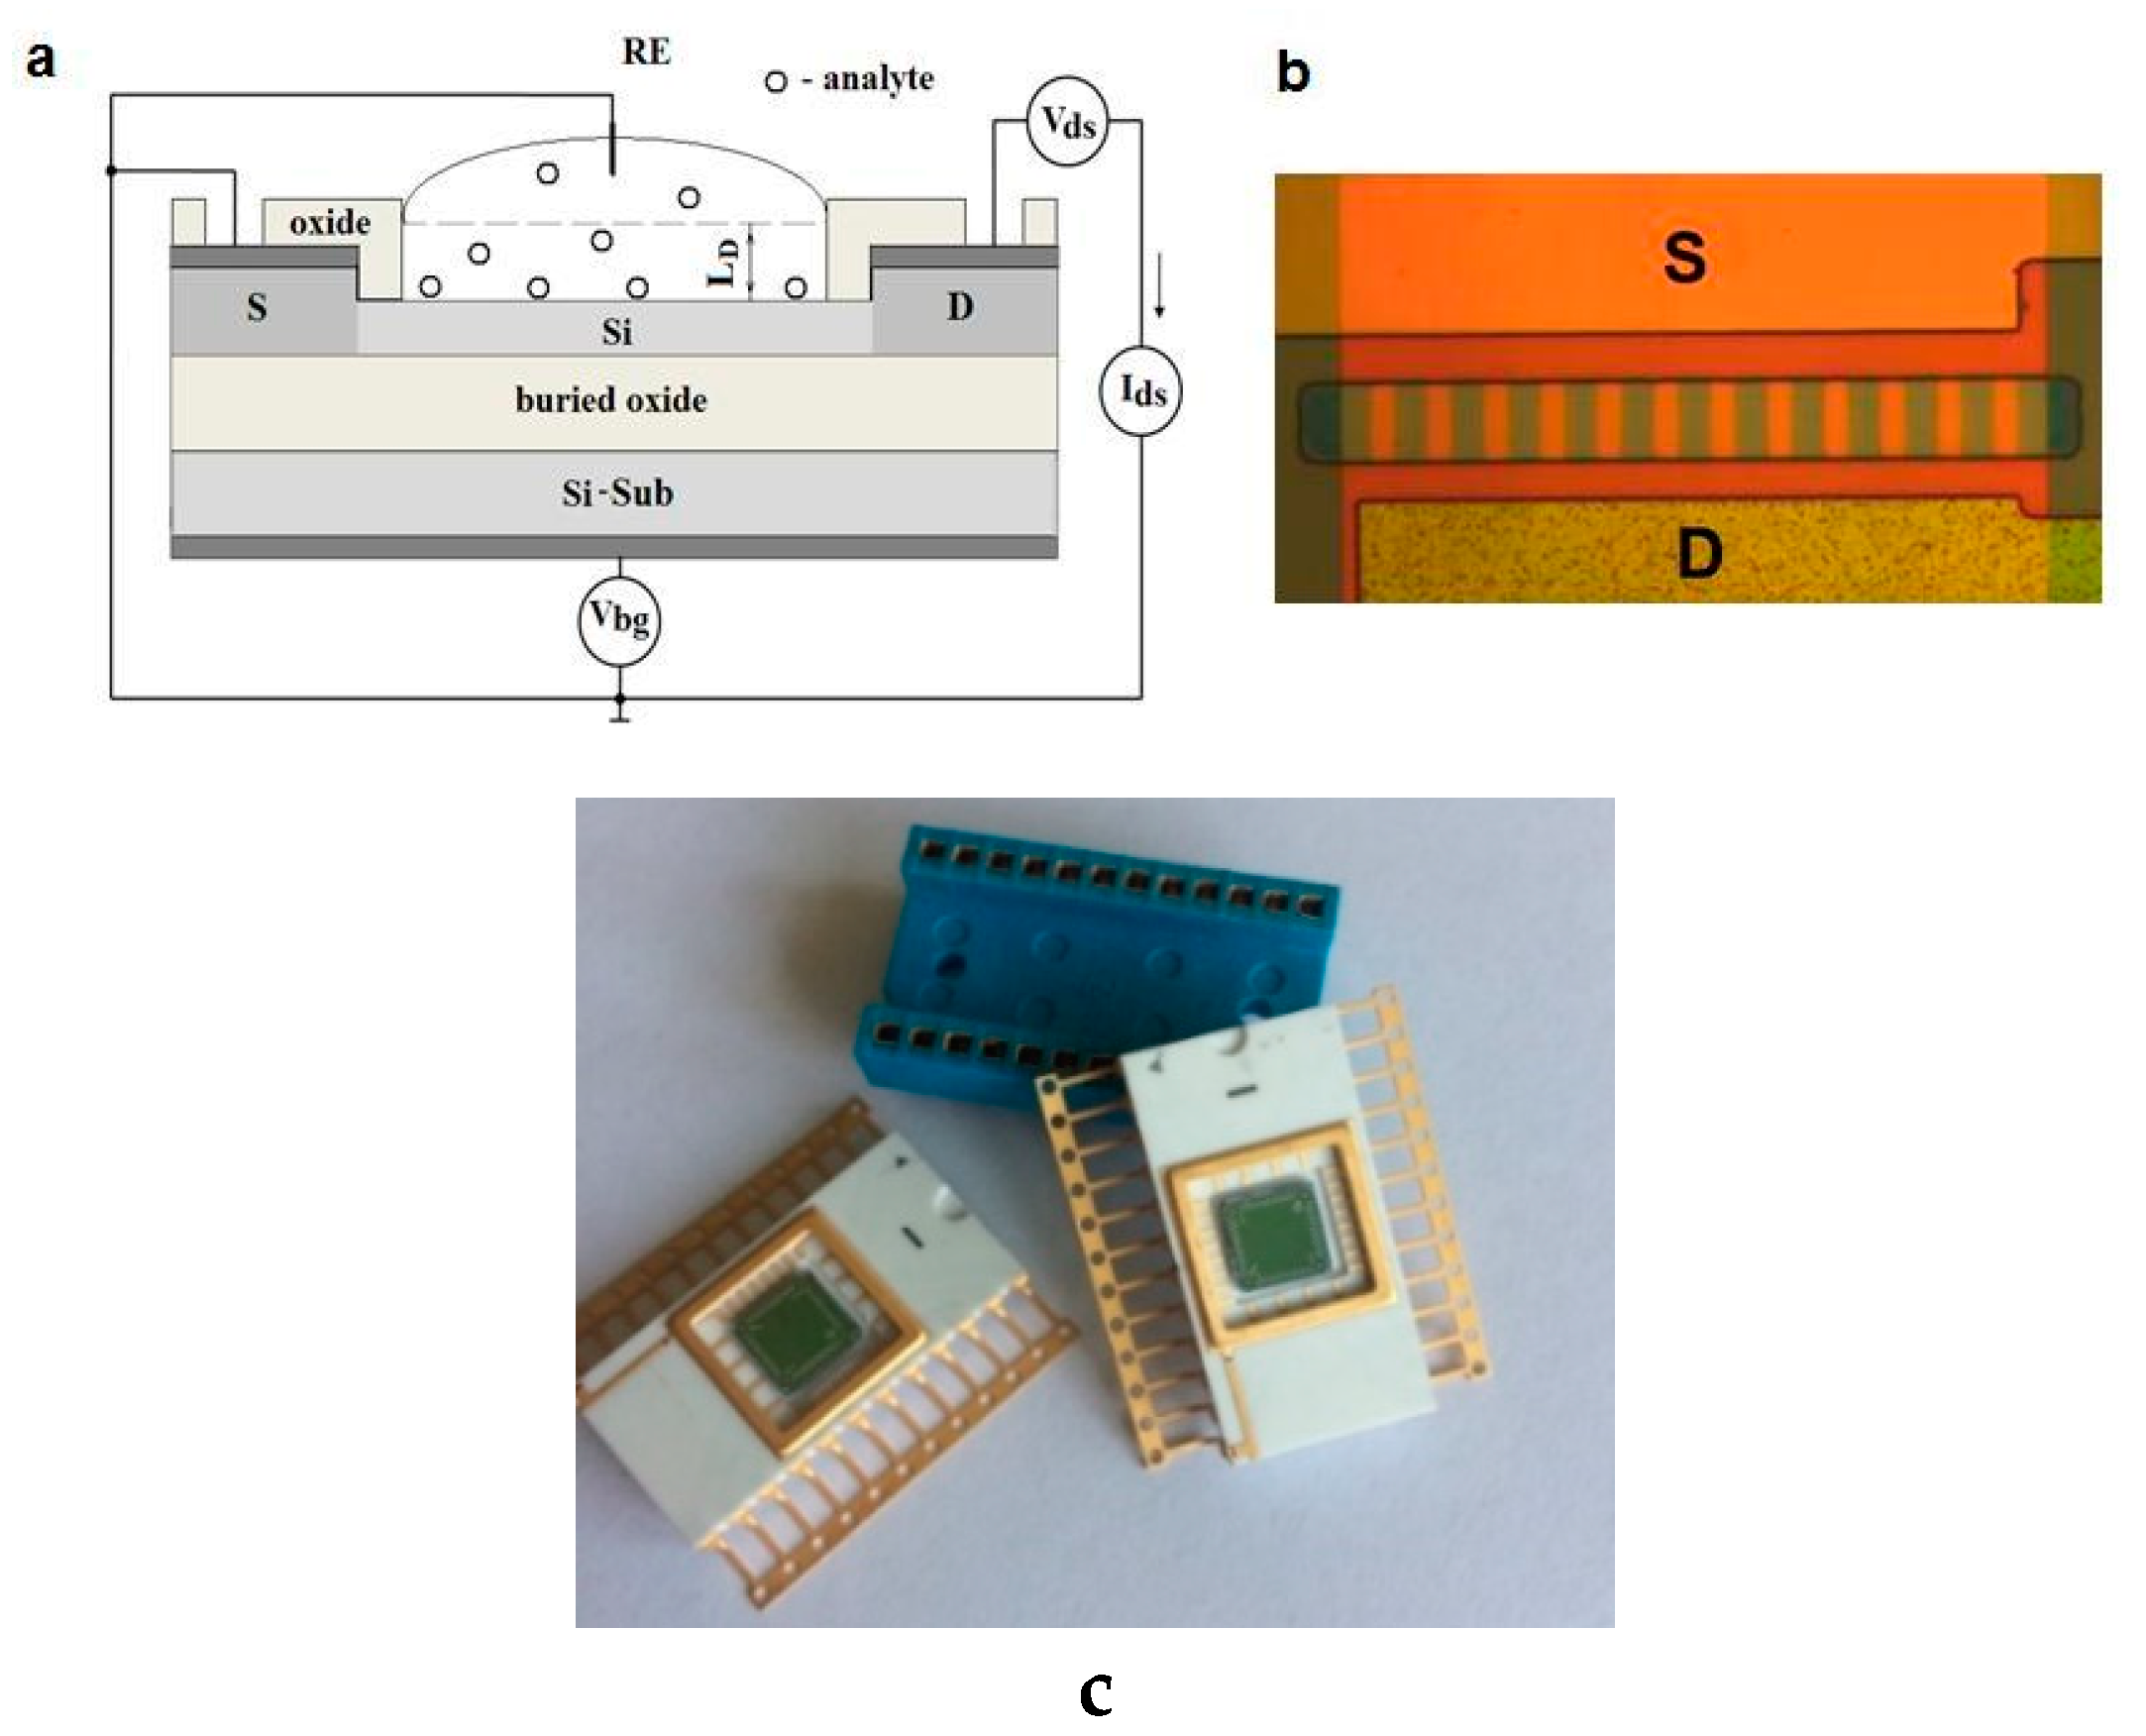
Figure 1. (a) Schematic image of the n-channel biosensor: o—suspension of antibody and virus-like coronavirus particles above the surface of the nanowire, RE—platinum reference electrode; (b,c) optical image of a multichannel sensor on a chip between the contact areas of the source (S) and the drain (D).
Proceedings 60 00050 g001
Figure 2. Antibodies on the surface of the nanowire as revealed by atomic force microscopy.
Proceedings 60 00050 g002
Figure 3. Chemical modification and functionalization of the nanowire by antibodies to form virus-like coronavirus particles.
Proceedings 60 00050 g003
Figure 4. Experimental and control time curves of Ids (t) current of two independent biosensor transistors obtained after adding virus-like coronavirus particles with a quantity of 10−18–10−13 M to their surface. Red line (experiment) changes in the first current of a transistor in response to a specific antibody-antigen reaction on the surface of its nanowire. Black line (control) of current changes in response to the probable presence of virus-like coronavirus particles on the surface of the second transistor nanowire.
Proceedings 60 00050 g004
Figure 5. Experimental (red line) and control (black line) time curves of Ids (t) current of two independent biosensor transistors obtained after adding virus-like coronavirus particles with an excess quantity of 10−13 M to the biosensor surface. The red line changes the first current of the transistor in response to a specific antibody-antigen reaction on the surface of its nanowire. A black line of current changes in response to the probable presence of virus-like coronavirus particles on the surface of the second transistor nanowire.
Proceedings 60 00050 g005
Publisher’s Note: MDPI stays neutral with regard to jurisdictional claims in published maps and institutional affiliations.