Proceeding Paper

Comparison of Optical and Gravimetric Methods for Detection of Chymotrypsin †

1
Department of Nuclear Physics and Biophysics, Faculty of Mathematics, Physics and Informatics, Comenius University, Mlynska Dolina F1, 842 48 Bratislava, Slovakia
2
Center for Nanophase Materials Sciences, Oak Ridge National Laboratory, Oak Ridge, TN 37831, USA
*
Author to whom correspondence should be addressed.
Presented at the 1st International Electronic Conference on Biosensors, 2–17 November 2020; Available online: https://iecb2020.sciforum.net/.
Proceedings 2020, 60(1), 42; https://doi.org/10.3390/IECB2020-07071
Published: 2 November 2020
(This article belongs to the Proceedings of The 1st International Electronic Conference on Biosensors)

Abstract

:
Proteases play an important role in various biological as well as dairy industrial processes. In this work, we focused on chymotrypsin, which is an important protease in human digestion. Chymotrypsin also cleaves milk proteins, which makes it useful in the study of activity of milk proteases. In this work, we focused on detection of chymotrypsin using optical and gravimetric techniques, their peculiarities, and the limit of detection (LOD) (0.15 ± 0.005 nM and 0.64 ± 0.31 nM for optical and gravimetric methods, respectively). While the optical detection is easier to implement, the gravimetric method is more robust for sample preparation. Both methods could represent a novel assay for detection of chymotrypsin and other milk proteases.

1. Introduction

Proteases represent a very wide and important group of enzymes for various biological systems. Their proteolytic activity determines final structure and utility of proteins [1]. As a result of this, proteases also take part in different pathological processes, such as atherosclerosis, malabsorption syndrome, lymphocyte dysfunction, cancer, and serve an important role in human digestion [2,3]. Chymotrypsin, one of the proteases present in human digestion system, plays a significant role in protein cleavage in the intestines. Together with trypsin, in the zymogen form, chymotrypsinogen is ejected into the duodenum, where trypsin cleaves it into the active form [4]. Chymotrypsin is a serine protease that cleaves peptide bonds by hydrolysis at the location of tryptophan, tyrosine, phenylalanine, or leucin [5]. Its activity is closely tied to the activity of trypsin, which, along with plasmin, is an important enzyme in human milk. Activity of plasmin ties to the quality of milk. Higher protease activity cleaves the proteins, mainly caseins, in the micelles in milk and affects the milk shelf-life or cheese yield and flavor [6]. Chymotrypsin and trypsin both cleave caseins and therefore biosensors made based on the cleavage of caseins are sensitive for both proteases and plasmin.
In pathology and medicine, chymotrypsin has also anti-inflammatory effects and has been successfully used to reduce post-operation complication after cataract surgery [7]. Measuring chymotrypsin activity in medicine can help during differential diagnosis of acinar and endocrinal neoplasms [8].
Thus, development of sensitive, inexpensive, fast, and easy to use methods for detection of chymotrypsin or other milk proteases would be beneficial for both medicine and dairy. The assay that fulfills these requirements is not yet available. Protease detection is currently based on the detection of α-amino groups cleaved from the protein substrate using optical or high-performance liquid chromatography (HPLC) methods. The method that can be used for fast analysis of the protease concentration is based on enzyme-linked immunosorbent assay (ELISA) with a limit of detection (LOD) of about 0.5 nM for chymotrypsin [9,10]. However, the above-mentioned method does not allow the study of the kinetics of substrate digestion.
In this paper we propose two efficient methods for chymotrypsin detection: optical and gravimetric. Gravimetric method is based on measurement of the resonant frequency of shearing oscillations of AT-cut quartz crystal, as well as motional resistance, Rm, and is known as thickness shear mode method (TSM). The protease substrates, such as β-casein or short specific peptides, are immobilized in thin gold layers sputtered at a TSM transducer. High frequency voltage, typically in the range of 5–20 MHz, induces shearing oscillations of the crystal. The fundamental resonance frequency of the crystal, f0, depends on the physical properties of the quartz (density, shearing modulus, and thickness), viscosity of the medium to which the crystal surface is exposed, as well as on the molecular interactions at the surface. The Rm value is sensitive to shearing viscosity, which is due to the molecular slip between the protein layer and surrounding water environment. Using Sauerbrey Equation (1) [11], one can link the change in resonant frequency to the mass bound to the surface of the electrode.
Δf = −2fo2Δm/A(μqρq)1/2,
where fo is the fundamental resonant frequency (Hz), A is the active crystal area (usually 0.2 cm2), ρq is quartz density (2.648 g·cm−3), Δm is the mass change (g), ρq is the shear modulus of the crystal (2.947 × 10¹¹ g·cm−1s−2). This equation is valid only for rigid layer at vacuum. In a liquid environment and for relatively soft layers, the viscosity contribution can be estimated by measurements of Rm.
In this work, we modified the surface of the crystal with β-casein a natural substrate for chymotrypsin. The resulting mass added to the sensor caused the change of the frequency f and changes of motional resistance, Rm. Further changes of these values can be monitored following addition of chymotrypsin, which leads to cleavage of the β-casein. The mass-sensitive method has been already used for detection of other proteases. Gronewold [12] monitored activity of bacterial proteases and esperase using proteins from bovine fetal serum. Poturnayova et al. used β-casein layers to detect activity of plasmin and trypsin with LOD around 0.65 nM [13]. In another work of Tatarko et al., the multiharmonic quartz crystal microbalance (QCM) allowed detection of trypsin and plasmin with LOD of 0.2 nM and 0.5 nM, respectively. The machine learning algorithm applied in this work allowed us to distinguish these two proteases within 2 min [14].
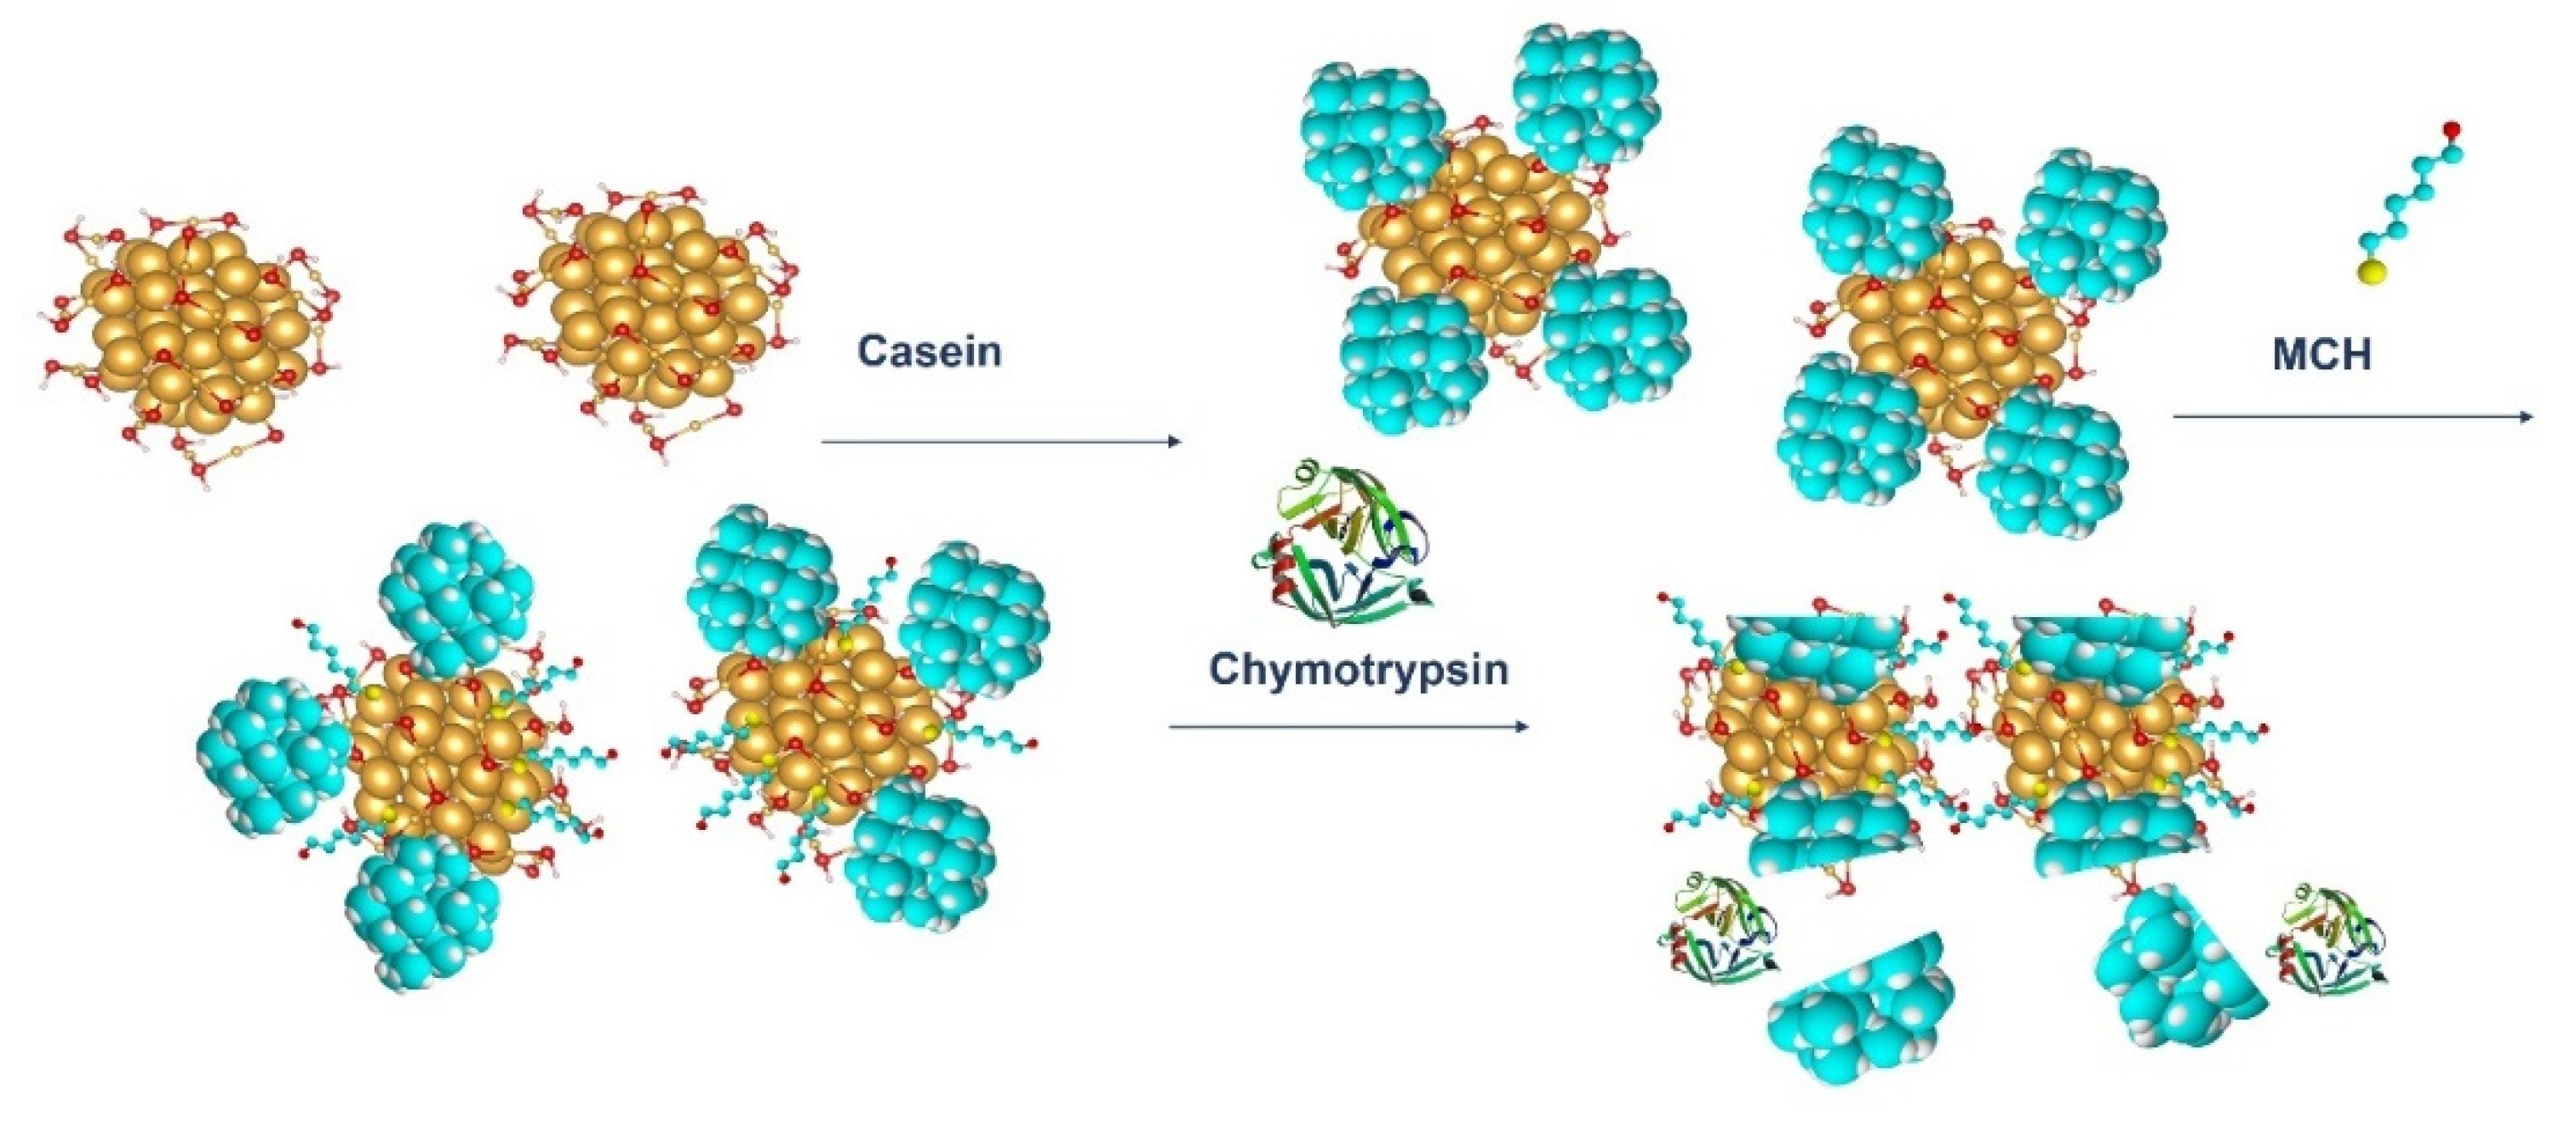
We also applied an optical method based on measurement absorbance of the dispersion of gold nanoparticles (AuNPs) coated by β-casein and 1-mercaptohexanol (MCH). AuNPs reveal a surface plasmon resonance (SPR) effect, which can be measured using UV-Vis spectroscopy. The surface plasmon resonance (SPR) effect arises when the oscillating electromagnetic field of light rays gets into contact with the free electrons in metallic nanoparticles and induces their coherent oscillation. The maximum amplitude of this oscillation happens at a specific wavelength called SPR. The SPR position and intensity depends on various factors like metal type, particle size, shape, structure, and dielectric constant of surrounding medium [15]. The absorbance of gold nanoparticles has a maximum in visible spectrum depending on the surrounding medium and on the distance between nanoparticles. AuNPs are rather popular in biosensing applications. In the work by Diouani, AuNPs modified with casein were used to detect Leishmania infantum using amperometric methods [16]. Chen et al. showed the modified AuNPs with trypsin-specific peptide sequence [17]. After the trypsin cleavage, the gold nanoparticles aggregated, which was visible by measuring UV-Vis spectrum. The detection limit of this method was 5 nM. Guaris et al. used dithiols to measure thrombin activity [
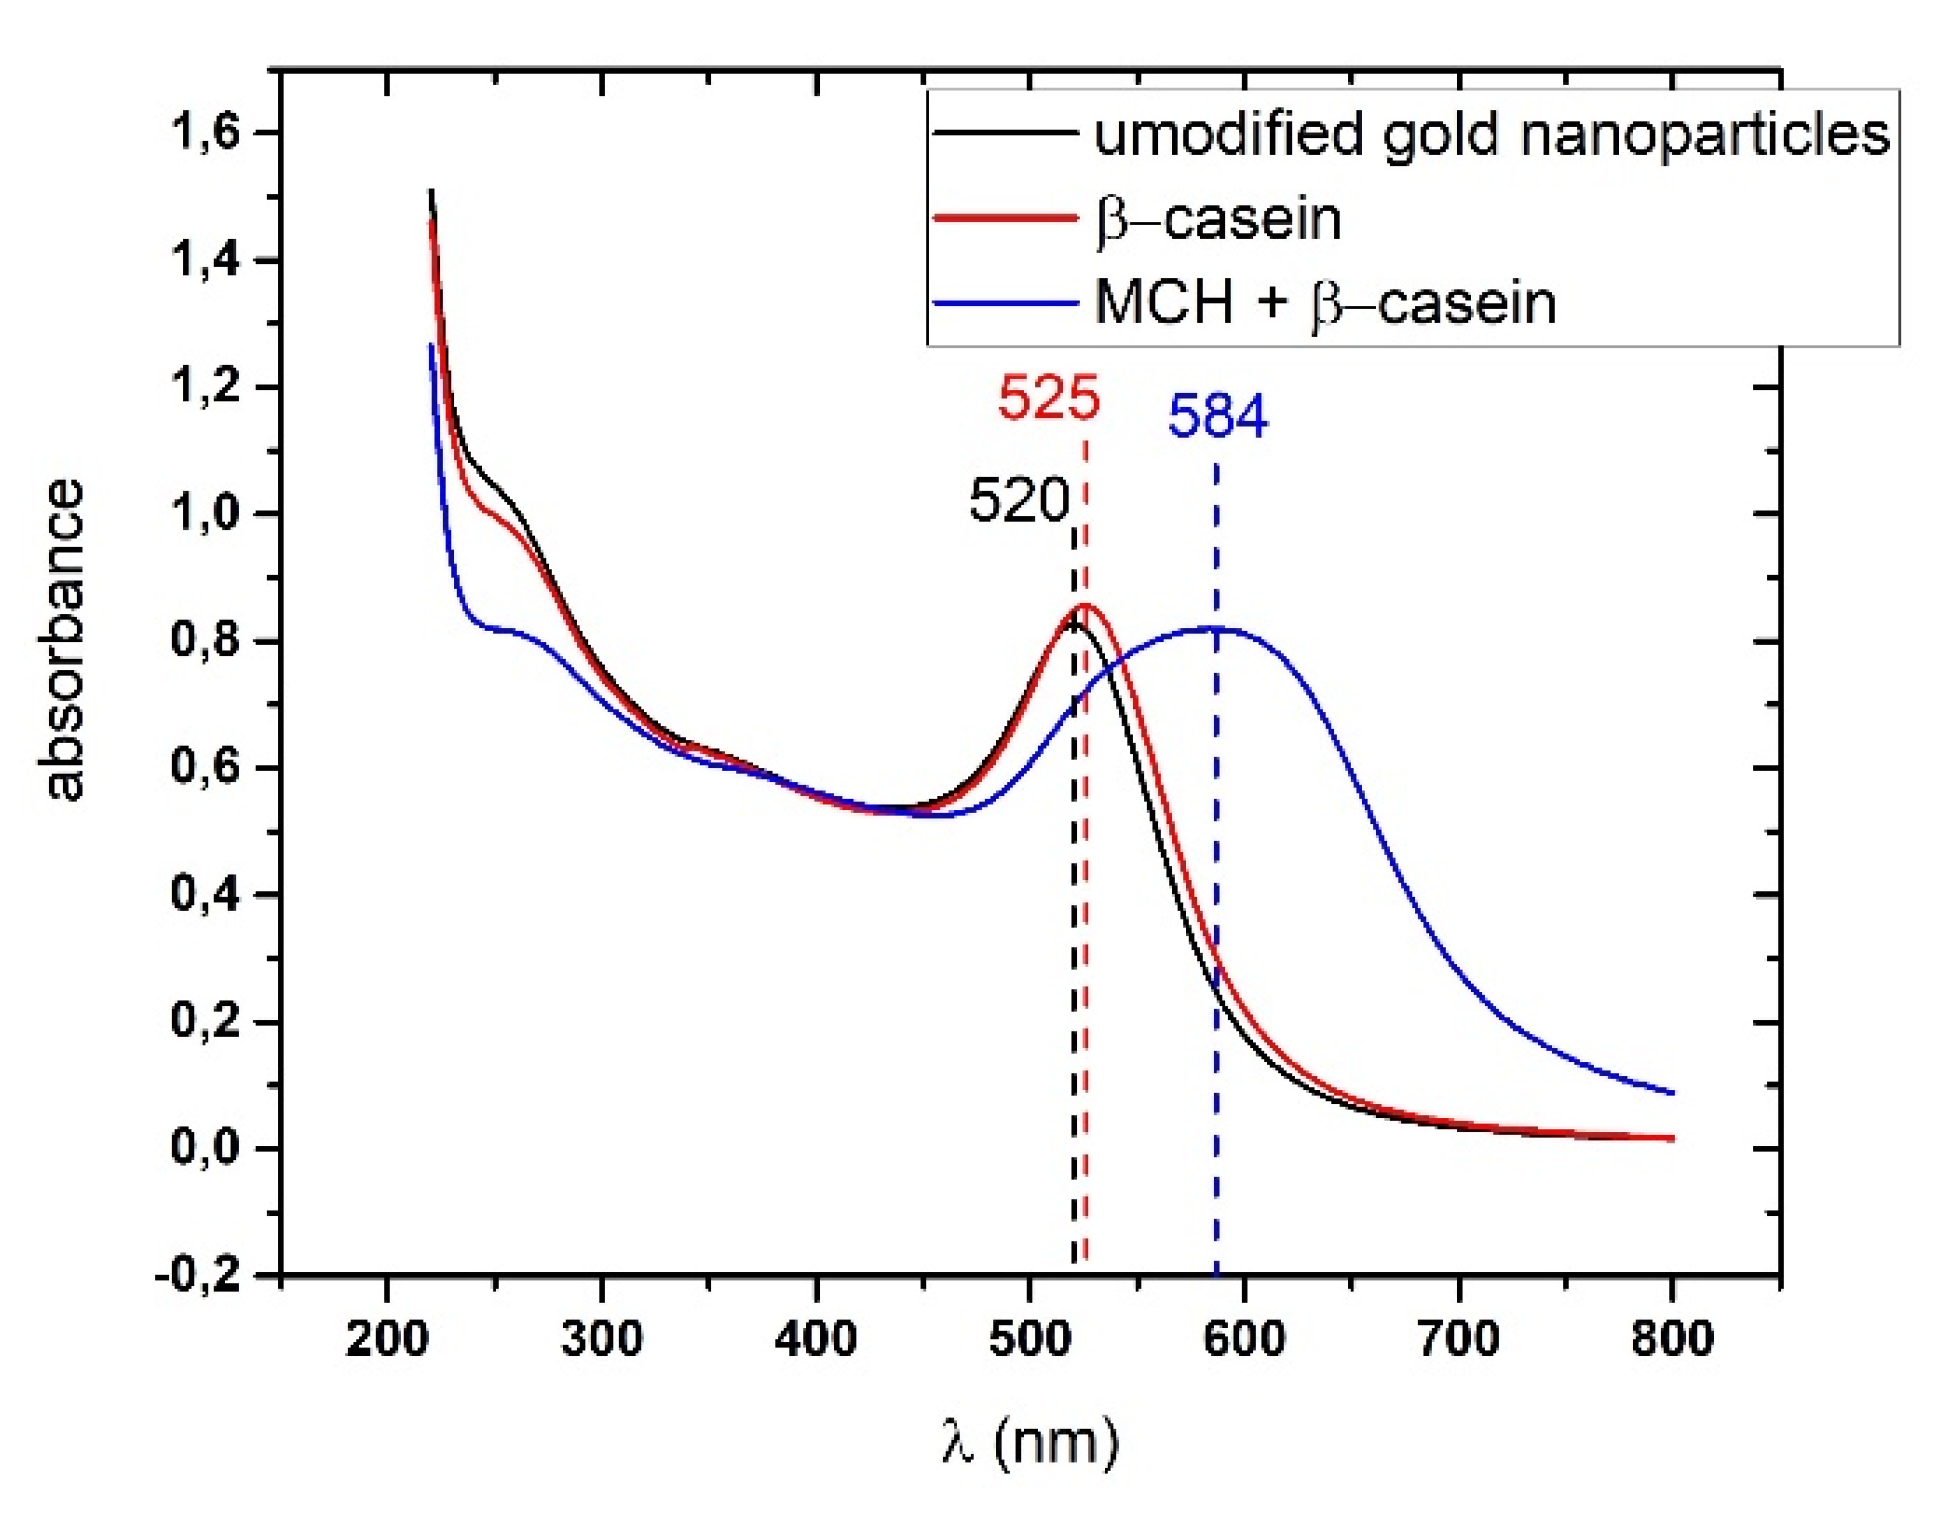
18]. In this work, a presence of substrate for thrombin resulted in aggregation of AuNPs, while addition of thrombin disaggregated the nanoparticles (LOD for thrombin detection was around 5 nM). Since AuNPs can be easily modified by thiol-group-containing peptides, this method makes it possible to prepare substrates with well-observable absorption properties. In our work, we modified the gold nanoparticles with β-casein and MCH. The β-casein protects the AuNPs from aggregation induced from the loss due to presence of MCH. Addition of the chymotrypsin and subsequent cleavage of the β-casein caused nanoparticles aggregation due to loss of the protective shell. This effect was possible to observe by measuring UV-Vis spectra of nanoparticle dispersion.

2. Materials and Methods

2.1. Chemicals

The chemicals needed to prepare the piezocrystal and gold nanoparticles were purchased from Sigma-Aldrich (Darmstadt, Germany), the chemicals needed to clean the crystals were purchased from Slavus (Bratislava, Slovakia). Deionized water was distilled directly at the flask using a Purelab Classic UV instrument (Elga, High Wycombe, UK). All standard chemicals, such as auric acid (HAuCl4), sodium citrate, β-casein, 1-mercaptohexanlo (MCH), phosphate buffered saline (PBS) tablets, 11-mercaptoundecanoic acid (MUA), N-(3-dimetylaminopropyl)-N′-etylcarbodiimid (EDC), N-hydroxisuccinimid (NHS), α-chymotrypsin, NaOH, HC NaOH, NH3, and H2O2 were of p.a. grade.

2.2. Optical Method

AuNPs were prepared by modified citrate method [19]. In short, we prepared 100 mL of 0.01% chloroauric acid (HAuCl
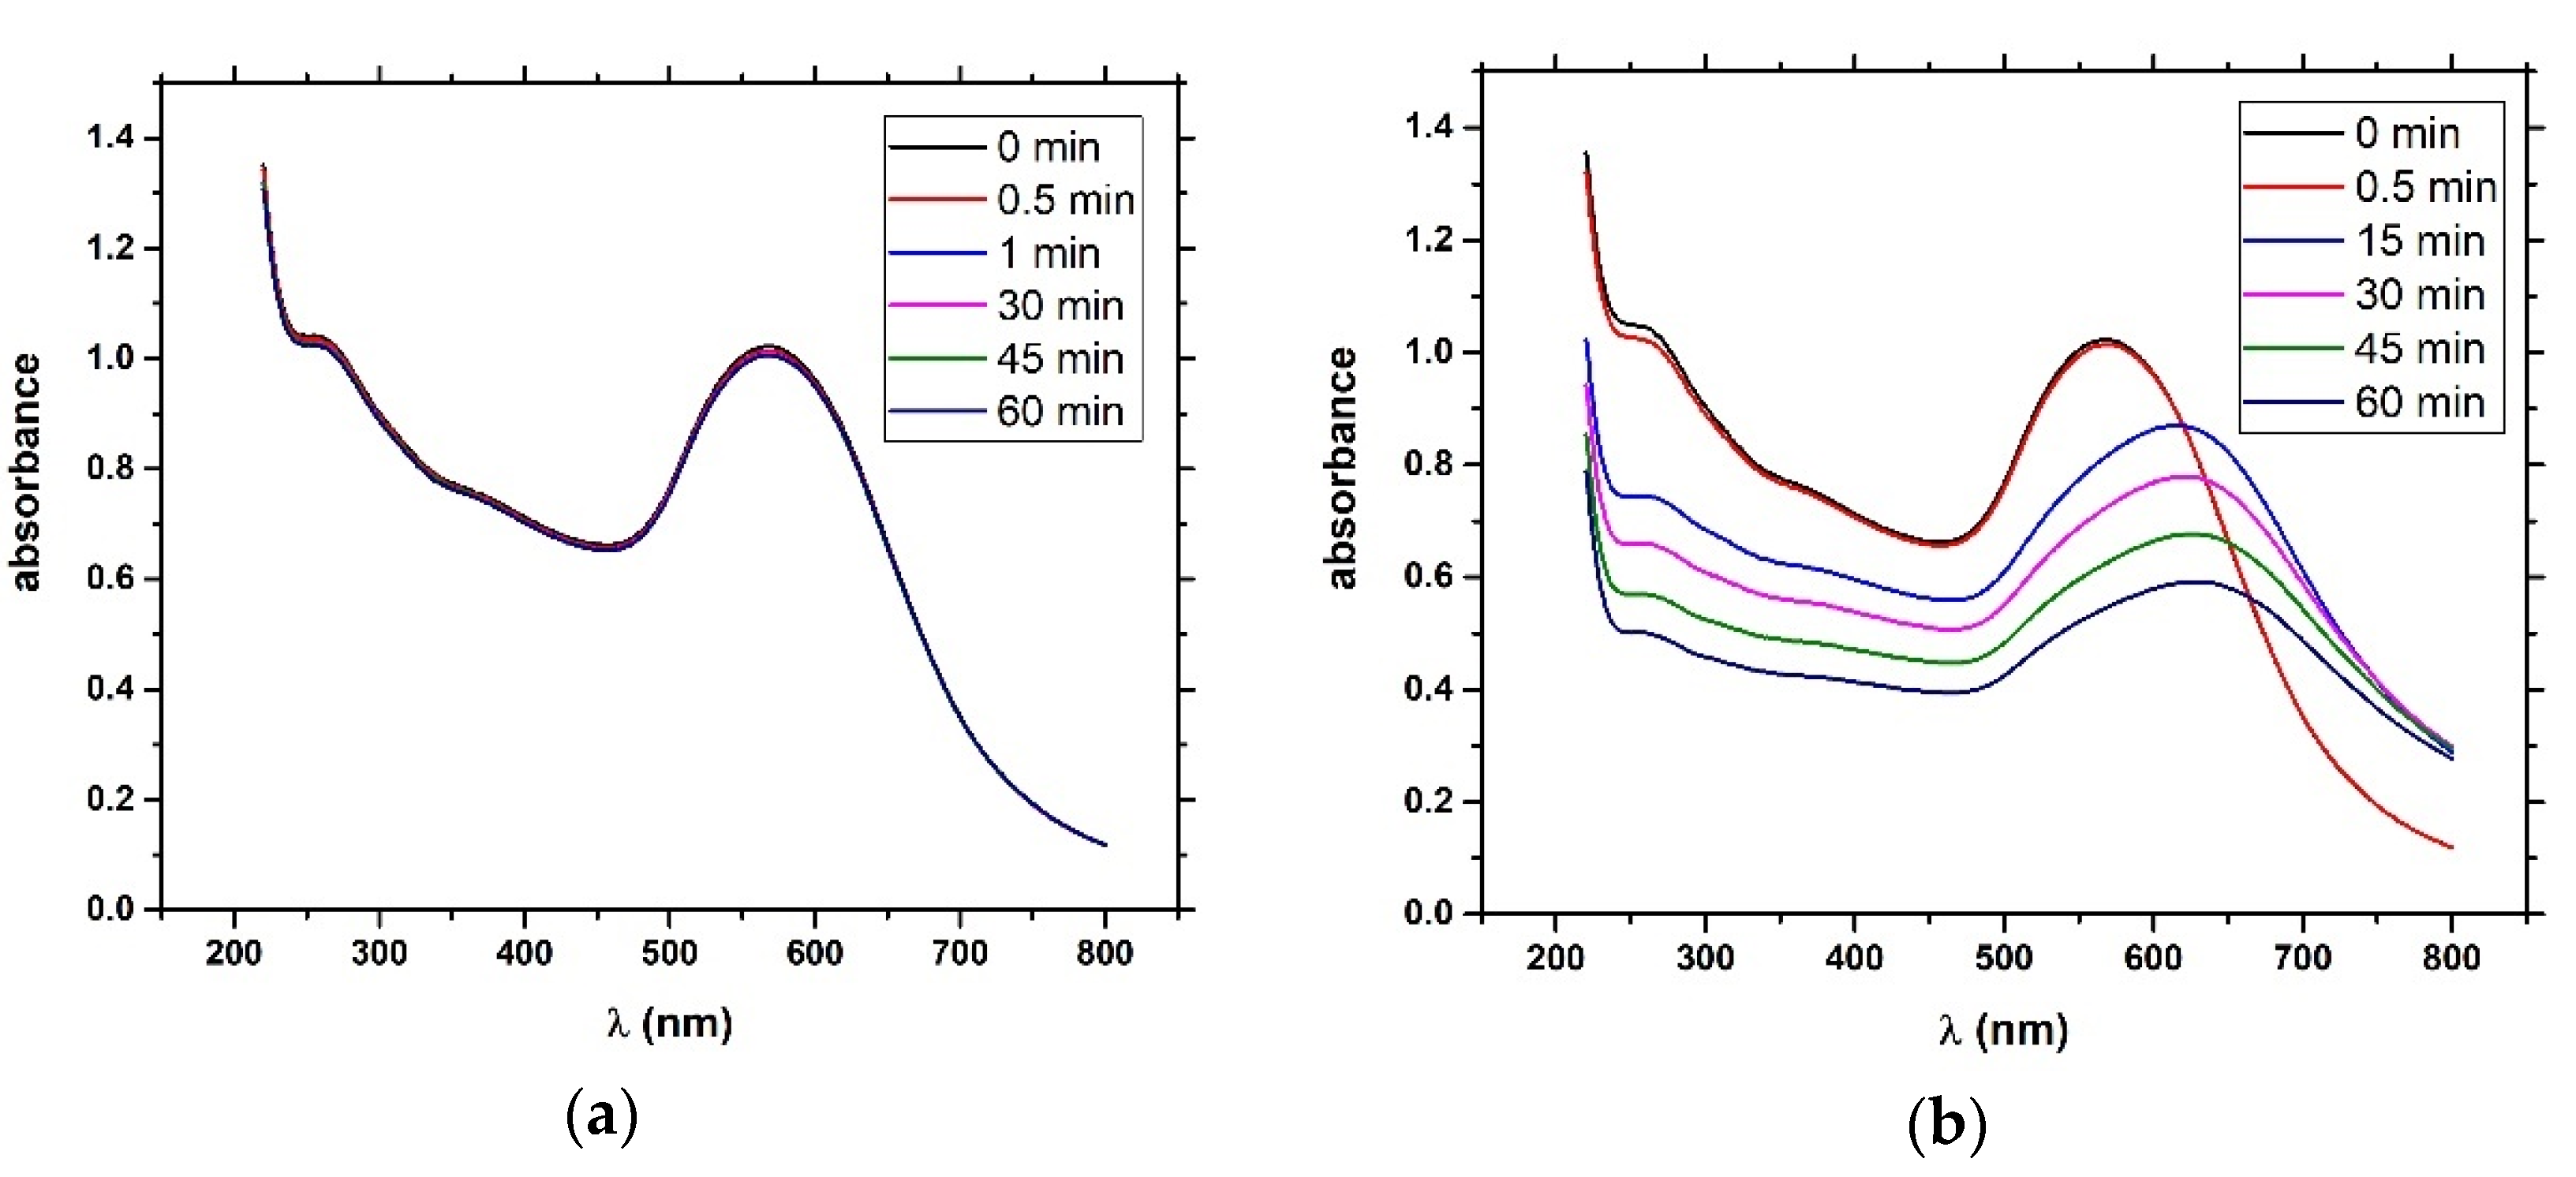
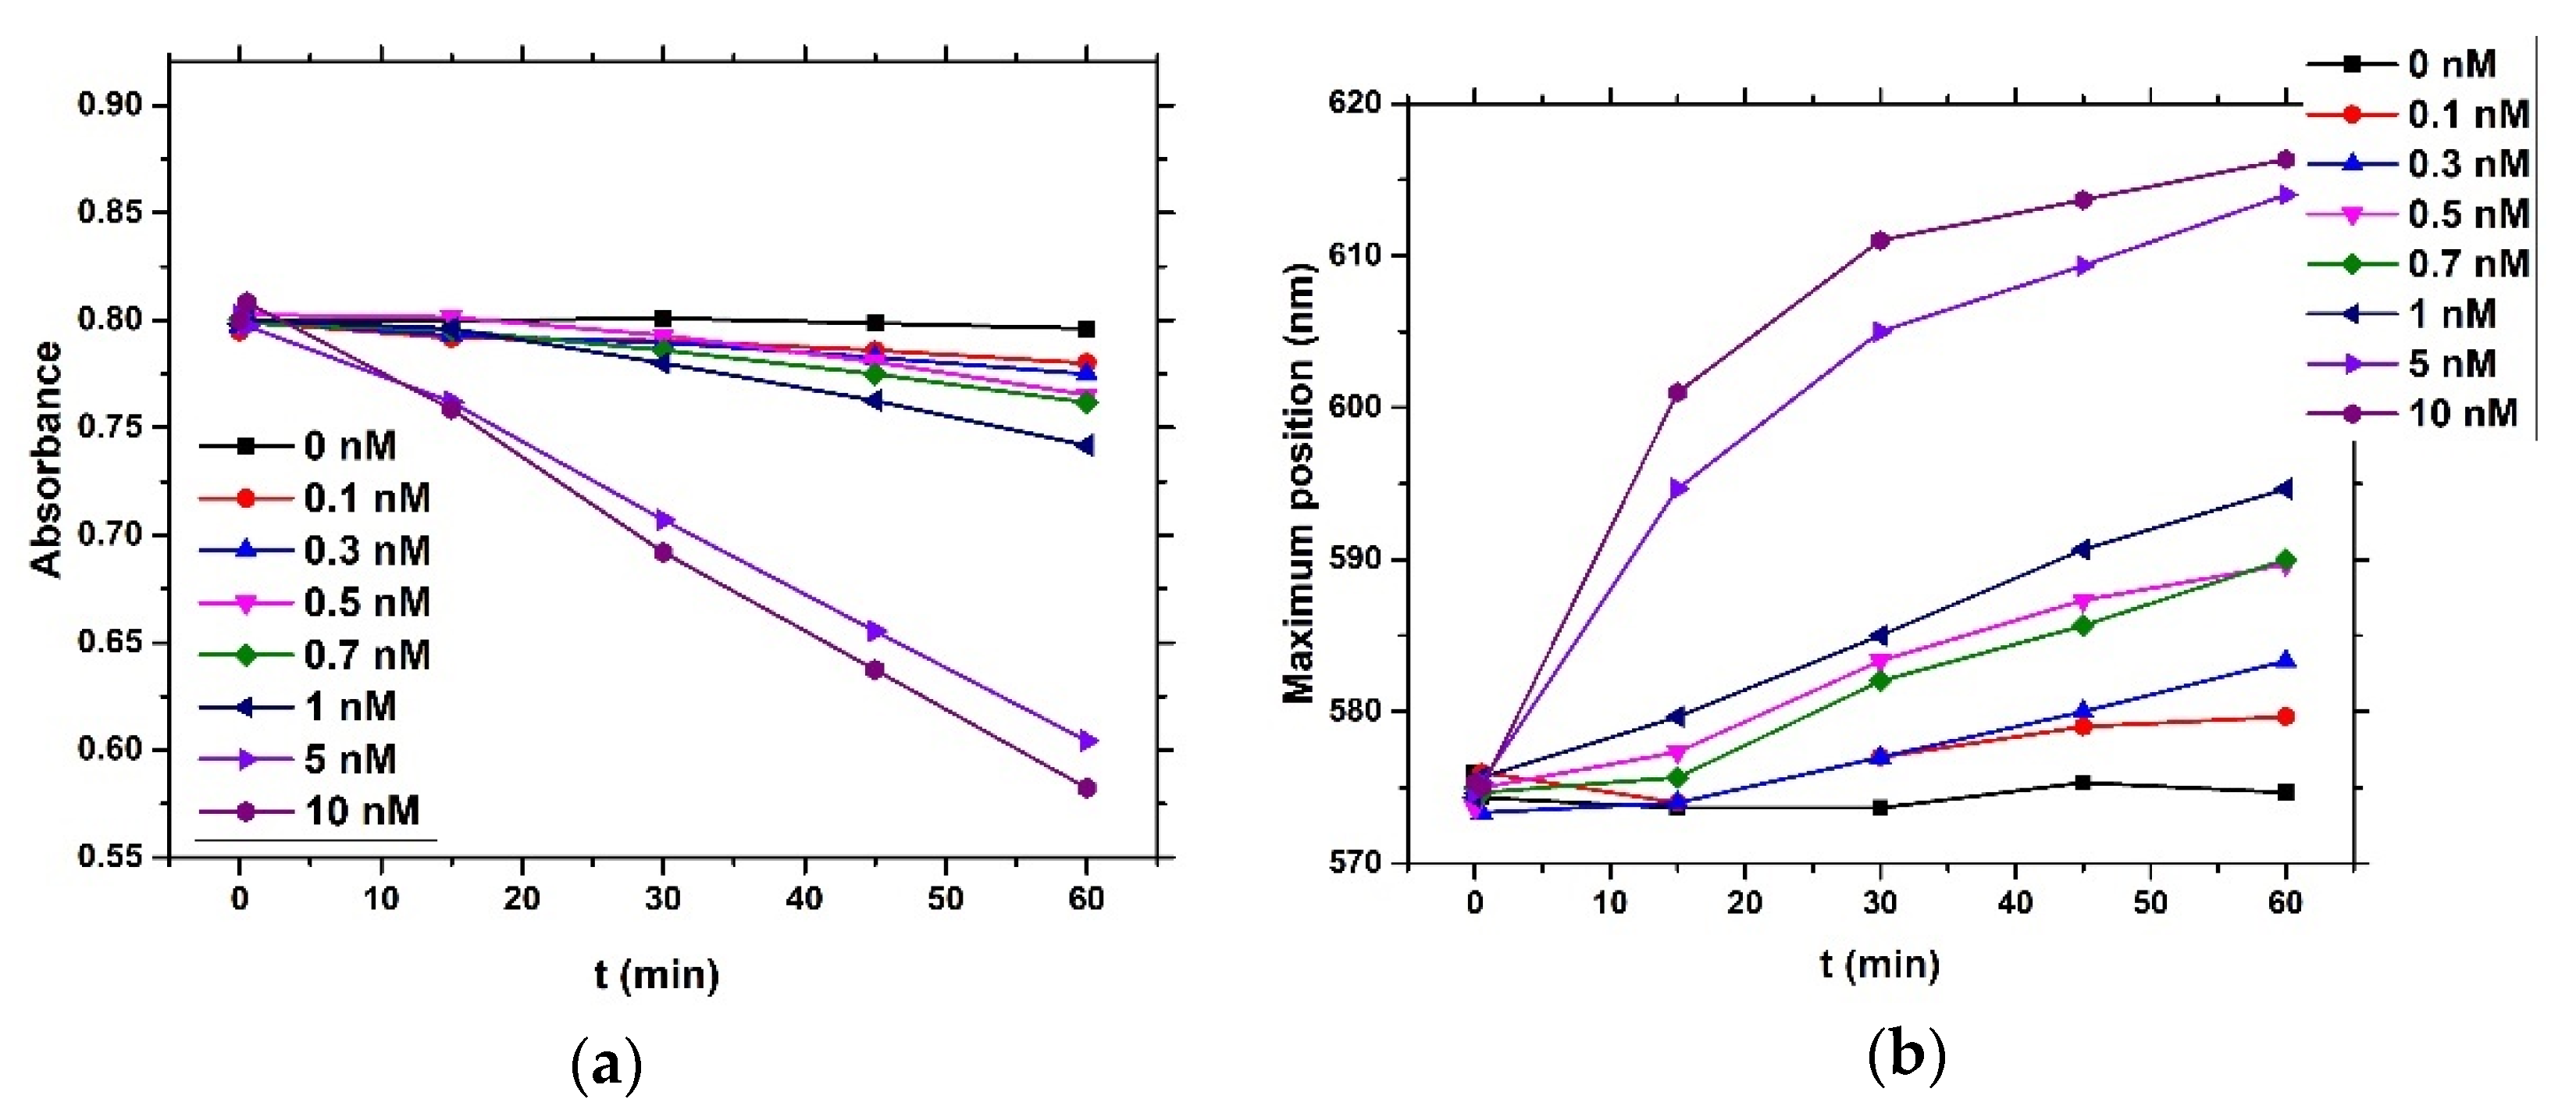
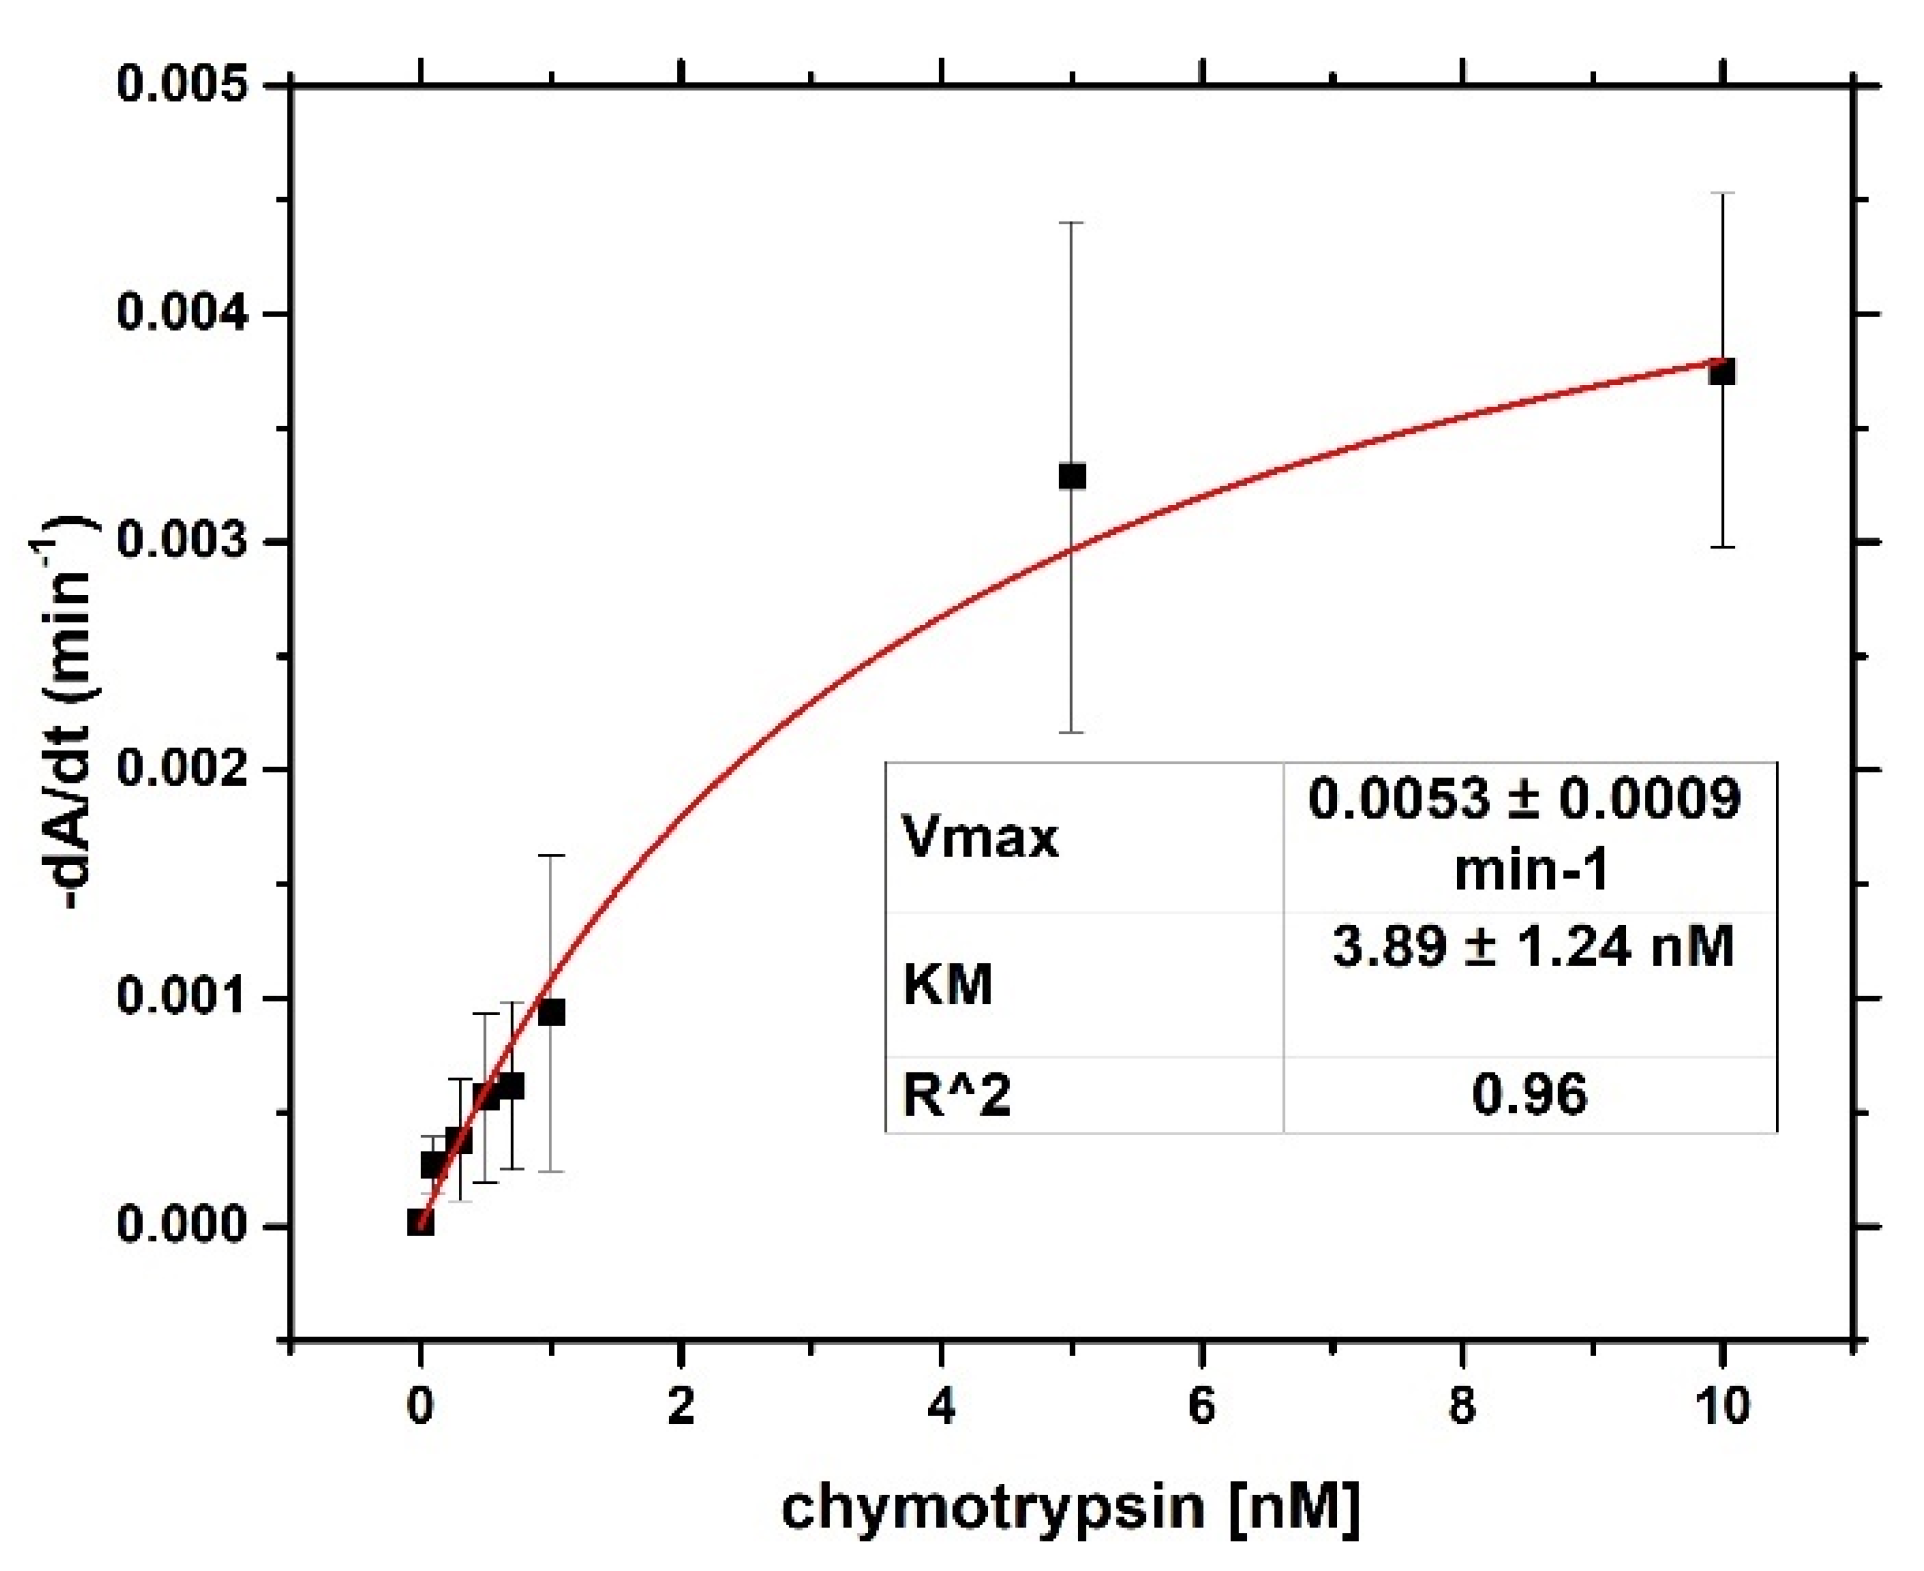
4) and brought it to a boil. We then added 5 mL of 1% sodium tris-citrate and left the solution boiling while stirring until it turned deep red. We then left the prepared AuNPs to cool down and stored them in the dark. To modify the gold nanoparticles with casein, we added 2 mL of 0.1 mg/mL β-casein into 18 mL of the AuNPs solution. After 2 h of incubation at room temperature without stirring, the gold nanoparticles were further incubated with 200 µL of 1 mM MCH overnight for approximately 18 h. MCH is important as it removes the surface charge of nanoparticles and thus protect them from aggregation. Addition of MCH leads to a color change to violet. However, nanoparticles (NPs) are protected from aggregation due to the presence of a β-casein layer. Addition of chymotrypsin caused cleavage of β-casein, and as a result, the NPs aggregated. This was reflected by changes of the color of the solution to blue and then it became colorless. For the experiments, we prepared 0.95 mL of NPs. Chymotrypsin was dissolved in deionized water and 0.05 mL of chymotrypsin from stock solution was added to each cuvette. The concentration of chymotrypsin in cuvettes was 0.1, 0.3, 0.5, 0.7, 1.5, and 10 at 1 mL total volume of solution. We also used a reference cuvette where only 0.05 mL of protease-free water was added to the AuNPs solution. We measured the spectra of the AuNPs before protease addition (0 min), just after protease addition (approximately 30 s) and then every 15 min up to 60 min. The measurement was repeated 3 times. We multiplied the value of absorbance at time t = 0 by the dilution factor to correct the changes in absorbance intensity caused by the initial protease addition. Absorbance was measured by UV-1700 spectrophotometer (Shimadzu, Kyoto, Japan). The scheme of AuNPs modification and chymotrypsin cleavage is presented in Figure 1.

2.3. Thickness Shear Mode (TSM) Method

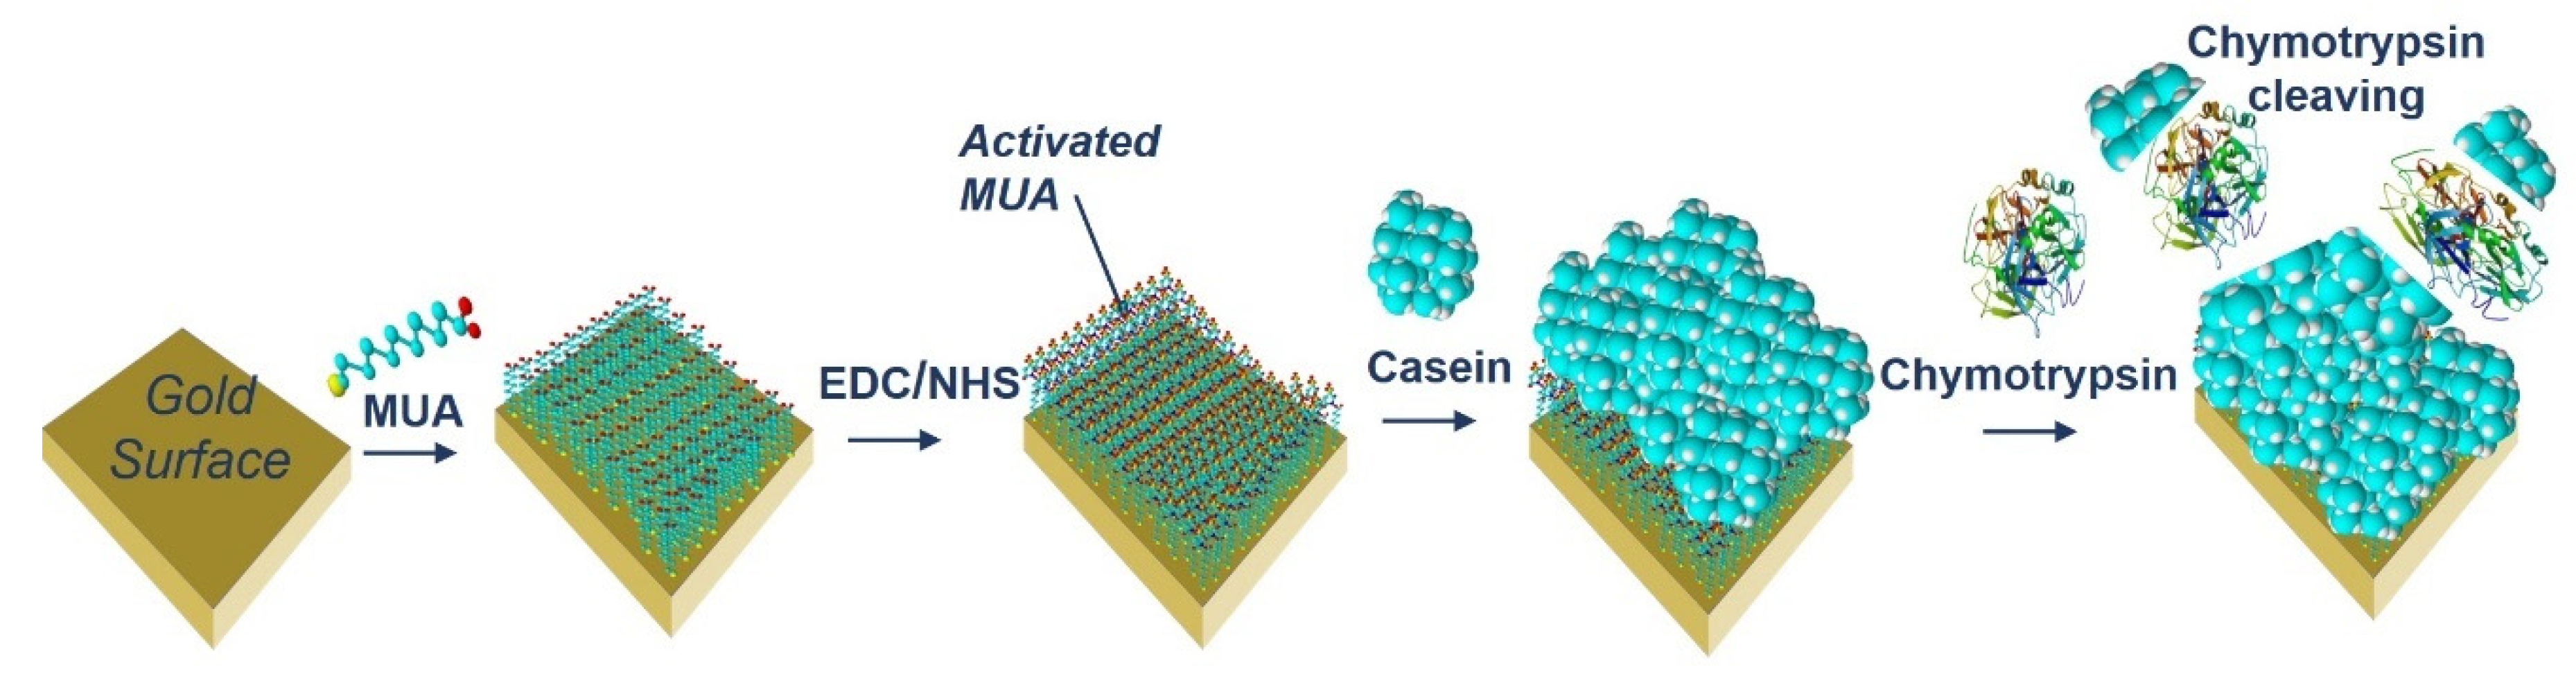
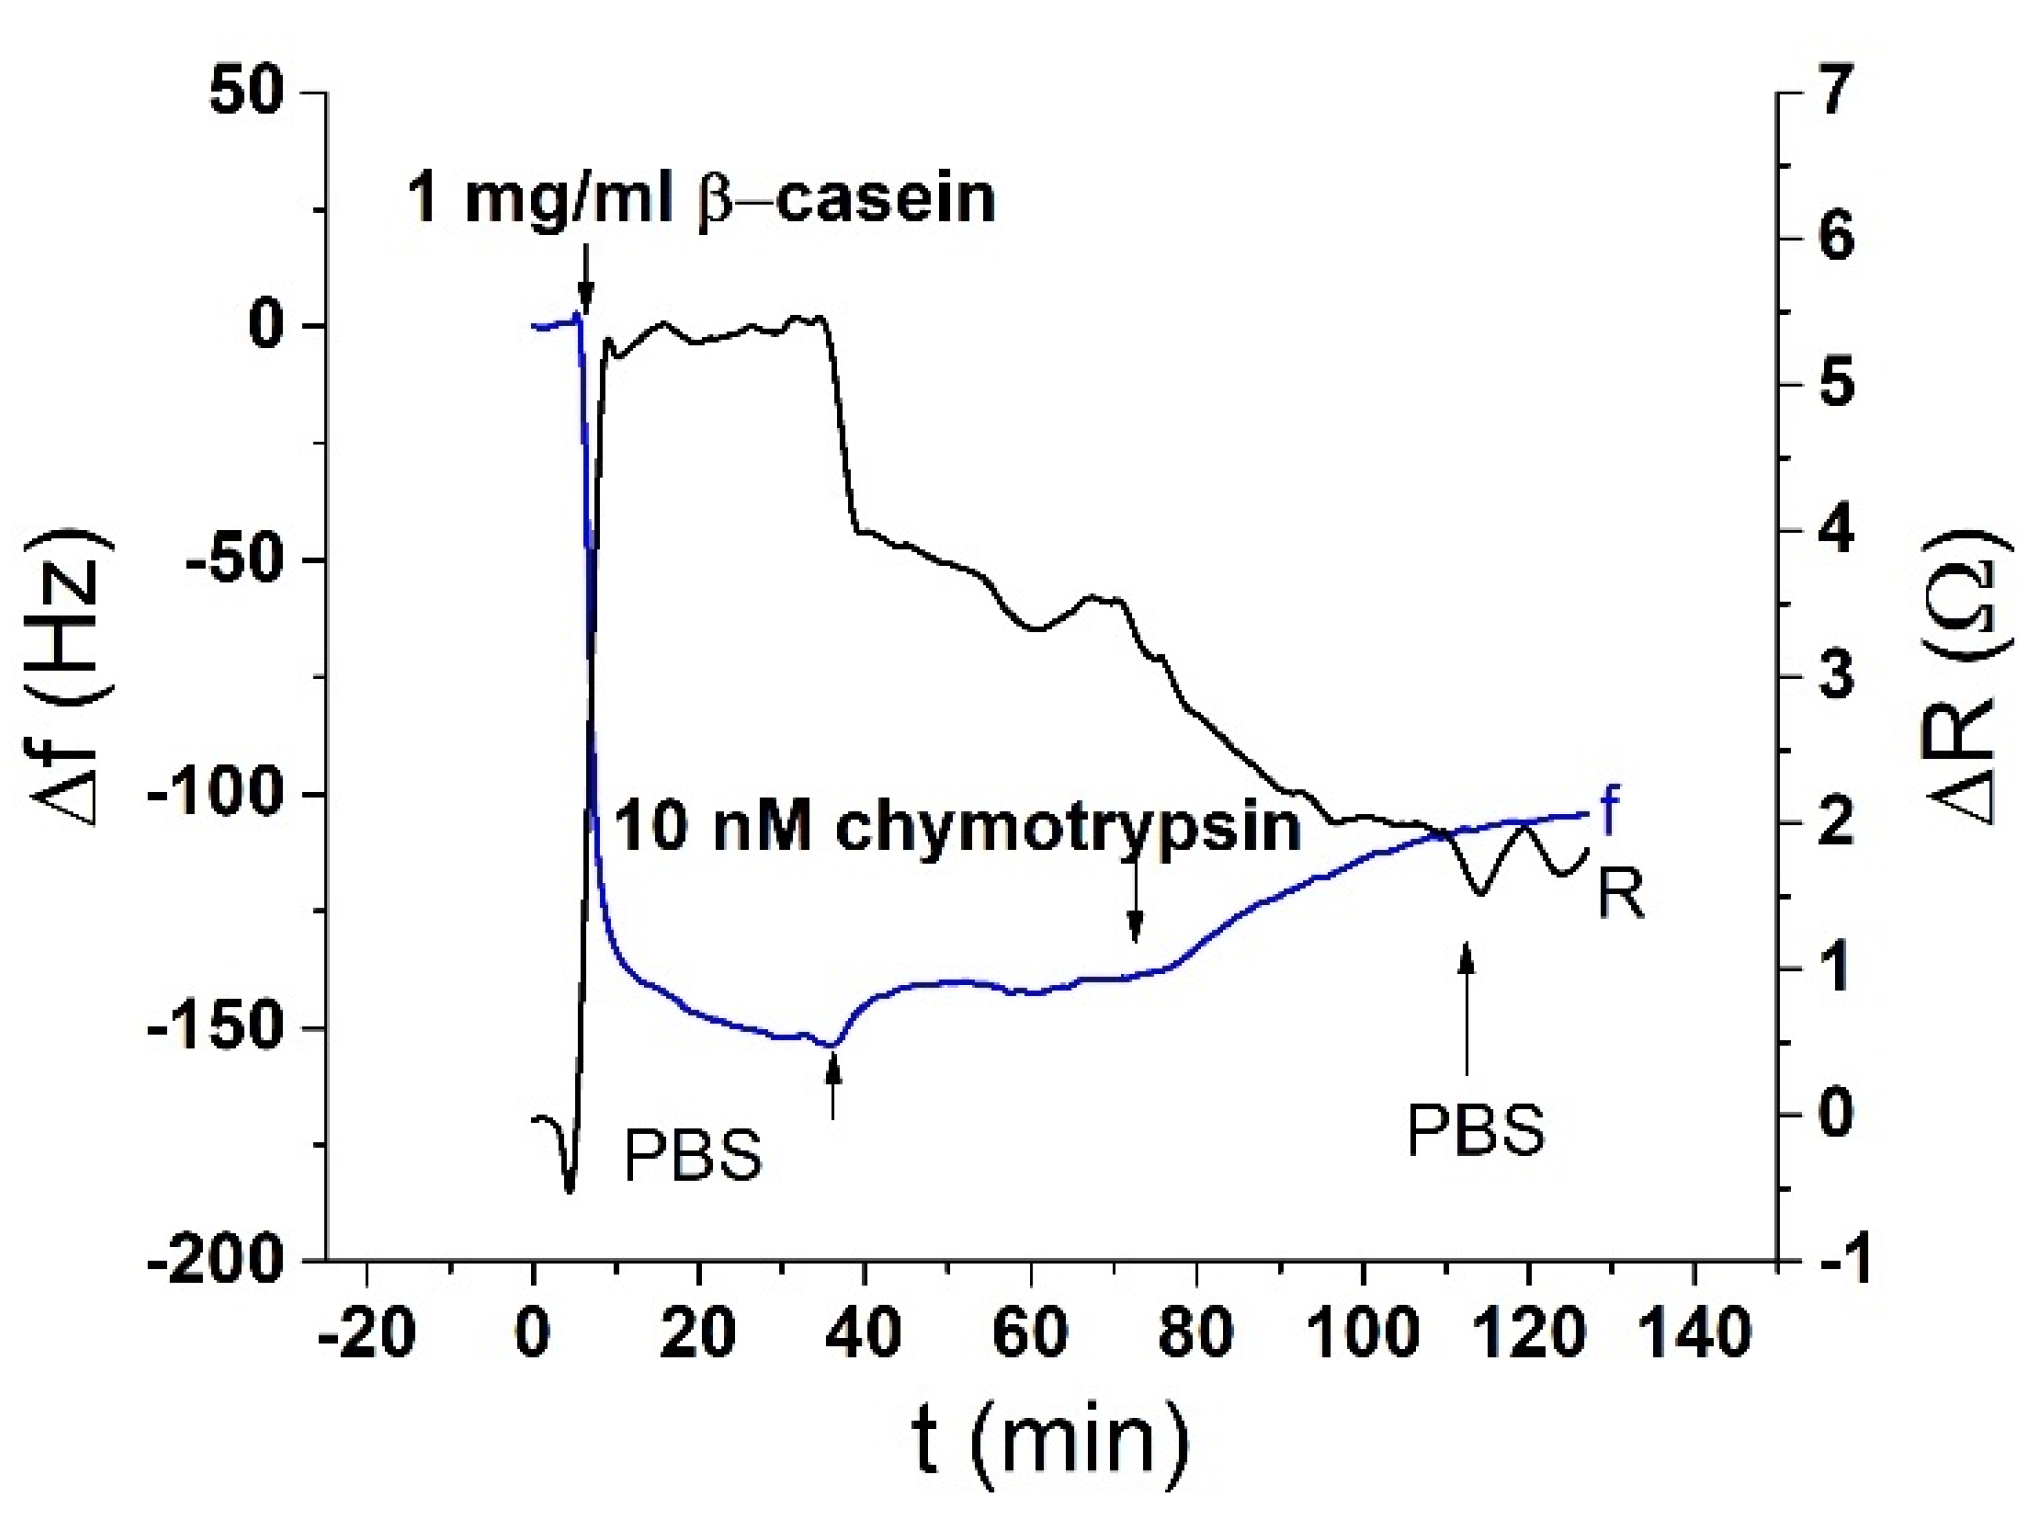
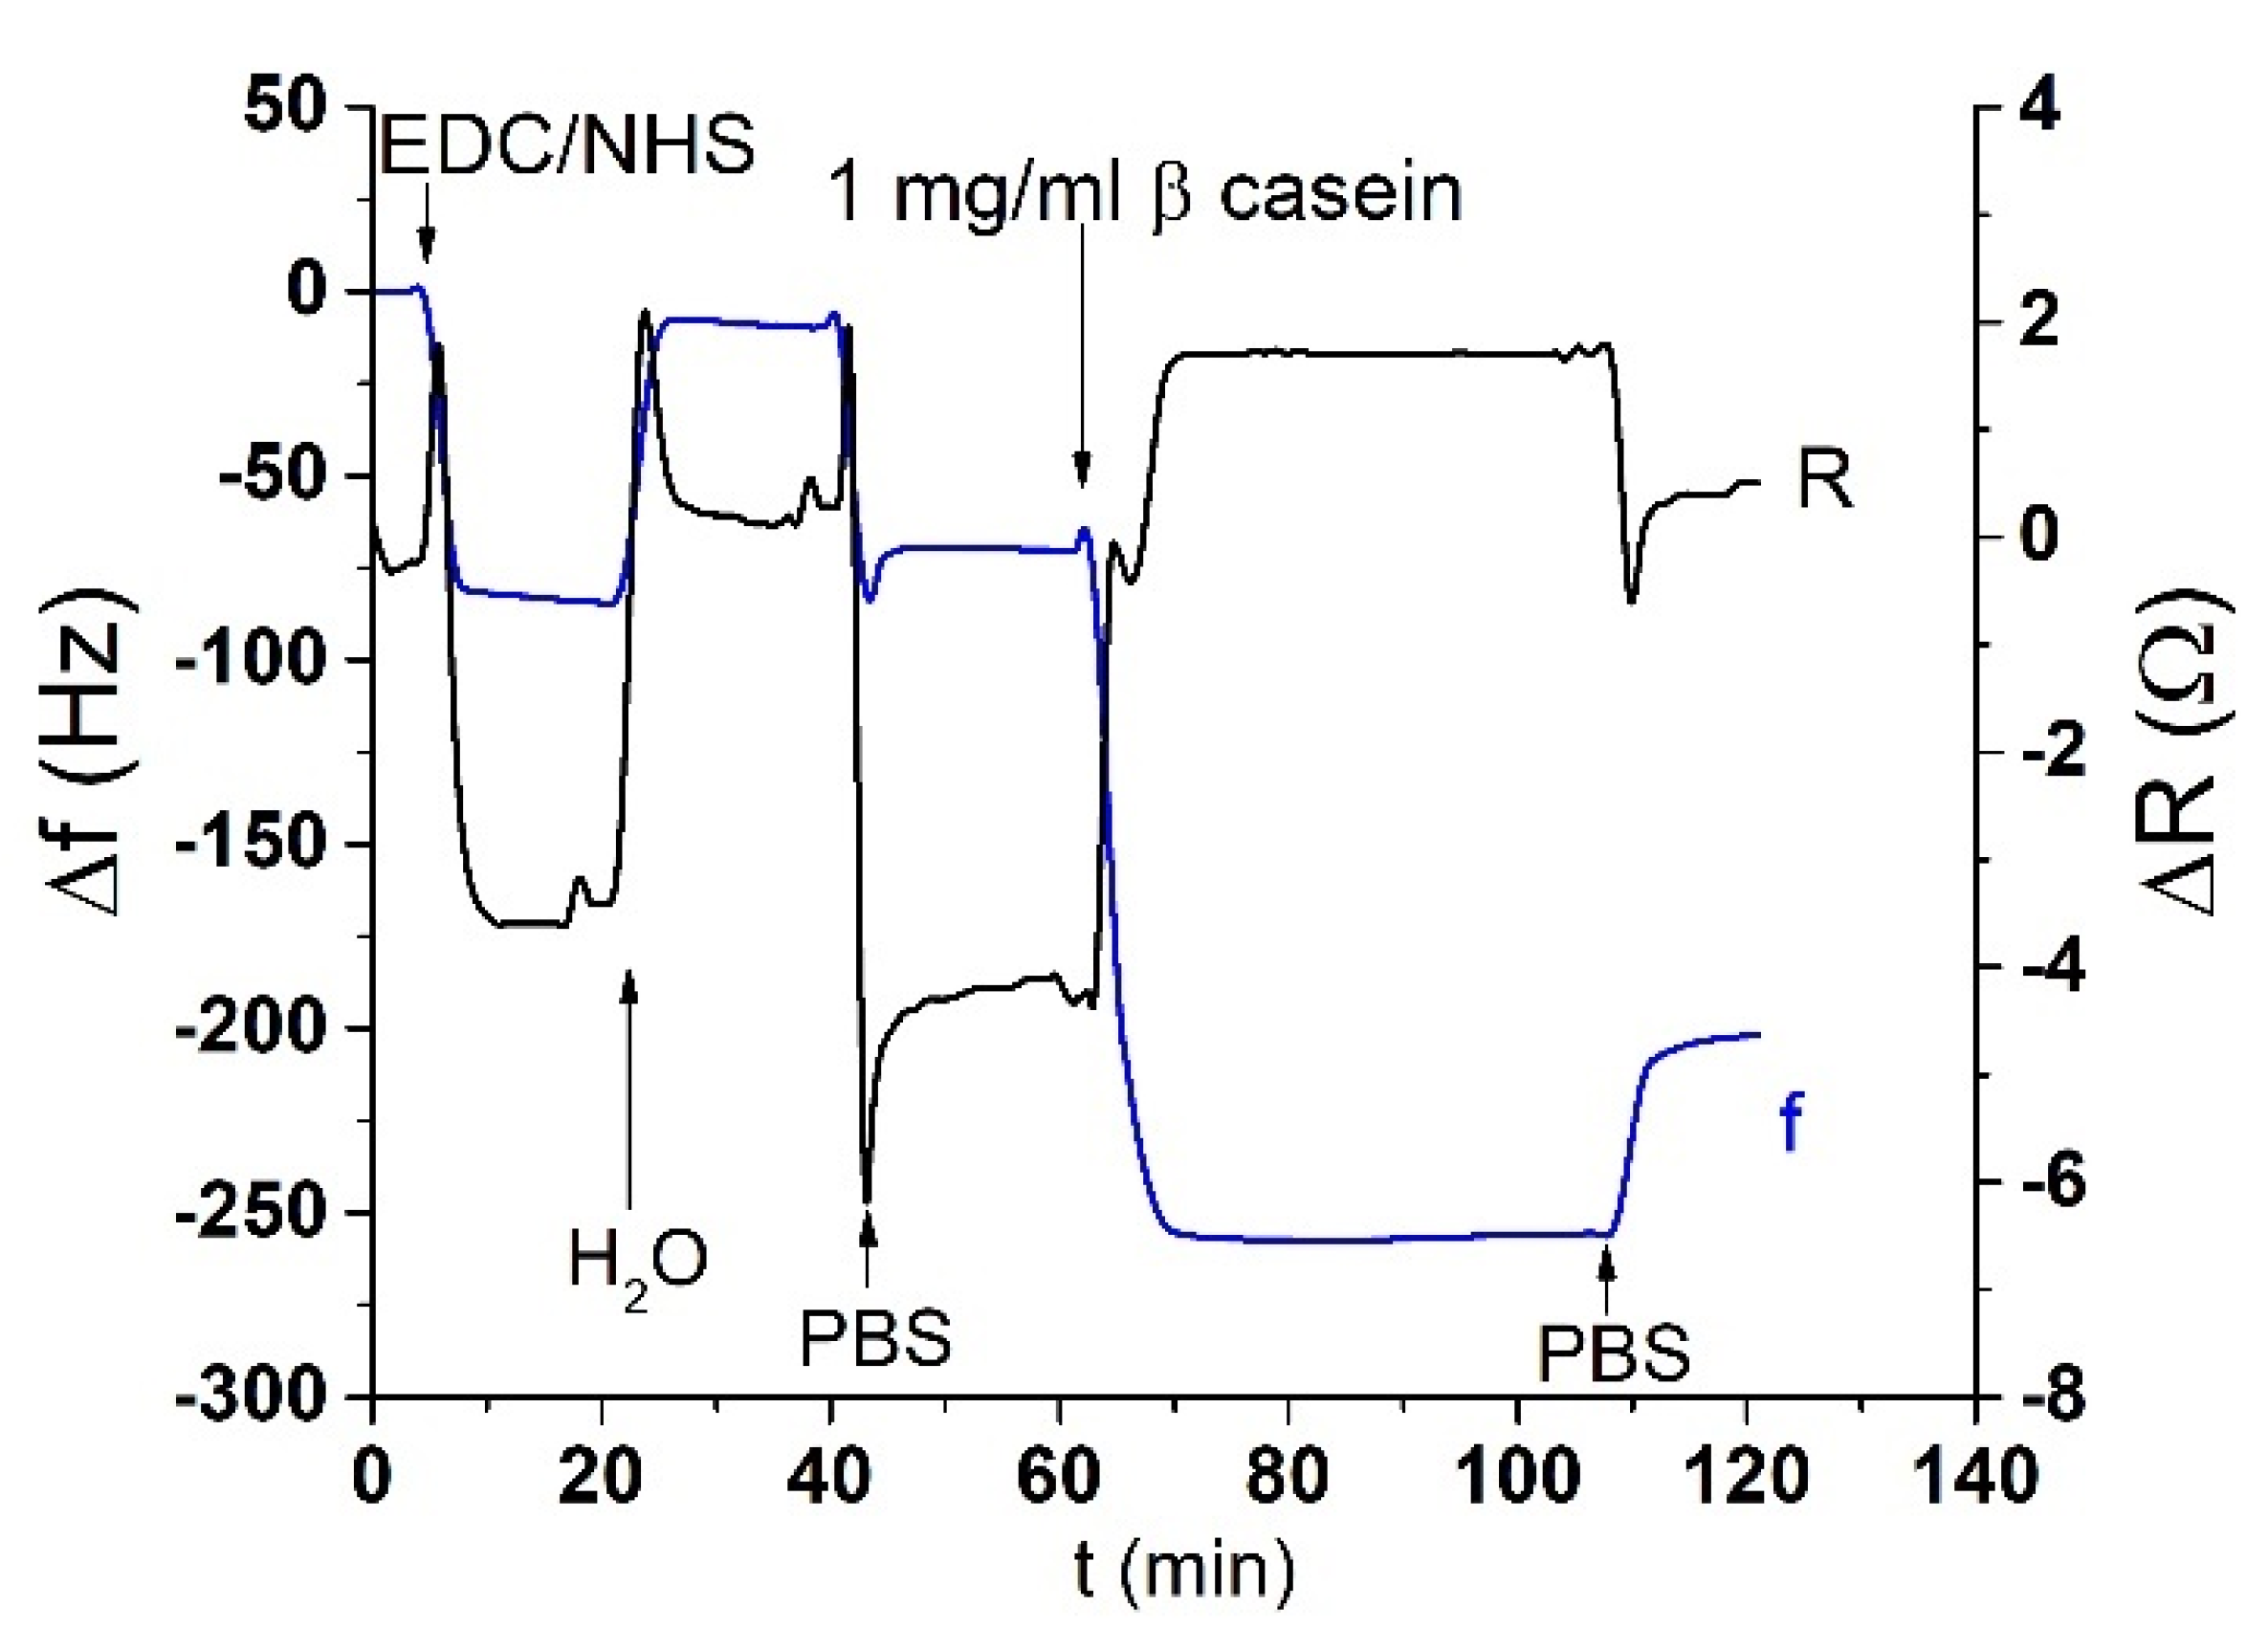
The acoustic TSM sensor was prepared on a gold quartz crystal layer for QCM (8 MHz, ICM, Oklahoma City, OK, USA, electrode area: A = 0.2 cm2). First, the crystal was carefully cleaned as follows. It has been exposed to a basic piranha solution (H2O2:NH3:H2O = 1:1:5 mL). The crystals were immersed for 25 min in this solution, in beakers in a water bath set at approximately 75 °C. Subsequently, the crystals were withdrawn, rinsed with distilled water, and returned to the beaker with a new dose of piranha solution on the reverse side of the crystal. This was repeated three times. On the last extraction, the crystals were washed three times with distilled water and then washed with ethanol and placed in a bottle with ethanol for storage at room temperature. We applied this procedure for each crystal and then used it repeatedly for measurement. The clean crystal was incubated overnight for 16–18 h at room temperature with 2 mM MUA dissolved in ethanol. MUA is a carboxylic acid with a sulfide group (SH). The sulfide moiety interacts with the gold on the crystal to form a self-assembled layer. After incubation, the crystal was washed with ethanol, distilled water, and 20 mM EDC and 50 mM NHS were applied for 25 min. These substances react with the carboxyl moiety of MUA and activate them to form a covalent bond with other amino acids. Subsequently, we cleaned the crystal again, dried it with nitrogen, and placed it in a cell. The cell was filled with PBS buffer using a Genie plus 2011 step pump (Kent Scientific, Torrington, CT, USA) at a flow rate of 200 μL/min. After filling the cell, we switched the flow to the rate of 50 μL/min. Then, 1 mg/mL of β-casein dissolved in PBS was then added to the MUA layer. After 35 min, only pure PBS was added to remove the unbound fragments. β-casein layer formation, and in some cases EDC/NHS layer activation, was recorded using an RQCM instrument (Maxtek, East Syracuse, NY, USA).
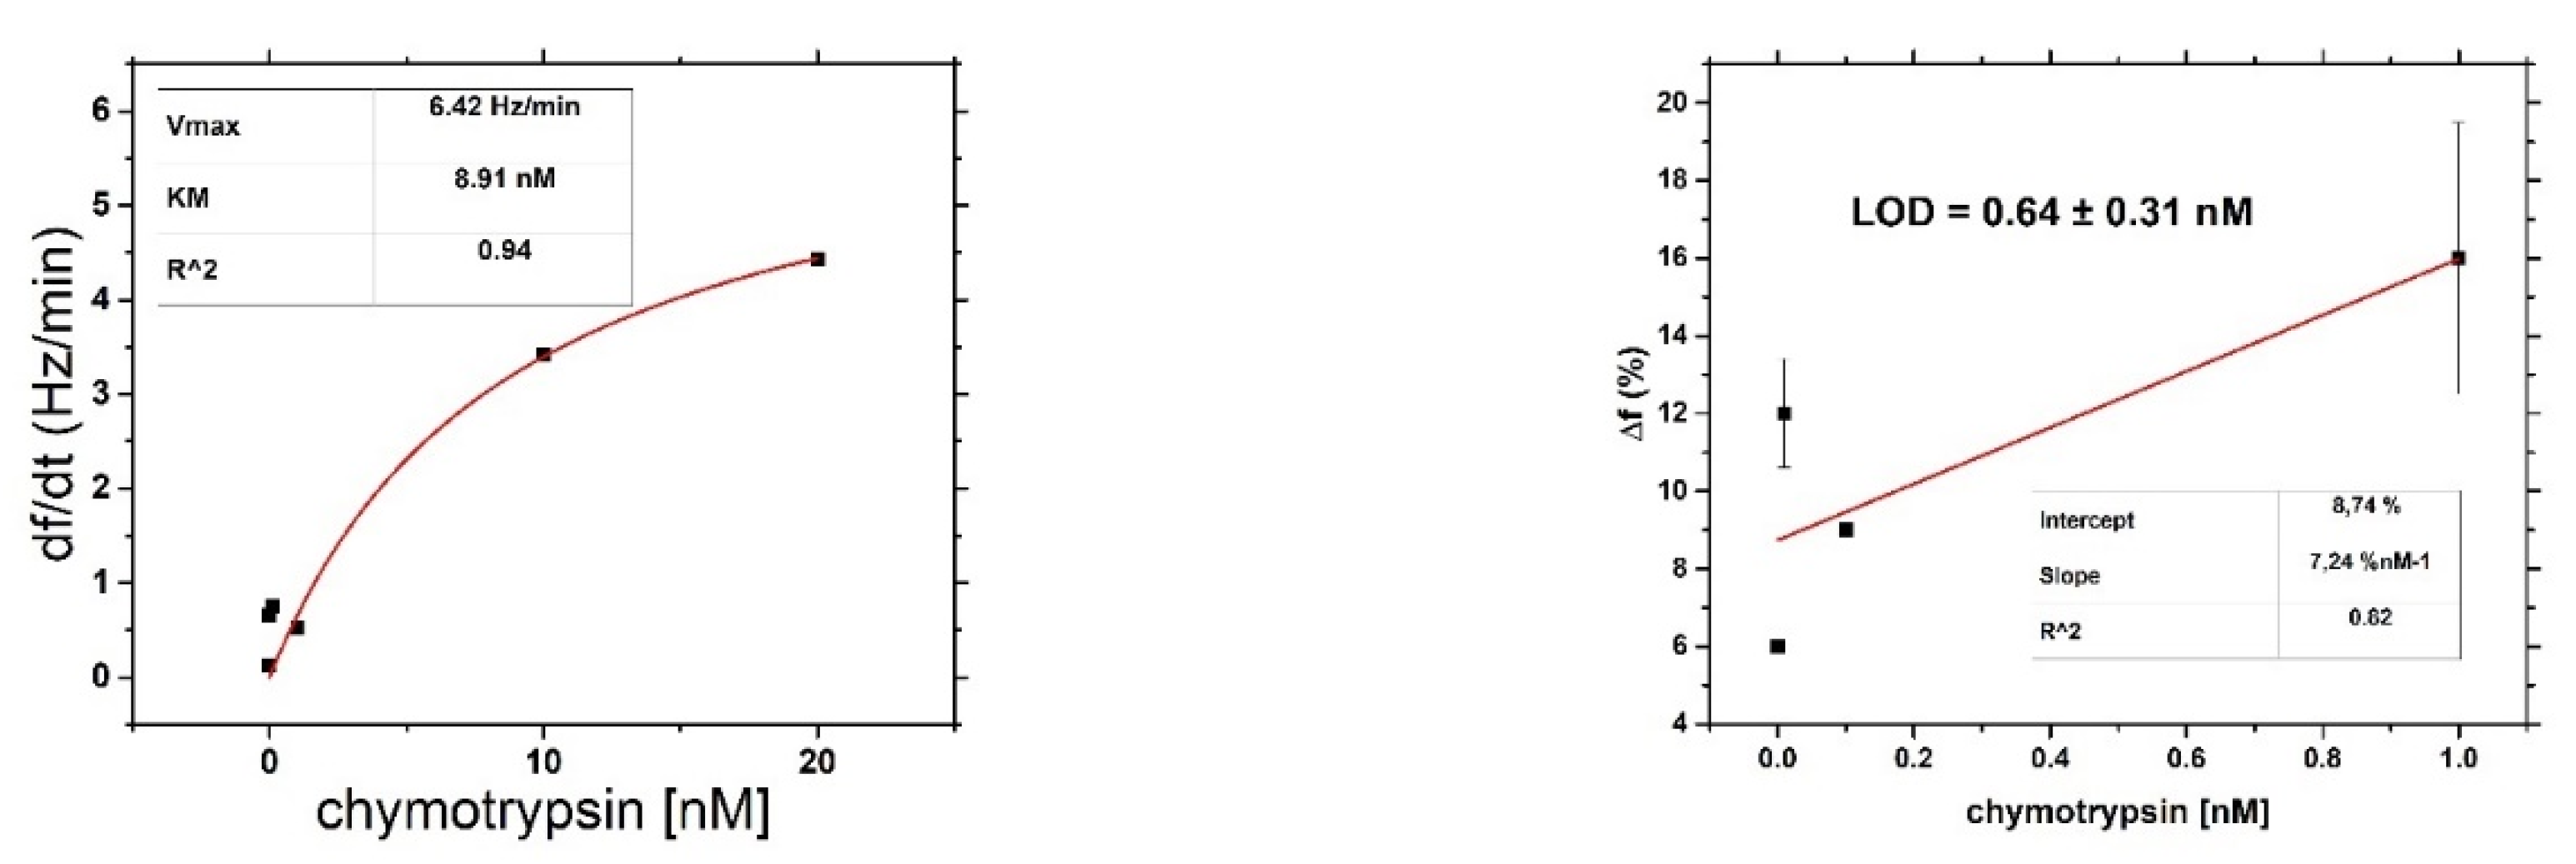
After binding of β-casein to the electrode surface and stabilizing the frequency (washing out all unbound residues), we applied chymotrypsin to the crystal at concentrations of 1 pM, 10 pM, 100 pM, 1 nM, 10 nM, and 20 nM. After 35 min of chymotrypsin application, the PBS was let into the cell until the resonant frequency stabilized. The change in resonant frequency from chymotrypsin application to stabilization in PBS was taken as the amount of casein cleaved from the layer. After lower concentrations (1 pM, 10 pM, 100 pM), we applied a higher concentration of chymotrypsin (at least at a concentration 2 orders of magnitude higher). In such measurements, we analyzed the degree of cleavage as the change in frequency from the initial state to a steady value. All measurements were performed at PBS, pH 7.4.
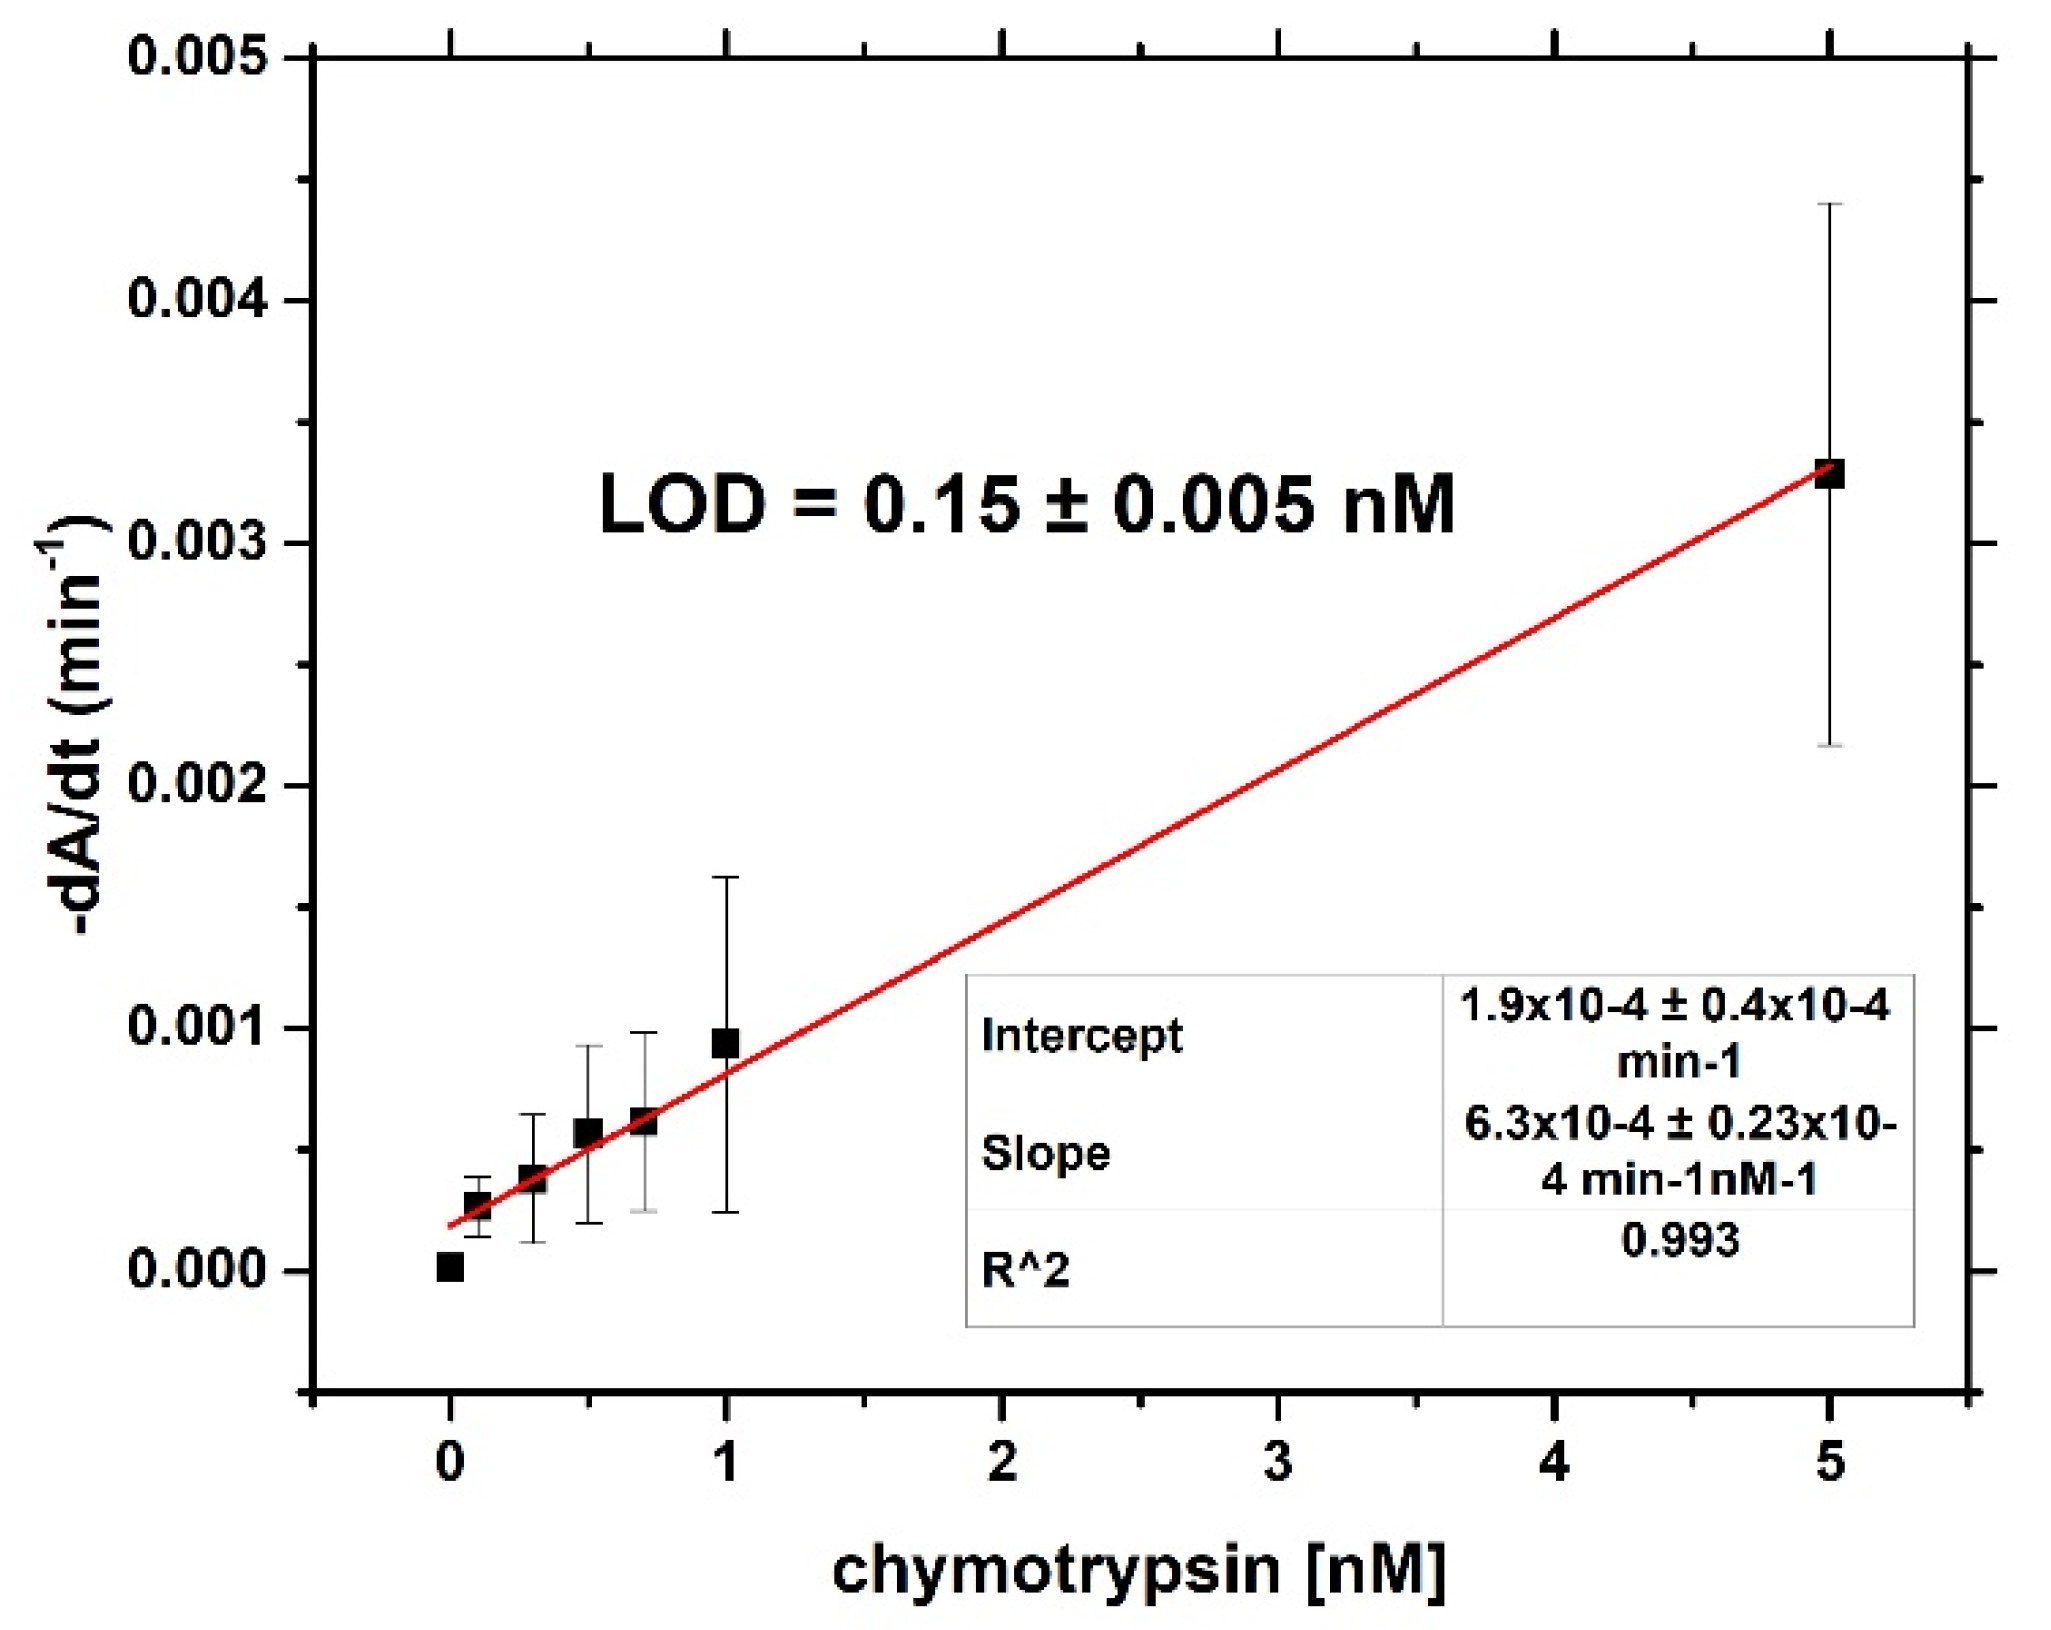
For both optical and gravimetric methods, the LOD was determined using equation: LOD = 3.3*(SD)/S, where SD is standard deviation of the sample with lowest concentration and S is slope calculated from fit of linear part of the calibration curve. Scheme of modification of TSM piezo and chymotrypsin cleavage is presented in Figure 2.

3. Results and Discussion

3.1. Detection of Chymotrypsin by Optical Method

We modified the gold nanoparticles with β-casein and subsequently with MCH. In Figure 3, we can see change in the absorption spectra after each step. After modification with β-casein, we can see shift of the maximum of absorbance by around 5 nm and a slight increase in absorbance. After addition of MCH the peak became broader and a significant shift of around 60 nm occurred. This suggests that the nanoparticles were getting closer together and starting to aggregate. This is due to the MCH replacing the β-casein protective layer and in turn making the nanoparticles closer to each other.
We measured the changes of absorbance spectra of AuNPs suspension during the chymotrypsin cleavage at 0 min, 0.5 min, 15 min, 30 min, and 60 min. Changes in spectra over time for two different concentration of chymotrypsin are presented in Figure 4. At relatively low concentration of chymotrypsin (0.1 nM), we did not observe significant changes of the absorbance (Figure 2a). However, at higher chymotrypsin concentration, around 10 nM, a substantial red shift of the spectra was observed (up to 615 nm). It can be also seen that the absorbance decreased with time, and after the maximum shifting enough, the absorbance started to decrease.
In Figure 5, we show the change of maximum position and absorbance in time for all concentrations.
For higher concentrations of chymotrypsin, the rate of absorbance increased. The maximum position of absorbance peak shifted with time and with increasing chymotrypsin concentration. However, for 5 and 10 nM chymotrypsin the maximum position stabilized around 615 nm. In order to prepare the calibration curve, we fit the change of absorbance with linear curve and then we differentiated this model numerically to obtain the values of dA/dt. We then used the dA/dt value at t = 0 min in order to obtain initial rate of the reaction. The calibration curve is presented in Figure 6.
We were able to use reverse Michaelis–Menten model to analyze the obtained data. However instead of substrate concentration, the concentration of chymotrypsin, c, has been used in this model: v = vmax [c/(KM + c)], where v and vmax are the rate and maximum rate of enzyme reaction, respectively, and KM is reverse Michaelis–Menten constant. In our case, v = dA/dt. However, this model was used only formally because of different restraints. The main assumptions of excess enzyme and limited substrate concentration was reversed in this case and we instead changed the concentration of the enzyme while the substrate was presented in excess; still, this method can be used with good approximation [20]. To calculate LOD, we used only part of the calibration curve from 0 to 5 nM, where the plot of dA/dt vs. c was almost linear. The results are shown in Figure 7.
The LOD for optical method of chymotrypsin detection was 0.15 ± 0.005 nM. This value is comparable to that of ELISA method, which is around 0.5 nM [10]. However, in contrast with ELISA which requires specific antibodies, the method based on AuNPs is much easier and faster. Detection of chymotrypsin takes only 30 min. In addition, once the AuNPs are prepared and modified by β-casein and MCH, only one step is necessary for detection of chymotrypsin concentration in the unknown sample. The disadvantage of this method is that only transparent samples can be used for detection. This restriction can be avoided using surface sensitive gravimetric method.

3.2. Detection of Chymotrypsin by Gravimetric Method

For the gravimetric method, we first modified the surface of the piezocrystal with adsorbed MUA by β-casein. By monitoring resonant frequency and motional resistance, it was possible to study all steps of the preparation of sensing surface. This is presented on Figure 8.
After the activation of carboxylic groups of MUA with EDC/NHS, the frequency shifted only slightly. After the β-casein addition, we can see a fast drop of resonant frequency of about 170 Hz. After changing the flow with buffer, it can be seen that the frequency increased due to the removal of nonspecifically bound β-casein. The resulting frequency shift after washing the surface corresponded to 120 Hz. From the Sauerbrey equation, we can calculate the change in mass on biosensor, which corresponded to about 165 ng of mass added. With the knowledge of the molecular weight of β-casein Mw = 24 kDa, we could calculate the number of moles on the sensor and surface density Г = 34.5 pM/cm2. From changes in motional resistance R, we could assess the change in viscous properties of the surface. Since the resistance decreases and increases proportionally to the change of frequency, the change in motional resistance is caused mainly just by added weight, so we could assume that the casein layer was not rigid.
After β-casein was bound to the surface, we could study its cleavage by different concentrations of chymotrypsin under flow condition for 35 min. An example of the changes of resonant frequency and dynamic resistance following the addition of 10 nM chymotrypsin are shown in Figure 9.
Based on the changes of the frequency, we constructed a calibration curve for different concentrations of chymotrypsin (Figure 10a), and for determination of LOD, we also present a calibration curve at a low concentration range where the dependence was almost linear (Figure 10b). The LOD for gravimetric method was 0.64 ± 0.31 nM. This value was higher than that reported in ELISA methods and the optical method used here. It is also more difficult to work with flow during the measurement and pressure changes caused by handling the flow cell can affect the results. This method is, however, robust to different components in the sample, such as added fat present naturally in milk. Timewise, this method takes similar time to spectrophotometric method.
It is also interesting to compare the KM values determined in optical and gravimetric experiments. From the results presented above, it can be seen that KM value in the case of AuNPs-based optical assay (3.89 nM) was about two times lower in comparison with those based on gravimetric measurements (8.91 nM). This can be evidence of better access of β-casein substrate for chymotrypsin in AuNPs in comparison with those immobilized at the surface of TSM transducer. This effect can probably explain the lower LOD for optical method of chymotrypsin detection with those based on TSM.

4. Conclusions

We determined LOD for both gravimetric (LOD = 0.64 ± 0.31 nM) and optical (LOD = 0.15 ± 0.005 nM) methods. Optical method showed the best value of LOD, even when compared to commercial ELISA (LOD = 0.5 nM). In terms of time, both methods were comparable and took around 30 min for chymotrypsin determination if the sensors were prepared beforehand. Both methods required sensing assay preparation overnight, however in both cases the AuNPs or gravimetric sensors could be stored for a long time (more than one month) at 4 °C. In terms of difficulty in operation, the optical methods offered the easier way to measure chymotrypsin. With prepared AuNPs modified by β-casein and MCH, the optical method required only one step of protease detection based on measurement of absorbance changes after 30 min, which was easier in comparison with ELISA. In terms of sample usage, the optical method needed only 50 μL of sample, while the gravimetric method used around 2 mL. One of the advantages of the gravimetric method is that it is more robust to “impurities” in the sample. If the gold crystal is correctly modified, the gravimetric method can be used with natural, not transparent samples containing fat, minerals, or other proteins, just like in milk. In contrast, optical assay requires a transparent sample. Both methods have a distinct advantage and disadvantage over ELISA concerning their specificity. In contrast with ELISA, the optical and gravimetric assay are not specific to the protease. In some cases, this problem can be solved by using specific peptide substrate [13]. This problem could also be overcome using machine learning, as evident in the work of Tatarko et al. [14]. In conclusion, both optical and gravimetric methods have advantages and disadvantages in detecting chymotrypsin or other proteases and could represent a novel approach for practical application in the food industry and in medicine for real-time monitoring of the protease activity.

Author Contributions

Conceptualization, T.H. and I.N.I.; methodology, I.P.; formal analysis, I.P.; investigation, I.P.; resources, T.H. and I.N.I.; writing—original draft preparation, I.P.; writing—review and editing, T.H. and I.N.I.; visualization, I.P.; supervision, T.H. and I.N.I.; project administration, T.H.; funding acquisition, T.H. and I.N.I. All authors have read and agreed to the published version of the manuscript.

Funding

A portion of this research was conducted at the Center for Nanophase Materials Sciences, which is a DOE Office of Science User Facility, project No. CNMS2018-293. This work was funded under the European Union’s Horizon 2020 research and innovation program through the Marie Skłodowska-Curie grant agreement No 690898 and by Science Agency VEGA, project No. 1/0419/20.

Conflicts of Interest

The authors declare no conflict of interest. The funders had no role in the design of the study; in the collection, analyses, or interpretation of data; in the writing of the manuscript; or in the decision to publish the results.

References

  1. Bond, J.S. Proteases: History, discovery, and roles in health and disease. J. Biol. Chem. 2019, 294, 1643–1651. [Google Scholar] [CrossRef] [PubMed]
  2. Lojda, Z. The importance of protease histochemistry in pathology. Histochem. J. 1985, 17, 1063–1089. [Google Scholar] [CrossRef] [PubMed]
  3. Antalis, T.M.; Shea-Donohue, T.; Vogel, S.N.; Sears, C.; Fasano, A. Mechanisms of disease: Protease functions in intestinal mucosal pathobiology. Nat. Clin. Pract. Gastroenterol. Hepatol. 2007, 4, 393–402. [Google Scholar] [CrossRef] [PubMed]
  4. Appel, W. Chymotrypsin: Molecular and catalytic properties. Clin. Biochem. 1986, 19, 317–322. [Google Scholar] [CrossRef]
  5. Tomlinson, G.; Shaw, M.C.; Viswanatha, T. Chymotrypsin(s). Methods Enzymol. 1974, 34, 415–420. [Google Scholar] [PubMed]
  6. Ismail, B.; Nielsen, S.S. Invited rieview: Plasmin protease in milk: Current knowledge and relevance to dairy industry. J. Dairy Sci. 2010, 93, 4999–5009. [Google Scholar] [CrossRef] [PubMed]
  7. Harris, G.S. Alpha-Chymotrypsin in cataract surgery. Can. Med. Assoc. J. 1961, 85, 186–188. [Google Scholar] [PubMed]
  8. Skacel, M.; Ormsby, A.H.; Petras, R.E.; McMahon, J.T.; Henricks, W.H. Immunohistochemistry in the differential diagnosis of acinar and endocrine pancreatic neoplasms. Appl. Immunohistochem. Mol. Morphol. 2000, 8, 203–209. [Google Scholar] [CrossRef] [PubMed]
  9. Chen, L.; Daniel, R.M.; Coolbear, T. Detection and impact of protease and lipase activities in milk and milk powders. Int. Dairy J. 2003, 13, 255–275. [Google Scholar] [CrossRef]
  10. Chymotrypsin ELISA Kit. Available online: http://img2.creative-diagnostics.com/pdf/DEIA10041,Chymotrypsin.pdf (accessed on 7 October 2020).
  11. Kankare, J. Sauerbrey equation of quartz crystal nicrobalance in liquid medium. Langmuir 2002, 18, 7092–7094. [Google Scholar] [CrossRef]
  12. Gronewold, T.M. Surface acoustic wave sensors in the bioanalytical field: Recent trends and challenges. Anal. Chim. Acta 2007, 603, 119–128. [Google Scholar] [CrossRef] [PubMed]
  13. Poturnayova, A.; Castillo, G.; Subjakova, V.; Tatarko, M.; Snejdarkova, M.; Hianik, T. Optimization of the cytochrome c detection by acoustic and electrochemical methods based on aptamer sensors. Sens. Actuators B Chem. 2017, 228, 817–827. [Google Scholar] [CrossRef]
  14. Tatarko, M.; Muckley, E.; Subjakova, V.; Goswami, M.; Sumpter, B.; Hianik, T.; Ivanov, I. Machine learning enabled acoustic detection of sub-nanomolar concentration of trypsin and plasmin in solution. Sens. Actuators B Chem. 2018, 272, 282–288. [Google Scholar] [CrossRef]
  15. Huang, X.; El-Sayed, M.A. Gold nanoparticles: Optical properties and implementations in cancer diagnosis and photothermal therapy. J. Adv. Res. 2010, 1, 13–28. [Google Scholar] [CrossRef]
  16. Diouani, M.F.; Ouerghi, O.; Belgacem, K.; Sayhi, M.; Laouini, D. Casein-conjugated gold nanoparticles for amperometric detection of leishmania infantum. Biosensors 2019, 9, 68. [Google Scholar] [CrossRef] [PubMed]
  17. Chen, G.; Yusheng, X.; Zhang, H.; Wang, P.; Cheung, H.; Yang, M.; Sun, H. A general colorimetric method for detecting protease activity based on peptide-induced gold nanoparticle aggregation. RSC Adv. 2014, 4, 6560–6563. [Google Scholar] [CrossRef]
  18. Guarise, C.; Pasquato, L.; De Filippis, V.; Scrimin, P. Gold nanoparticles-based protease assay. Proc. Natl. Acad. Sci. USA 2006, 103, 3978–3982. [Google Scholar] [CrossRef] [PubMed]
  19. Kimling, J.; Maier, M.; Okenve, B.; Kotaidis, V.; Ballot, H.; Plech, A. Turkevich method for gold nanoparticle synthesis revisited. J. Phys. Chem. B 2006, 110, 15700–15707. [Google Scholar] [CrossRef] [PubMed]
  20. Románszki, L.; Tatarko, M.; Jiao, M.; Keresztes, S.; Hianik, T.; Thompson, M. Casein probe-based fast plasmin determination in the picomolar range by an ultra-high frequency acoustic wave biosensor. Sens. Actuators B Chem. 2018, 275, 206–214. [Google Scholar] [CrossRef]
Figure 1. Scheme of gold nanoparticles (AuNPs) modification and chymotrypsin cleavage.
Proceedings 60 00042 g001
Figure 2. Scheme of modification of the piezocrystal and chymotrypsin cleavage.
Proceedings 60 00042 g002
Figure 3. Absorption spectra for gold nanoparticles (AuNP) prepared by Turkevich method: unmodified (black), modified by β-casein (red), and further modified by MCH (blue).
Proceedings 60 00042 g003
Figure 4. Changes of absorbance spectra of the suspension of AuNPs modified by β-casein and MCH in time for (a) 0.1 nM chymotrypsin and (b) 10 nM chymotrypsin.
Proceedings 60 00042 g004
Figure 5. (a) Changes in the value of absorbance peak vs. time for different chymotrypsin concentrations; (b) changes in maximum position of absorbance peak vs. time for different chymotrypsin concentration in a suspension of AuNPs modified by β-casein and MCH.
Proceedings 60 00042 g005
Figure 6. Calibration curve for chymotrypsin with reverse Michaelis–Menten model for optical method. dA/dt is numerical derivation of linear model of absorbance change at time t = 0 and corresponds to the rate of enzyme reaction.
Proceedings 60 00042 g006
Figure 7. Linear part of calibration curve −dA/dt vs. concentration of chymotrypsin for calculation of limit of detection (LOD).
Proceedings 60 00042 g007
Figure 8. Kinetics of resonant frequency, f (blue), and dynamic resistance, Rm (black), changes during modification of piezocrystal by β-casein. The carboxylic groups of MUA that were chemisorbed at the crystal were first activated by EDC/NHS. The moments of addition of various compounds as well as washing the surface by water and PBS are shown by arrows.
Proceedings 60 00042 g008
Figure 9. Kinetics of resonant frequency, f (blue), and dynamic resistance, R (black), changes following modification of piezocrystal by β-casein and addition of 10 nM of chymotrypsin.
Proceedings 60 00042 g009
Figure 10. (a) Calibration curve for chymotrypsin fitted by reverse Michaelis–Menten model, v = df/dt was the first derivation of frequency obtained from kinetic curve. (b) Calibration curve: changes in frequency (Δf = (Δfchymo)/(Δfcasein)*100 where Δfchymo is change in frequency after chymotrypsin cleavage and fcasein is frequency change after formation of β-casein layer) vs. lower chymotrypsin concentration range for determination of LOD.
Proceedings 60 00042 g010
Publisher’s Note: MDPI stays neutral with regard to jurisdictional claims in published maps and institutional affiliations.

