1. Introduction
Breast cancer remains a major cause of death worldwide, with several challenges at various stages of the clinical process, ranging from the initial diagnosis to treatments and therapies. Triple negative breast cancer (TNBC) is particularly difficult to treat given its aggressively metastatic nature, and the absence of common receptors that hormone therapies could target [
1,
2]. Although extensive work has been done with regard to the recording of individual ion channels in cancer cells using patch-clamp approaches, there are few studies at a cell population level. Studies examining cancer cell populations offer the possibility to investigate membrane currents and voltages without the application of external stimulus. These models also better represent the in vivo reality of tumour proliferation, invasion, and metastasis, since these processes typically involve a cell cohort. A combination of population and individual cell recordings is therefore crucial for examining processes associated with metastatic cancer cells.
One approach for detecting the extracellular activity of cancer cell cohorts is using cell-based biosensors. These devices enable the non-invasive monitoring of cellular behaviour through the detection of various electrochemical signals, such as current, potential, capacitance, and impedance, corresponding to biological processes involving ion transfer and reduction/oxidation reactions. Cell-based biosensors have therefore been used for studies of cell type, concentration, viability, proliferation, and apoptosis [
3,
4,
5]. One cell-based biosensor of interest for electrically monitoring cells is the micro-electrode array (MEA). MEAs are electrochemical biosensors that typically consist of planar electrodes embedded in an insulating substrate and in close contact with cells in culture medium, enabling the detection of extracellular activity. Research in this field has focused primarily on improving spatial resolution and coupling between cells and electrodes [
6,
7], leading to an increase in electrode density and decrease in electrode area. Some work has also focused on functionalising the surface of such devices with antibodies and other compounds to target specific extracellular analytes, rather than cells [
8,
9]. Commercially available MEAs, to decode cells’ extracellular activity, typically consist of several, small area electrodes with diameters ranging between 10 and 100 µm [
6]. This results in a very large electrode impedance, for recording high frequency events in the kHz range typically seen in neuronal firing, whilst filtering out low frequency content. To overcome this issue, we employed large area electrodes with areas in the order of mm
2 to minimise impedance, and hence maximise the Helmholtz–Gouy–Chapman double-layer capacitance [
10,
11].
Preliminary population-level recordings from aggressively metastatic breast cancer cells, modelled by the MDA-MB-231 cell line, indicate two prominent patterns of electrical activity [
10], one consisting of fast, asynchronous bursts originating from voltage-gated sodium channels (VGSCs) and another with a slower pulse duration, resembling random telegraph signal (RTS) noise. In the time domain, this sort of noise consists of step-like transitions between two or more levels, showing a square-like shape. This has been previously observed and investigated in the context of metal oxide semiconductor (MOS) devices, where they correspond to the trapping and releasing of charge carriers at the silicon/oxide interface or in the oxide itself [
12]. It has been proposed that two-level RTS noise in MOS devices can be modelled as the combination of a Markovian process and background Gaussian noise [
12]. RTS noise has also been observed in chemical reactions and individual ion channel recordings [
13]. Ionic fluxes through cell membranes and biochemical pathways also showed an underlying 1/
f noise pattern [
14,
15].
In this study, we built upon prior two-level RTS analyses to examine multi-level RTS signalling recorded from MDA-MB-231 cells using an ultra-low noise biosensor based on a large-area MEA. We developed a state machine-based algorithm that generates a “clean” RTS model from windows of recorded data and computed thresholds. This was then used to generate a Markov chain for each window, with the probabilities of remaining in and switching states, which illustrates how the RTS behaviour evolves over recordings of 1–2 h. This approach enables the extraction of pulse durations, as well as the separation of RTS noise and 1/f-like background noise, consistent with prior research on 1/f noise in ion channels.
2. Materials and Methods
MDA-MB-231 cells were cultured in Dulbecco’s modified Eagle’s medium (DMEM; Sigma, St. Louis, MO, USA) containing 5% v/v foetal bovine serum (FBS; Gibco) and 4 mM L-Glutamine (Sigma), and grown according to the protocol described in [
10]. The cells were harvested once a confluence of 70% had been reached, and a cell density of 1 × 10
6 cells/mL was deposited on the proposed MEA device for each experiment.
The MEA device used for conducting the RTS recordings consisted of a silicon dioxide substrate containing four pairs of planar, circular electrodes of 2 mm
2 area. The device was manufactured by evaporating a 10 nm layer of chromium followed by a 50 nm layer of gold through a shadow mask with the desired electrode pattern. At this stage, the electrodes were also connected to measurement pads using strip lines of negligible area. In each pair of measurement electrodes, one of the electrodes acted as a measuring electrode, and the other as a counter electrode. An equivalent circuit model can be used to describe the interface between the electrodes and cells, as described in [
11]. Given the large electrode area, the recorded signal corresponds to the sum of each active, adherent cell on the electrode surface. Uncorrelated activity therefore appears as noise and low amplitude, asynchronous spikes.
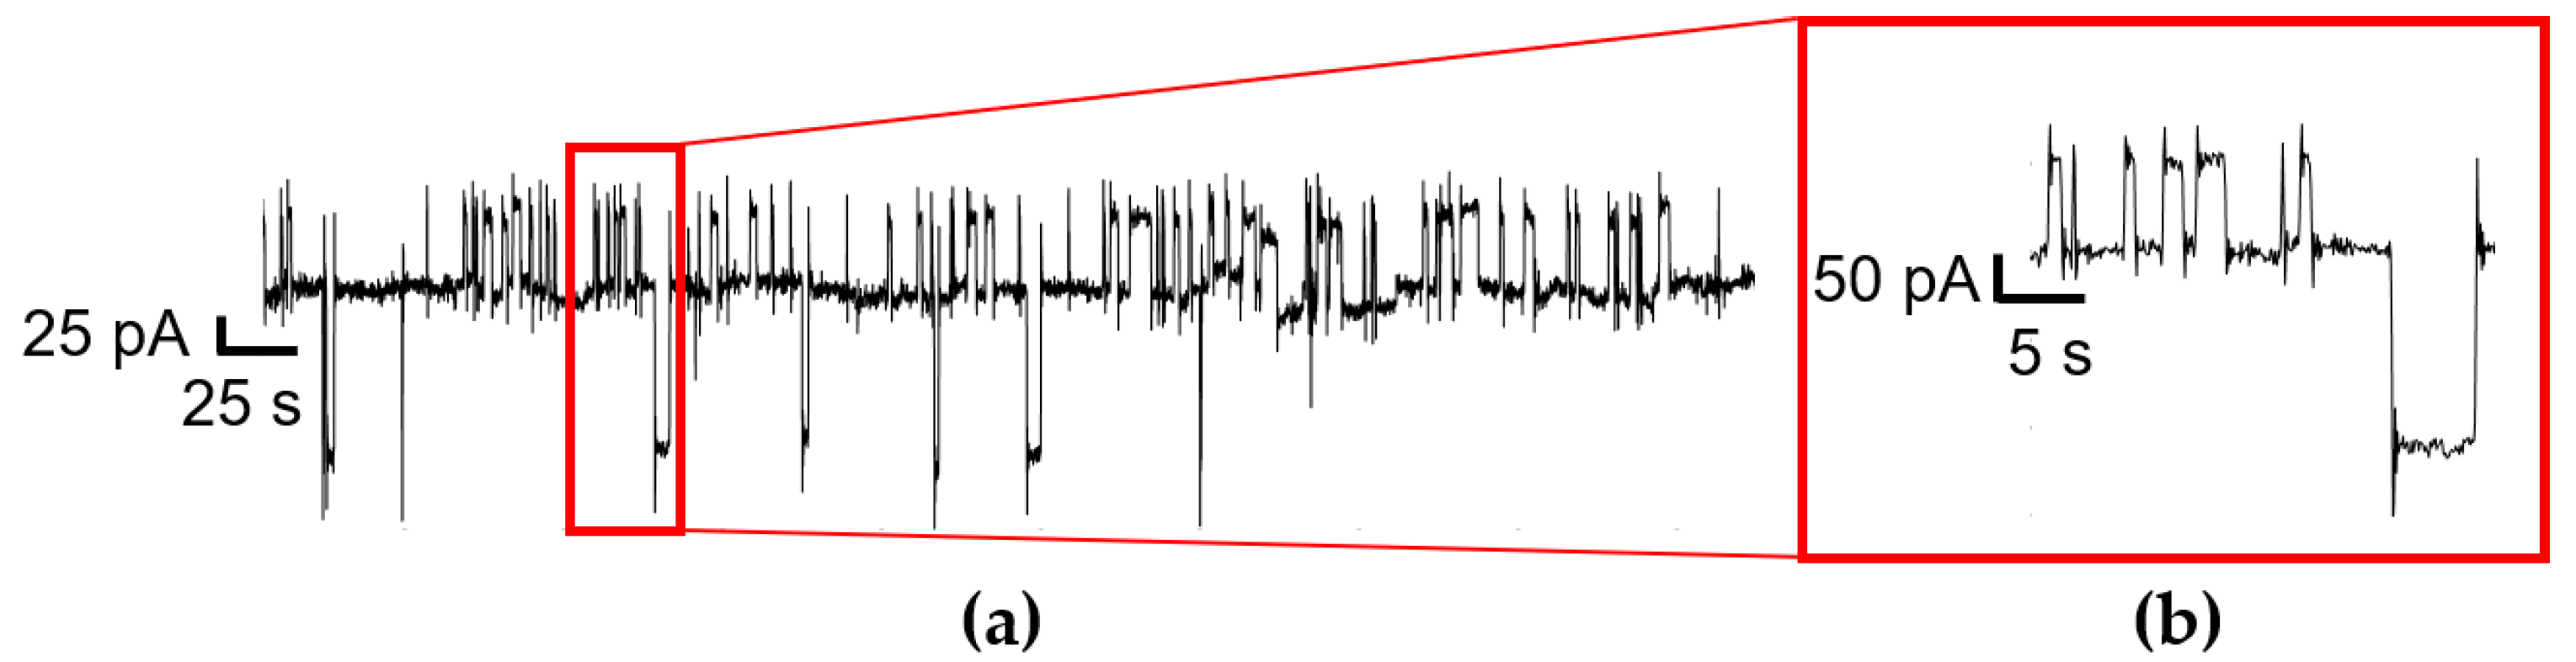
The electrical current generated by MDA-MB-231 cell populations was recorded over time, for up to 72 h, with all recordings repeated in three independent experiments. Then, 1–2 h sections of RTS data were extracted, detrended, separated into rectangular 5 min windows, and bandpass filtered in preparation for the generation of RTS models. A state machine was used instead of a single point detector, given that the overshoots and faster pulses did not constitute RTS activity but would be erroneously detected using this approach. These overshoots can be seen in
Figure 1 on the rising and falling edges of each RTS pulse and arise from low pass filtering in the recording equipment. The sparse, asynchronous spikes correspond to uncorrelated cell activity. Therefore, a minimum time duration of 0.5 s for RTS pulses was assumed, and the state machine would only switch to a different RTS levels if sufficient subsequent samples were seen at that level.
Thresholding Approach
Standard signal detection theory was used to determine the thresholds for transitioning between RTS states, as described in [
16,
17]. Following this analysis, 1/
f noise is considered to have a Gaussian probability density function (PDF) as follows:
Thus, the PDF of the overall signal, containing RTS and 1/
f noise, is the weighted sum of two Gaussian distributions with different means:
where
a and
b correspond to two RTS levels. The probabilities
q and
p for two states are:
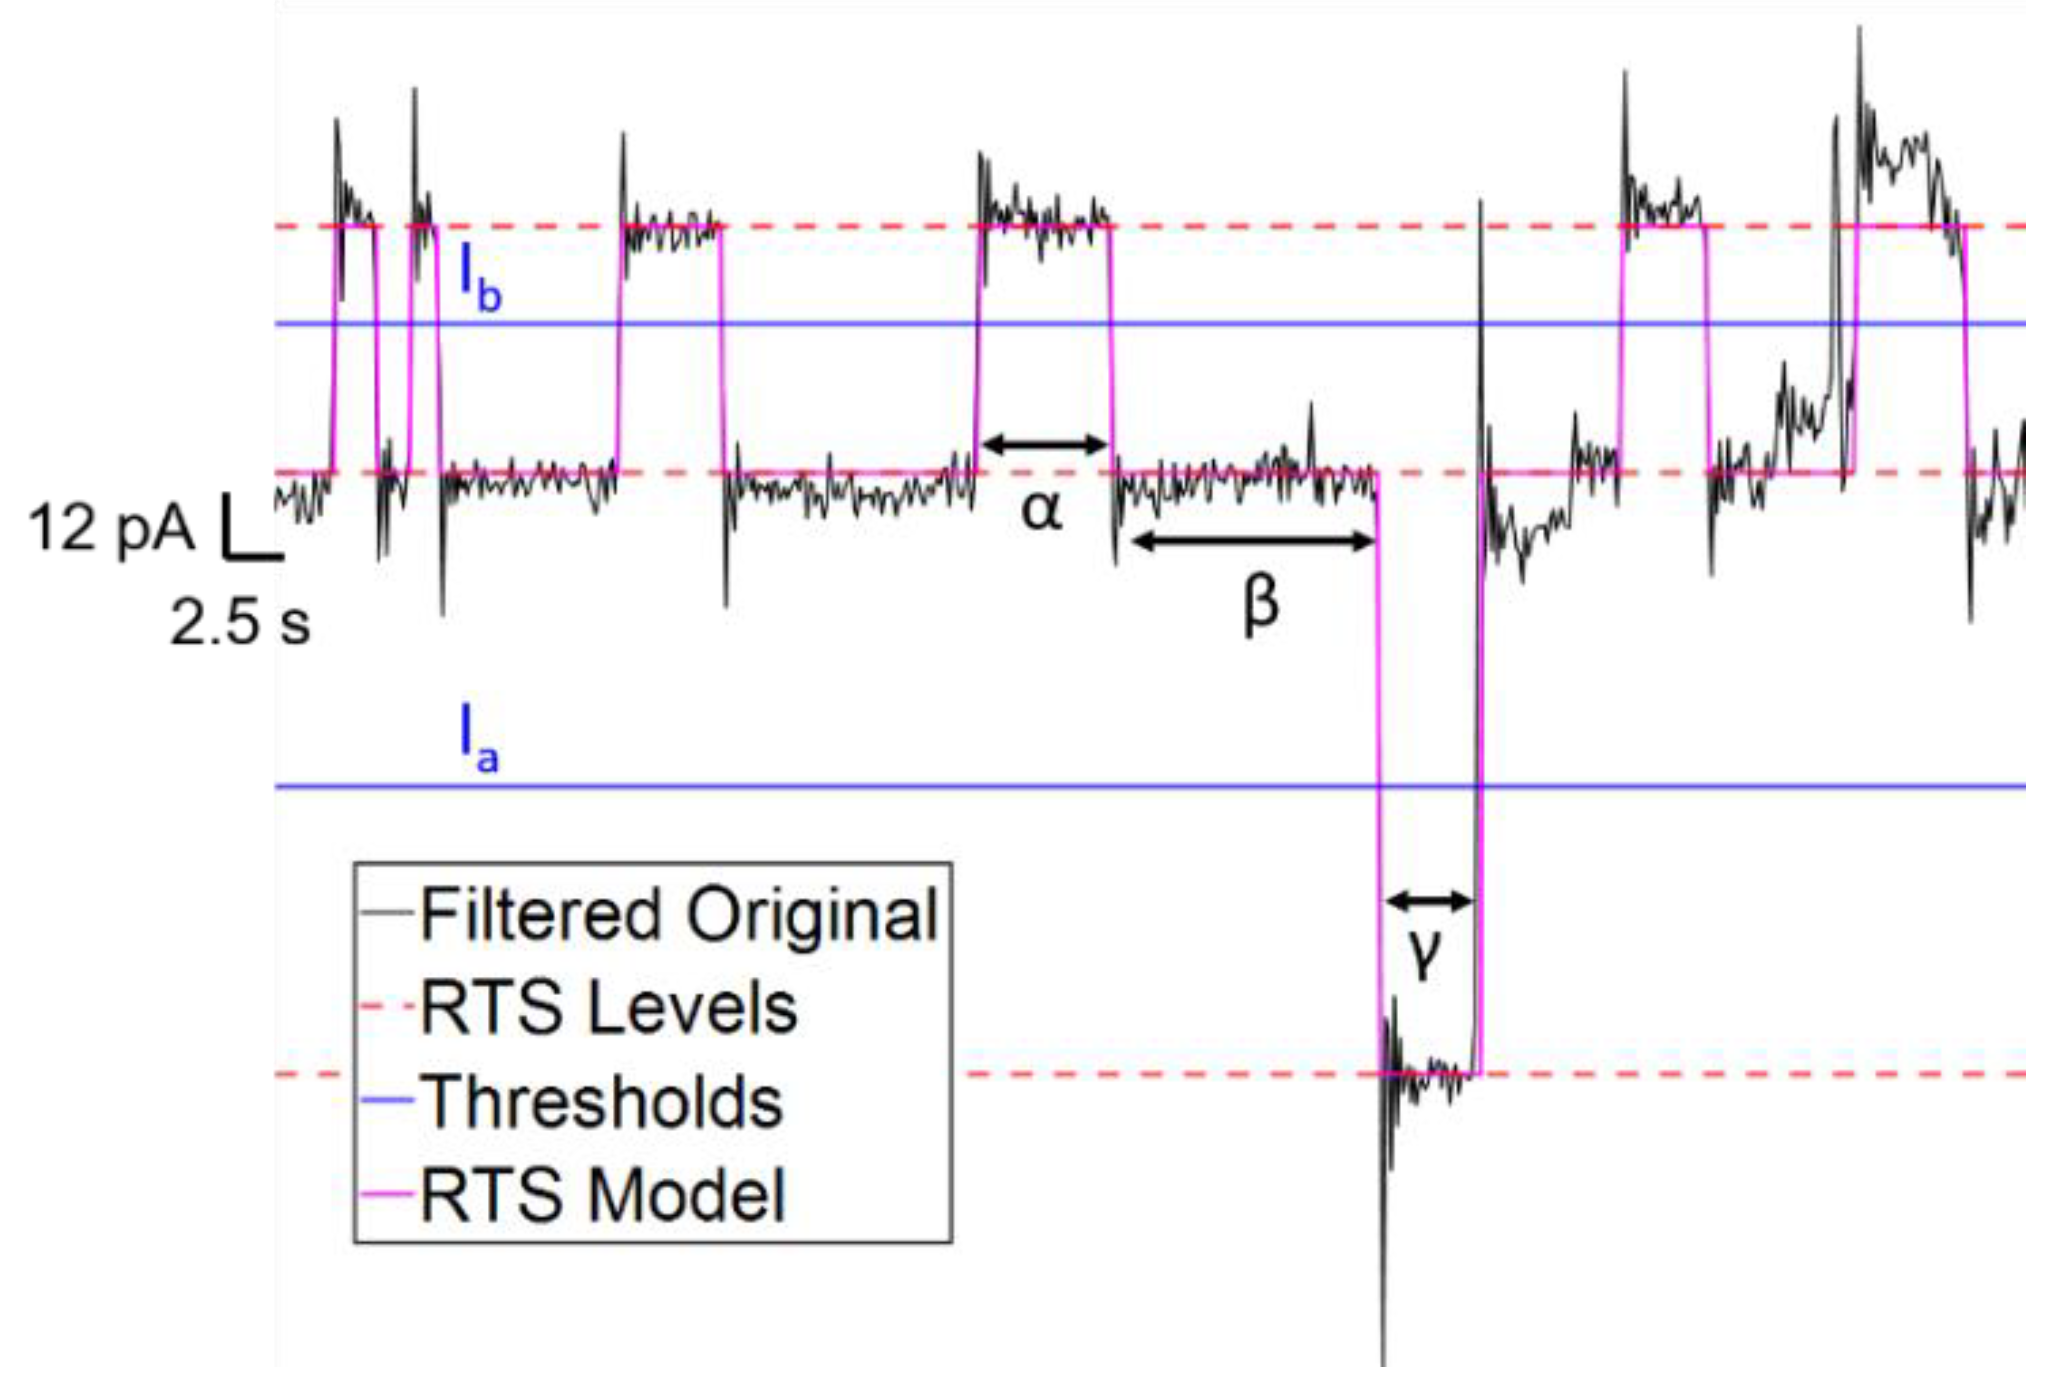
where α is the time duration at RTS level
a, and β is the duration of RTS level
b. To distinguish between two states, a likelihood relation can be used corresponding to the ratio between the two terms in Equation (2), which simplifies to the following:
Equation (4) was used for each pair of RTS levels detected in a window in order to produce multiple thresholds for generating a multi-level RTS model. An example of the kind of RTS model obtained using this thresholding algorithm, and subsequently a state machine for determining level transitions, is shown in
Figure 2.
3. Results and Discussion
Our low impedance biosensor shows an electrochemical background noise level of 1 pA (peak-to-peak) [
11] which allowed us to detect minute current oscillations across large populations of MDA-MB-231 cell cohorts [
10]. The RTS behaviour was examined and extracted. Following two-level RTS theory, this type of noise can be characterised in terms of its “on” and “off” times, which correspond to the duration at which the signal is above the baseline amplitude level and returned to this baseline, respectively. This applies to two-level RTS signals given that there are only two amplitude levels; however, in multi-level RTS, the signal does not return to a baseline value, but rather any other number of amplitude levels. Given the multi-level nature of the RTS activity seen in these experiments, our analysis therefore focuses on time “on” for positive and negative pulses. RTS activity is also defined by a Lorentzian spectrum in the frequency domain, indicating the frequency above which the spectrum rolls off as 1/
f2, conditioning the harmonic mean of “on” and “off” times. Alternatively, a theoretical current power spectral density (PSD) can also be derived for a two-level signal as follows [
18]:
where
is the angular frequency and
is the amplitude of the current pulses.
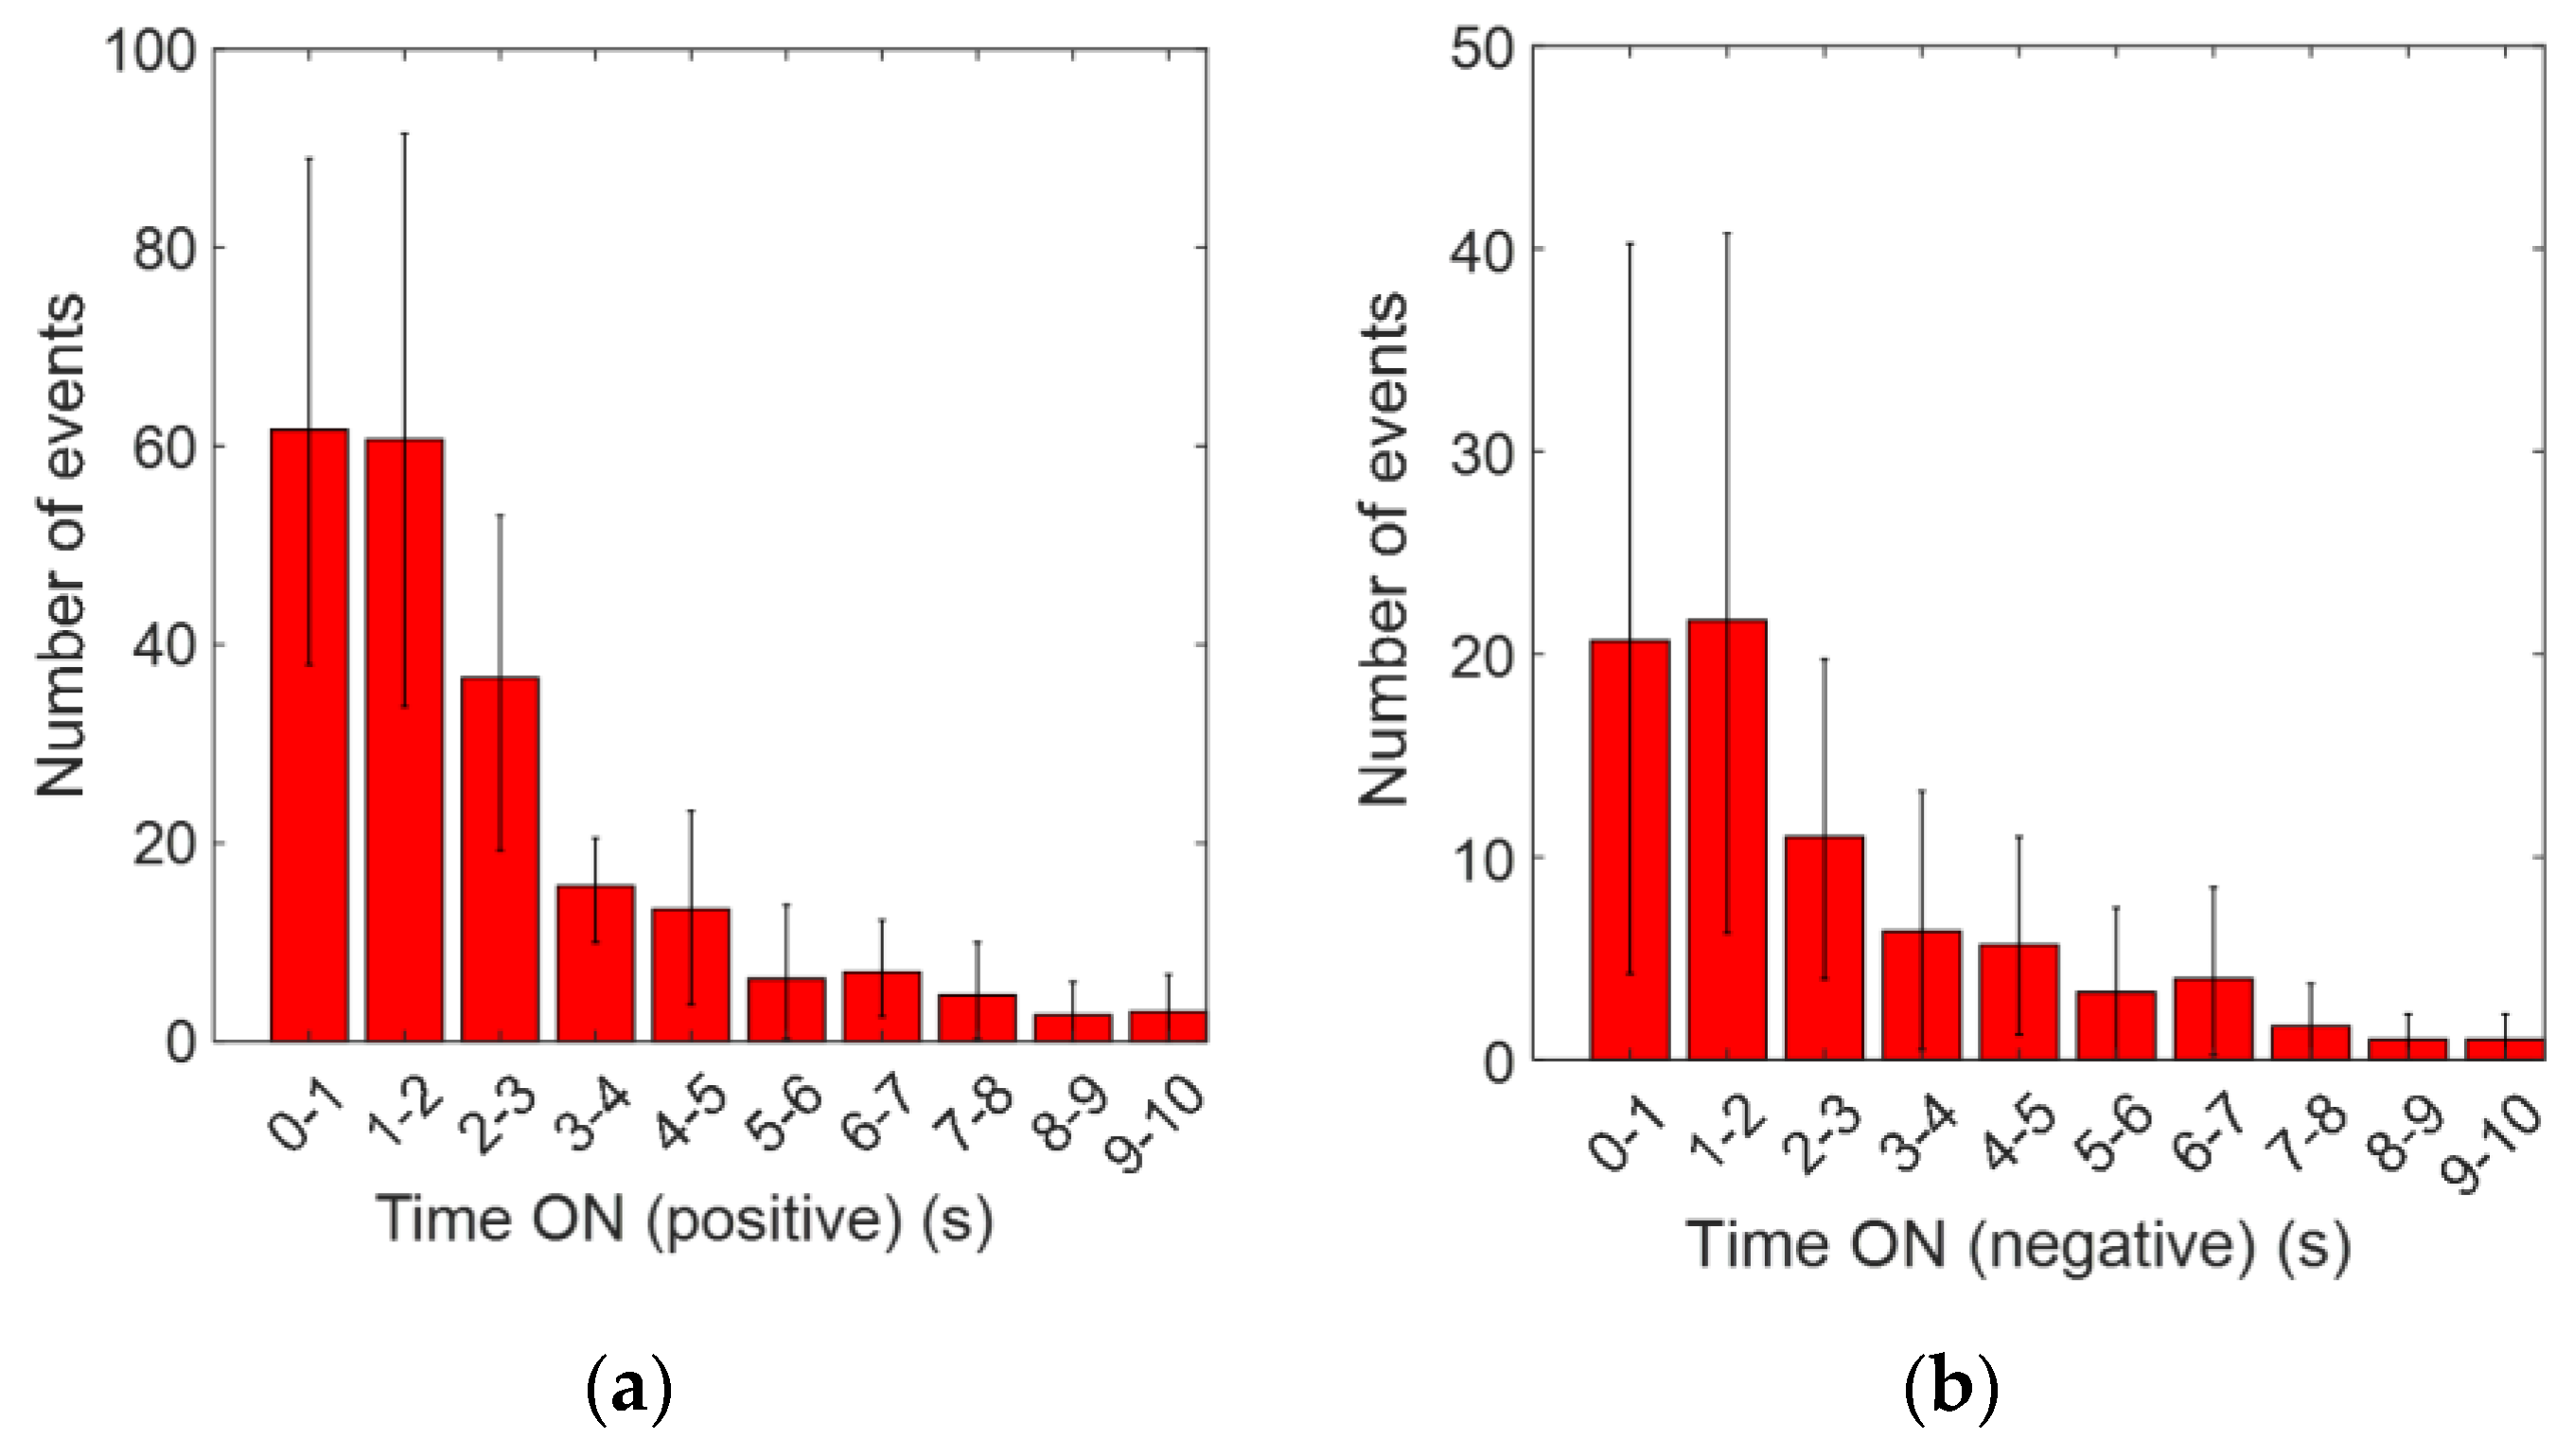
Figure 3a shows the distribution of time “on” for positive pulses, and
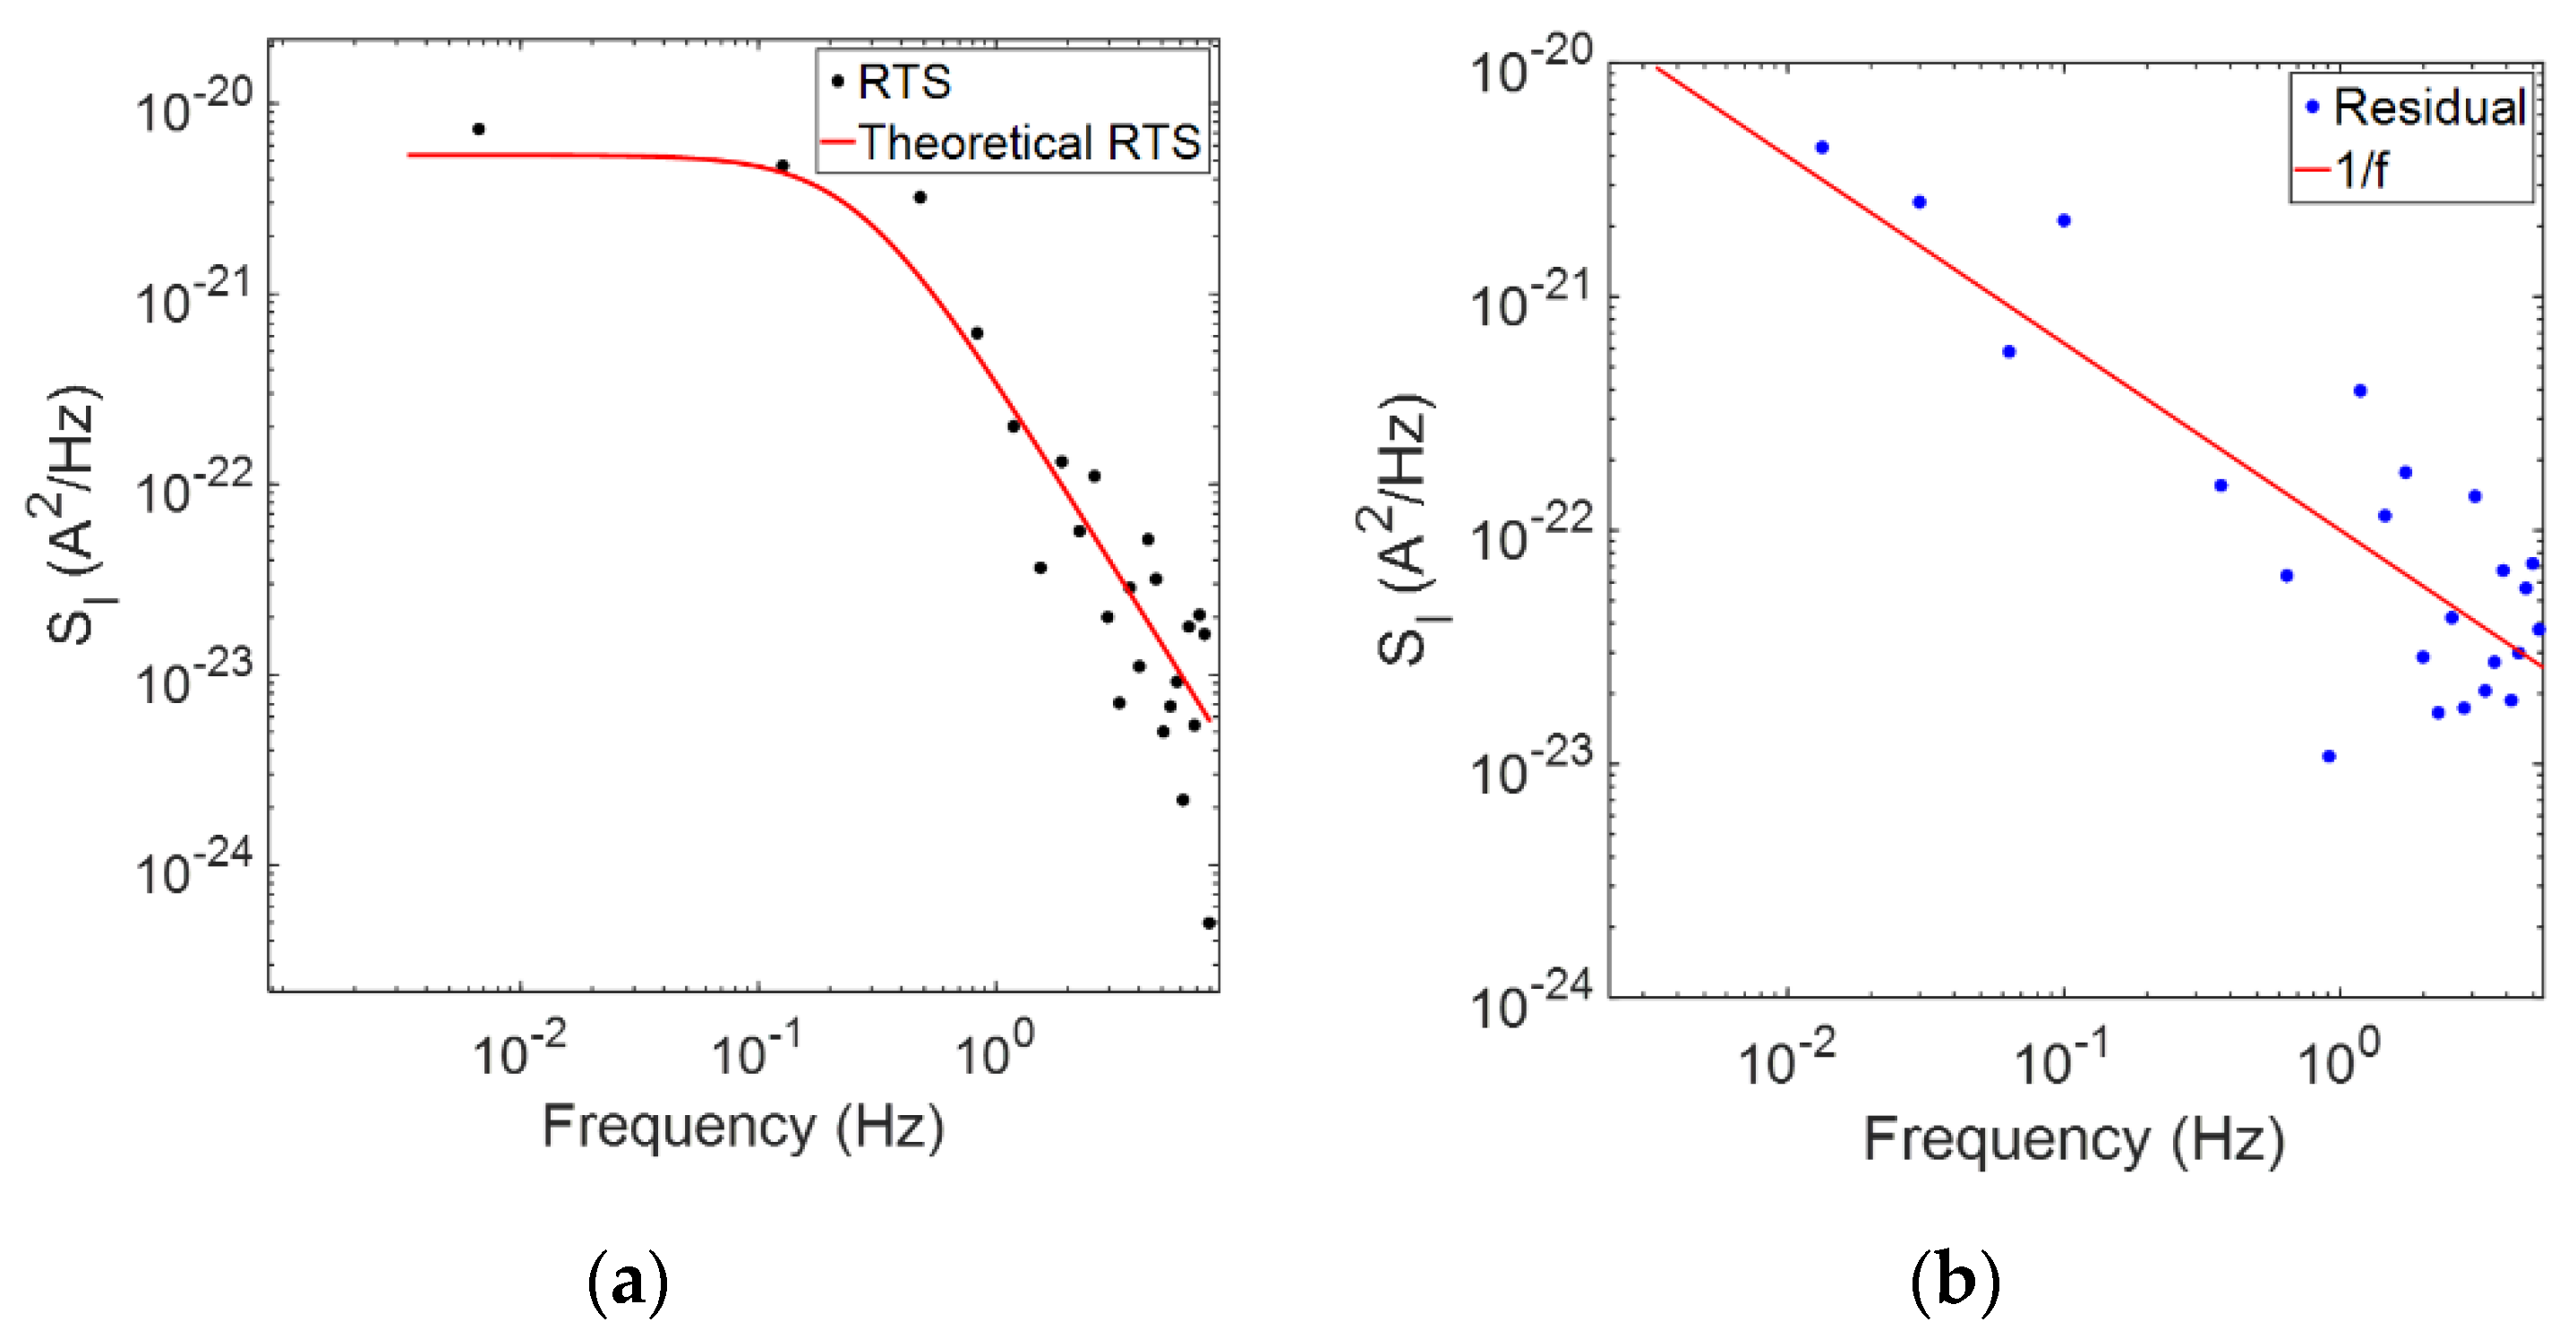
Figure 3b shows this for negative pulses. The theoretical model based on Equation (6) is shown in
Figure 4a, using a time “on” of 1.9 s, which is in good agreement with the results seen in
Figure 3a.
The generated RTS model is not only useful for determining time “on” more accurately but can also be leveraged to uncover the nature of underlying background noise from uncorrelated signalling events. This was achieved by subtracting the RTS model represented in
Figure 4a, from a corresponding unfiltered window of data, showing background noise with a 1/
f trend, as plotted in
Figure 4b.
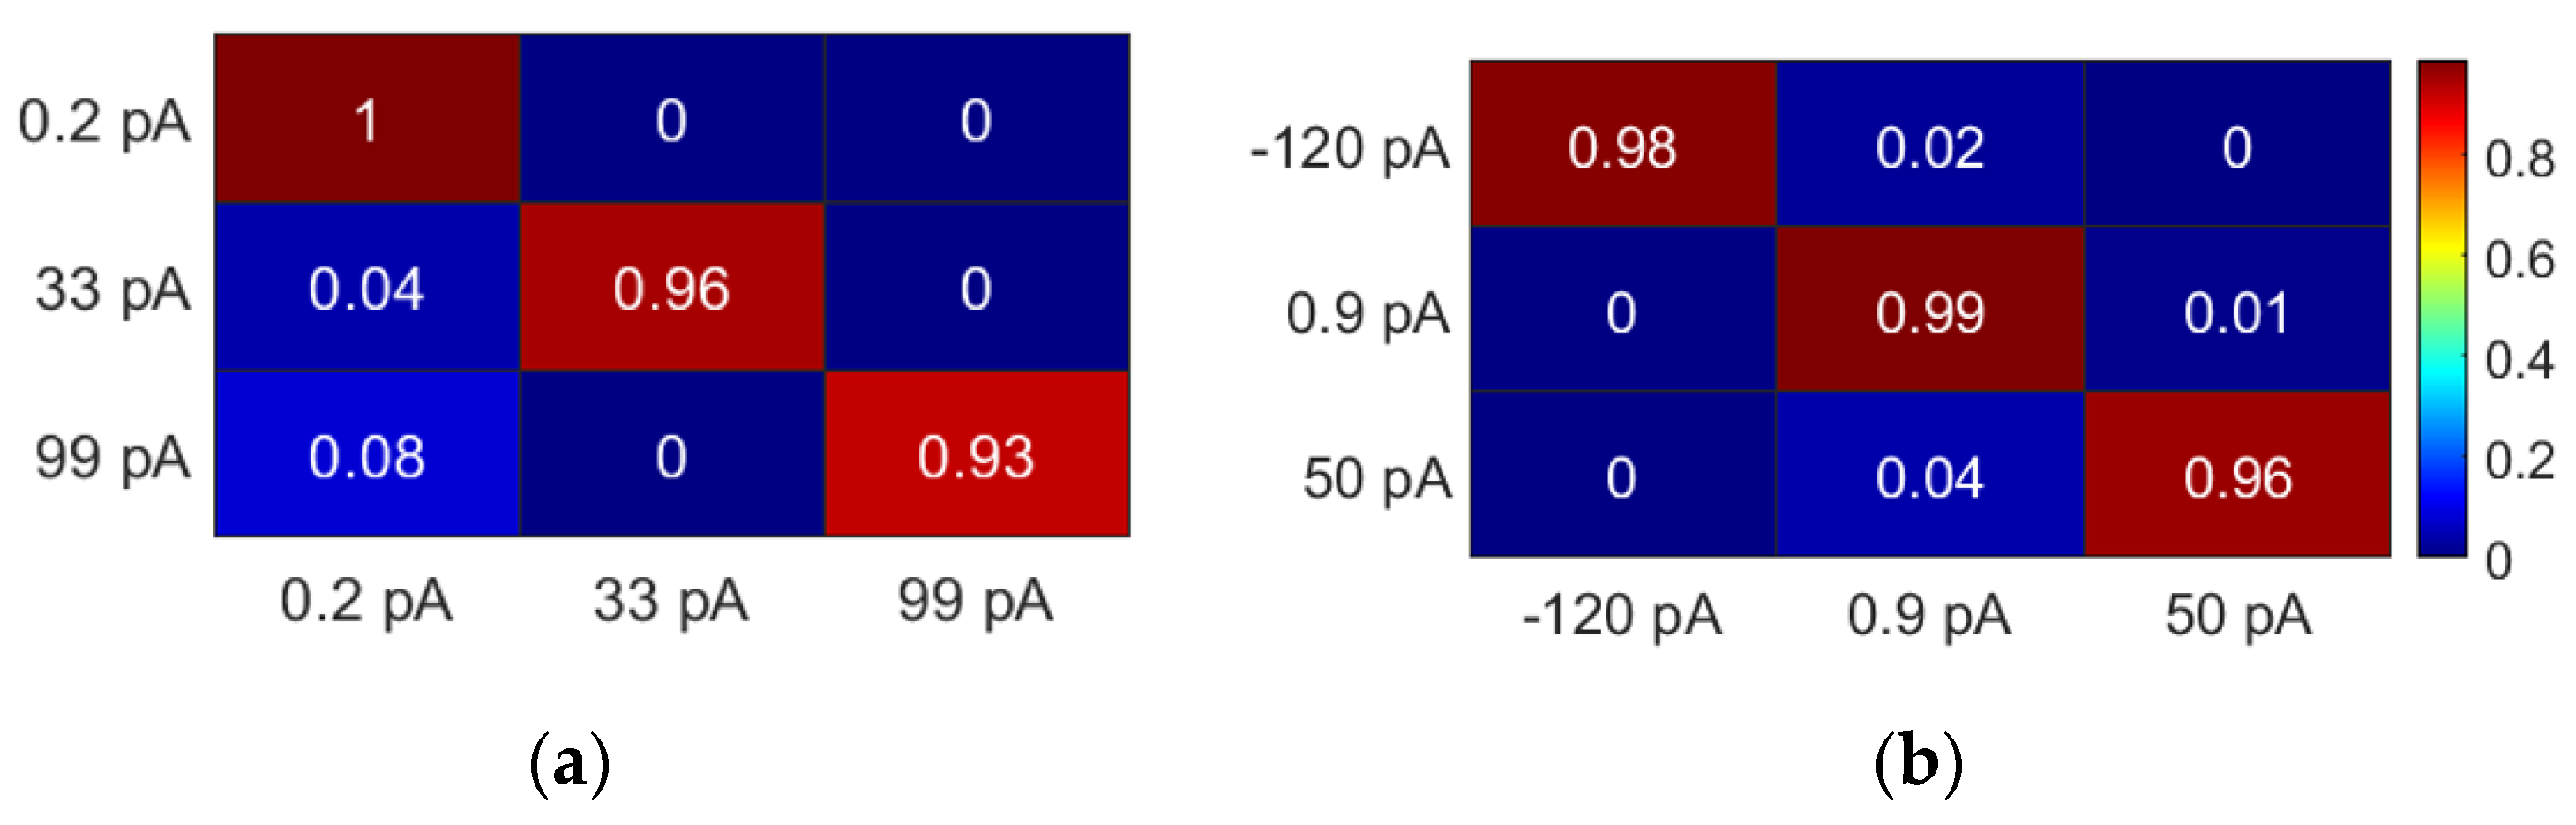
From the generated RTS model, it is also possible to create discrete Markov chain models for identifying the probabilities of moving between RTS states.
Figure 5 shows exemplar stochastic matrices (SMs) seen across the RTS data. Given that RTS pulses can last up to 10 s, high probabilities are seen across the diagonals of each SM, corresponding to the likelihood of remaining in the same state. Another insight this analysis offers is that when there is a state change, this is likely to be an adjacent state rather than one several levels away. For instance, in
Figure 5a, it is not possible to transition from the −120 pA to the 50 pA state, and vice versa.
The state machine approach worked well for identifying RTS behaviour whilst also mitigating the effects of overshoots and abrupt spikes. The fact that the observed RTS behaviour can be modelled using this approach suggests that the process is Markovian. Previous two-level RTS processes have also been described using Markov processes, but to the best of our knowledge, this is the first time that multi-level RTS has been recorded from biological cell cohorts and subsequently modelled. This approach could be useful for rapidly examining the nature of RTS-like behaviour in biological or other processes, ranging from the pulse durations to common patterns seen in windowed sections of data. This probabilistic analysis could also provide some insights into the biological processes underlying each state and transitions between different states.
4. Conclusions
This work describes a low noise biosensor employed to detect multi-level RTS noise from highly metastatic MDA-MB-231 cell cohorts. The biosensor leverages large electrode areas of 2 mm2 to increase the concomitant detection sensitivity, and hence record low-amplitude RTS noise from cancer cell cohorts. The RTS noise was modelled and investigated using a state machine approach. The state machine approach allowed us to calculate the time “on” of positive and negative RTS pulses, as well as the state transition matrices for investigating the likelihood of transitioning between the different RTS states, and how these vary across 5 min windows of RTS data from each recording. It was found that there is a high probability of remaining in the current RTS state, given the durations in the order of s, and if a state transition occurs, this will likely be to an adjacent state. This work highlights the potential of both the biosensing platform and statistical analysis for better understanding the underlying mechanisms behind cancer cell cohorts.


