Abstract
The large amount of aircraft trajectory data publicly available through open data sources like the OpenSky Network presents a wide range of possibilities for monitoring and post-operational analysis of air traffic performance. This contribution addresses the automatic identification of operational events associated with trajectories. This is a challenging task that can be tackled with both empirical, rule-based methods and statistical, data-driven approaches. In this paper, we first propose a taxonomy of significant events, including usual operations such as take-off, Instrument Landing System (ILS) landing and holding, as well as less usual operations like firefighting, in-flight refuelling and navigational calibration. Then, we introduce different rule-based and statistical methods for detecting a selection of these events. The goal is to compare candidate methods and to determine which of the approaches performs better in each situation.
1. Introduction
Large-scale data produced daily by the aviation world open promising perspectives for situational awareness, monitoring and decision making [1,2] systems. Massive amounts of ADS-B data available today from open sources like the OpenSky Network are valuable to academics, who, despite limited access to operational data, have been developing effective methods to automatically extract meaningful information from trajectory data. We focus in this paper on the detection of significant events in aircraft trajectories. Some methods in the literature are rule-based algorithms based on the expertise of the authors [3], whereas other methods join the growing trend around machine learning and efficiently detect events based on data-driven statistical approaches [4,5].
We first present in Section 2 a taxonomy of the events we intend to identify. These include the occurrences of specific missions (e.g., firefighting) or the detection of the different parts of a trajectory corresponding to each flight phase. Furthermore, we cover several navigational events such as holding patterns, “direct to” the ATCinstructions or landing assisted by Instrument Landing Systems (ILSs). Section 3 reviews simple ad hoc methods applying a set of rules to trajectory data. They range from simple pattern-matching on the aircraft registration number or call sign to geodetic computations for navigational events. Section 4 compares data-driven models with rule-based alternatives for detecting runway changes in final approach [4] and identifying holding patterns.
All the event detection methods presented in this paper were implemented using the traffic library [6]. The code used to produce figures in this paper is available, together with additional interactive visualisations, from the GitHub repository of the library.
2. A Taxonomy of Events
Table 1 proposes a taxonomy of flight events to be found in trajectories based on three main categories: missions, flight phases and navigational events. It is crucial to keep in mind that the different levels of granularity may overlap. For instance, a flight on a zero gravity experiment will alternate many climb and descent flight phases, or an inspection flight for instrument landing systems will have many descent segments aligned with one of the runways of a given airport.

Table 1.
A taxonomy of flight events. ILS, Instrument Landing System.
External sources of information are essential to properly label trajectories: registration databases validate the identified missions as not all aircraft have the required equipment for those. Navigational events also heavily rely on the structure of the airspace where aircraft evolve. Section 3 presents the most basic methods to leverage these sources of information to identify missions, navigational events and flight phases.
3. Rule-Based Methods for Event Detection
3.1. Identification of Missions Based on Tail Numbers
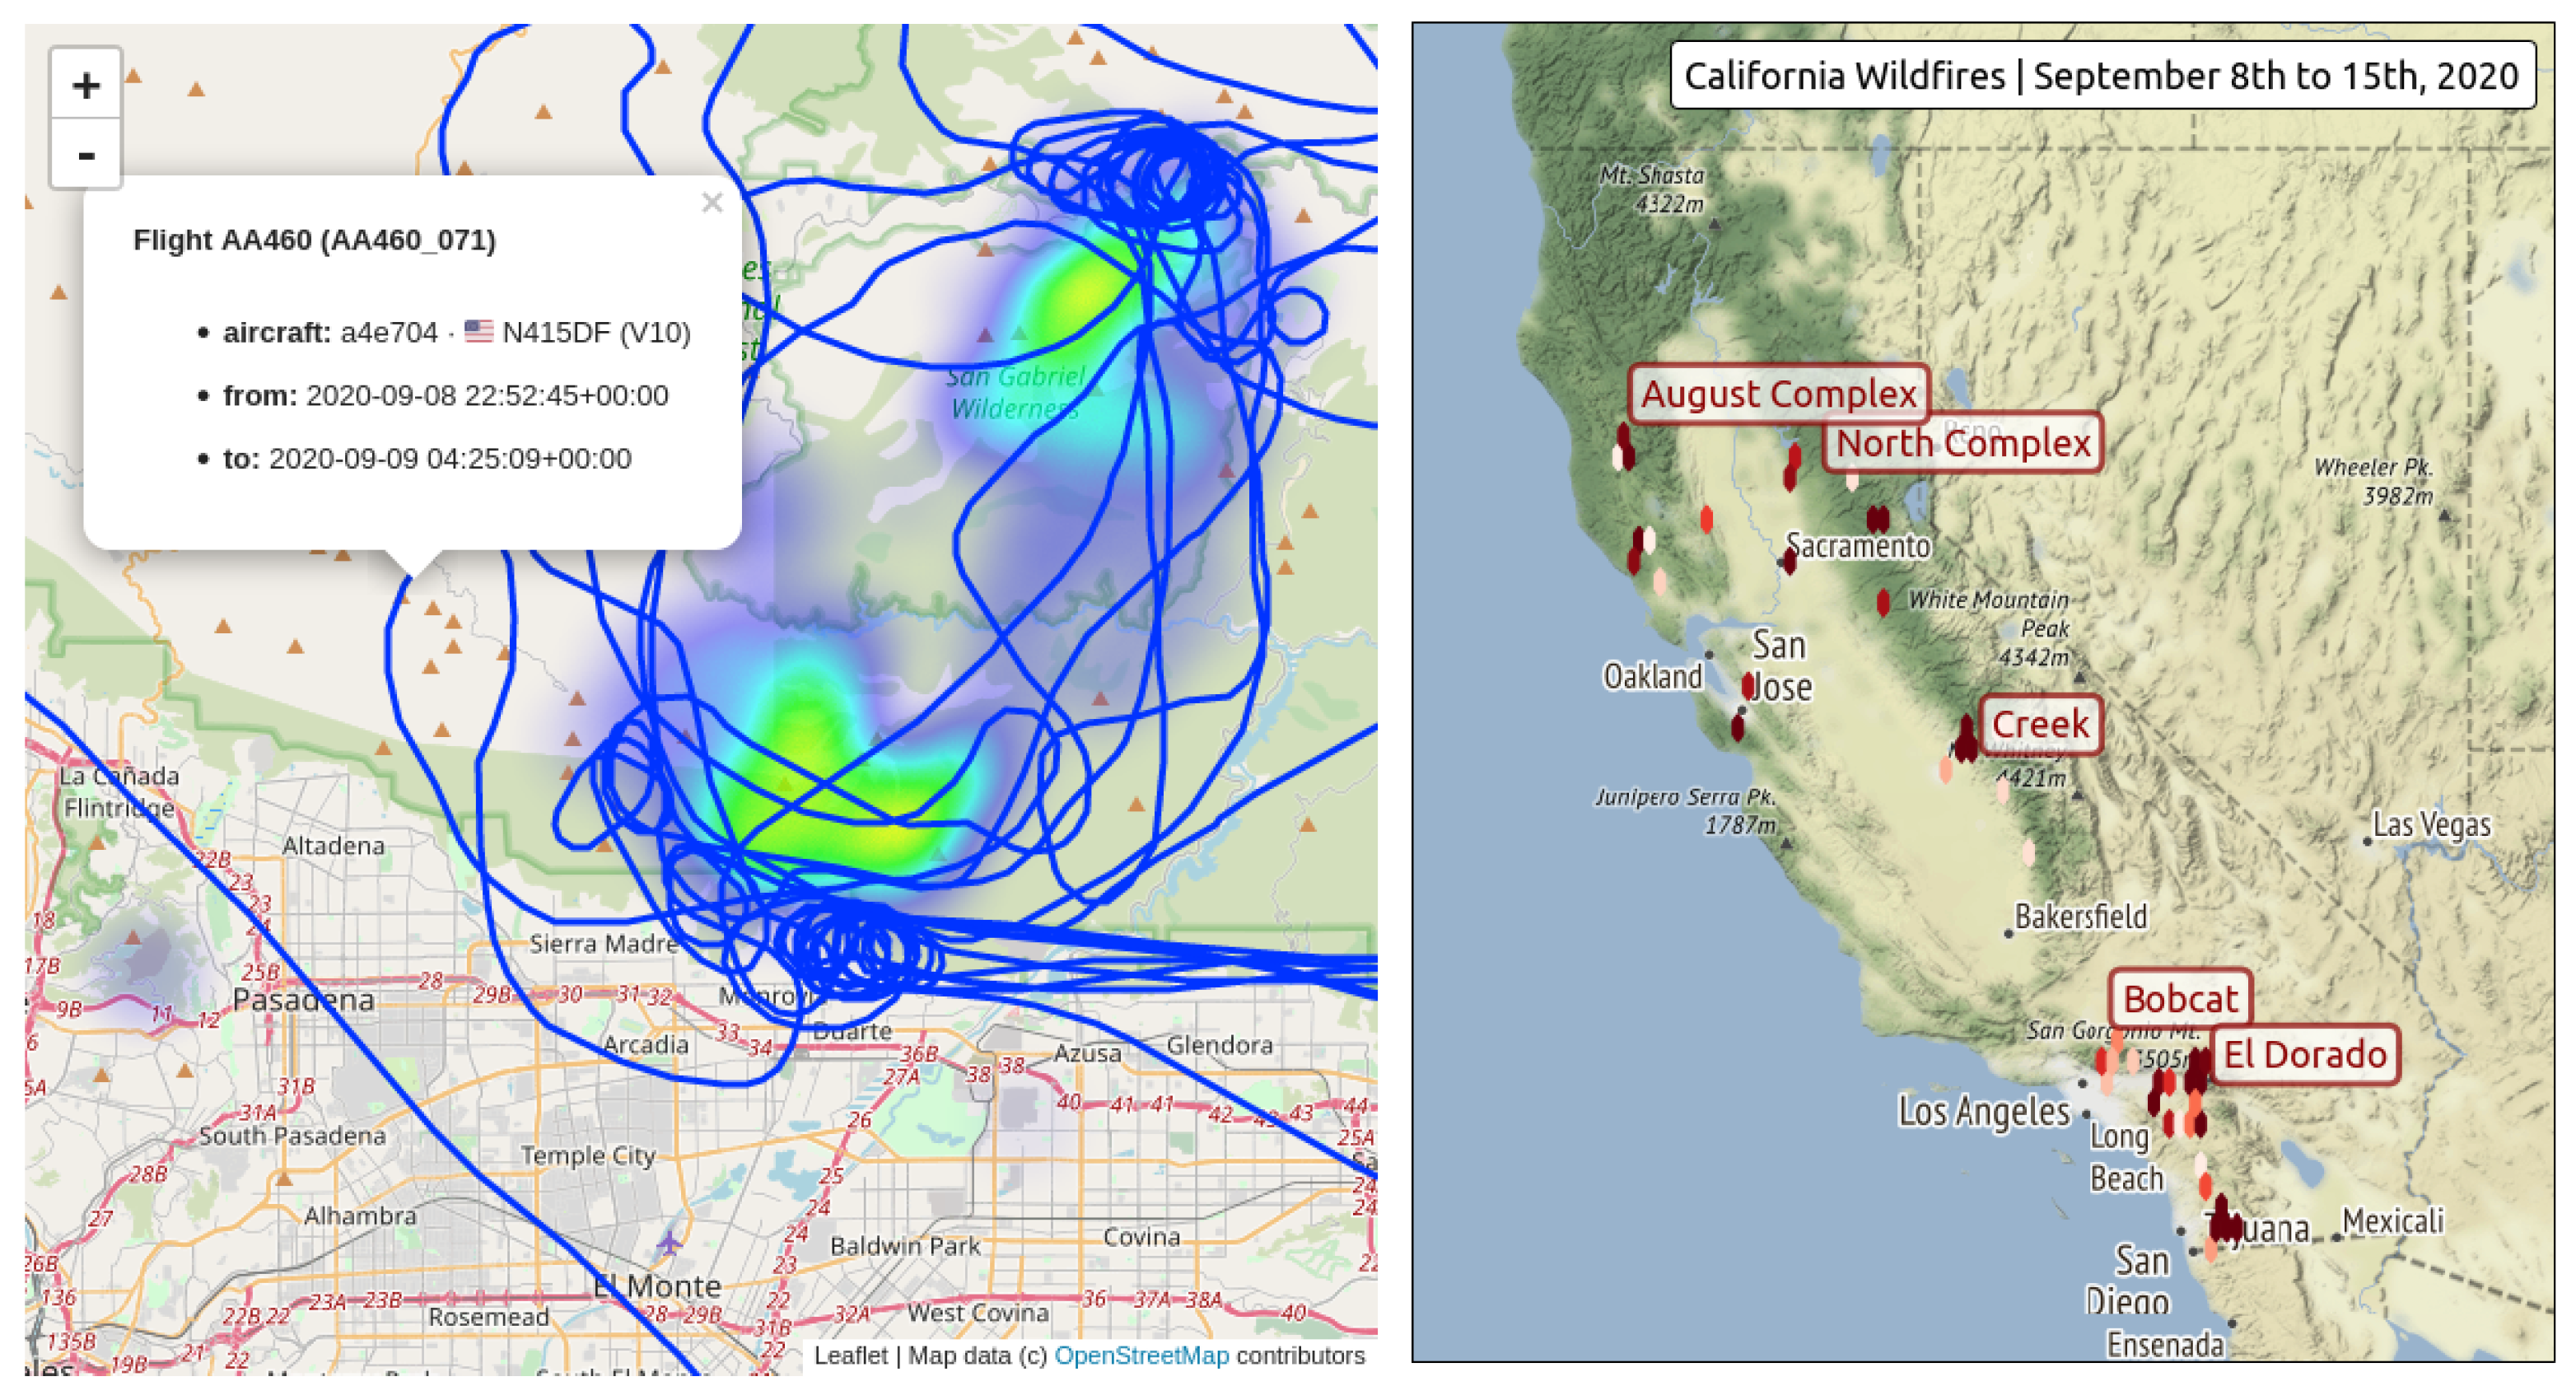
The most basic method to select trajectories for specific missions is to make use of aircraft trajectory databases like the OpenSky Aircraft database.For instance, firefighting operations are mostly conducted by aircraft and helicopters owned by specific institutions and agencies. Rescuing operations, aerial surveys or flight inspections are also usually conducted by the same fleet of aircraft (including helicopters). Figure 1 shows how aircraft trajectories flown by the California Department of Forestry and Fire Protection during a severe period of wildfires are consistent with the location of wildfires. A simple selection of pieces of circling segments can produce a trajectory-based heat map of wildfires in a given region.

Figure 1.
Many wildfires occurred in California during September 2020. The heat map (left) shows the locations of fires according to the NASA Fire Information for Resources Management Systems together with the trajectories of aircraft owned by the firefighting administration of California. Selecting parts of trajectories where aircraft circle can help produce the different heat maps (right) inferring the locations of fires from aircraft trajectories.
This approach has three main limitations. Firstly, databases are difficult to maintain and easily become deprecated. Secondly, governmental aircraft trajectories are often obfuscated or only accessible through multilateration. Finally, some activities are subcontracted: during wildfire season, private aircraft and helicopters are contracted to assist tankers in their firefighting operations. Off season, such aircraft come back to their regular activities if they do not assist firefighters in the other hemispheres.
3.2. Identification of Missions Based on Call Sign Information
A call sign is an eight-character identifier used for communication with the ATC. General aviation commonly uses the aircraft registration (tail number) as a call sign; commercial flights use a unique identifier per route, starting with three letters identifying the airline operator, BAW for British Airways, AFR for Air France, etc. Call signs commonly refer to the mission operated by an aircraft, and this can help distinguish the original intention of an aircraft used for specific purposes.
For example, F-HNAVuses the CALIBRA call sign for VOR/ILS calibration operations, the JAMMINGcall sign during jamming investigation and a regular NAKcall sign when commuting between airfields. Similarly, test flights operated by Airbus use an AIB call sign; Boeing uses a BOE call sign; ambulance helicopters often use explicit call signs: SAMUin France (stands for Urgent Medical Aid Service) and LIFEin many European countries. Australian firefighting operations use a specific call sign depending on the role of the aircraft during the operations: BMBR for fire bombing; SPTR for fire spotters; BDOG, bird dog, for fire attack supervisions (often subcontracted); and FSCN, firescan for remote sensing fire operations.
3.3. Detection of Take-Off and Landing
Among the navigational events listed in Table 1, some can be directly specified and implemented on ADS-B data, in spite of some tricky corner cases to keep in mind, as they can become limitations in specific contexts. Aircraft broadcast specific type codes (between 5 and 8) in ADS-B messages (DF17) when on the ground. This piece of information is commonly used to determine whether an aircraft has landed or not taken off yet. The OpenSky Impala database stores this piece of information as an onground boolean. This bit is usually sufficient to determine whether an aircraft is really on the ground. However, in some situations, aircraft, possibly subject to faulty sensors, continue to broadcast airborne positional messages while on the ground. Vertical rate information can be a good way to cross-check the validity of the onground flag.
The determination of take-off and landing airports is commonly implemented based on positional information and aircraft databases. The OpenSky Impala database contains a flight table where take-off and landing airports are determined based on the distance of the first and last points of each trajectory. The field remains empty if no airport can be inferred.
☞ Pitfalls (Figure 2):
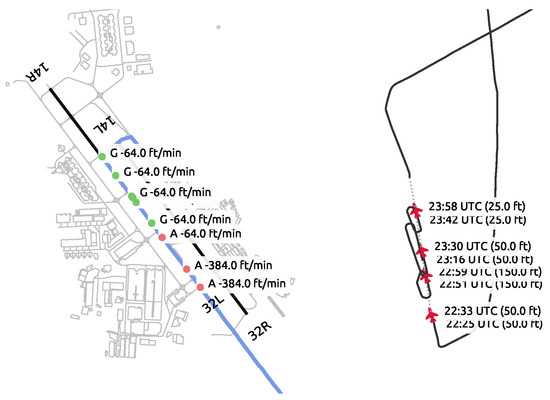
Figure 2.
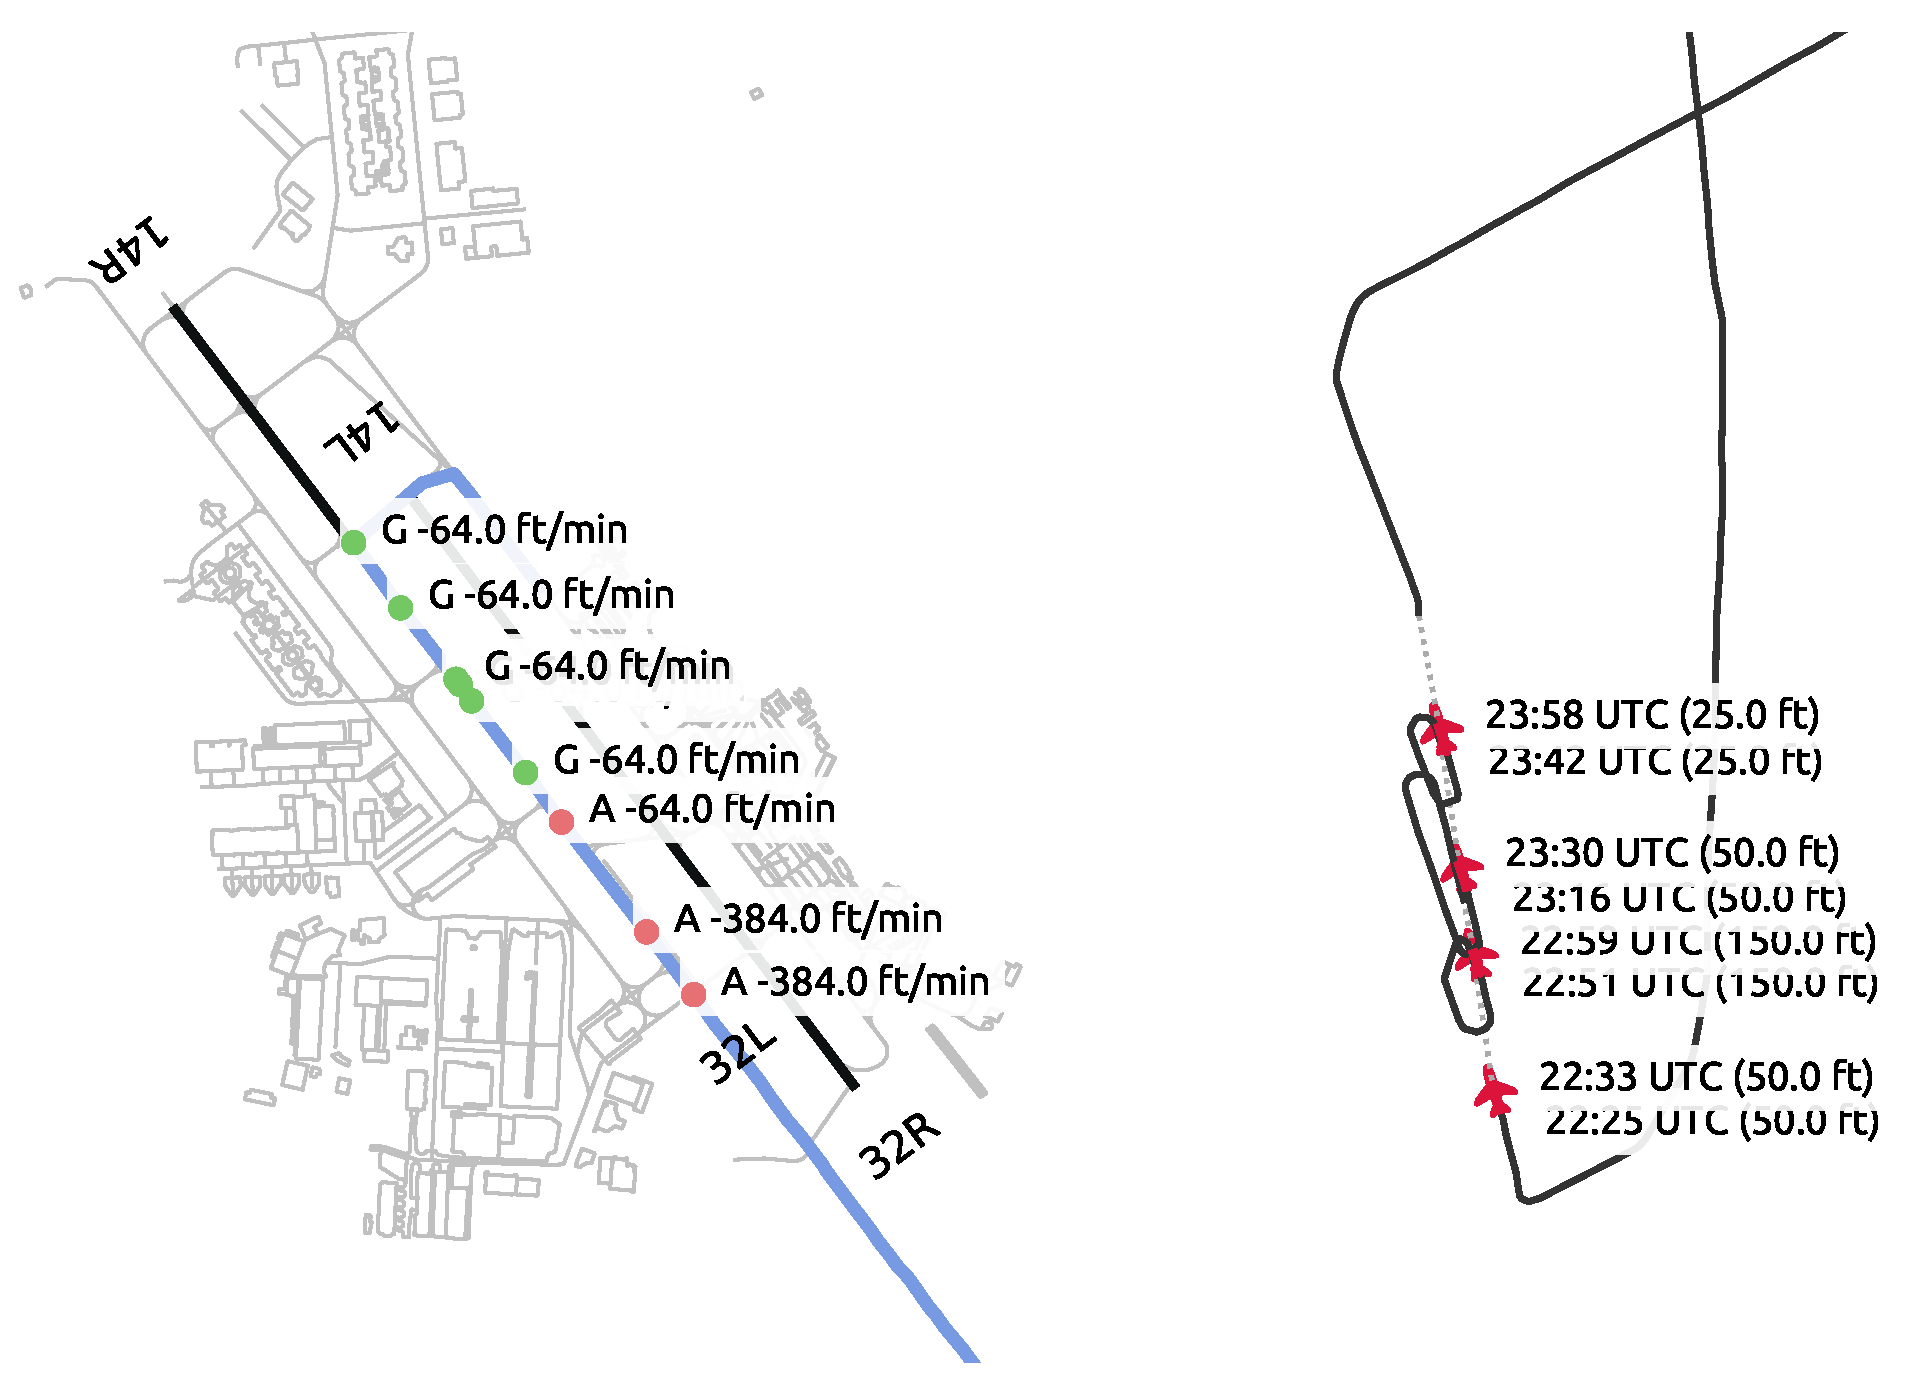
(Left) Flight DLH83Kon 25 February 2017: it is very difficult to determine the exact landing point: the onground flag was activated after the vertical rate came close to zero. A long landing in this situation is not unreasonable, but these data cannot reasonably support this hypothesis. (Right) No onground flag is activated, but the trajectory of aircraft identifier ae0455on 14 September 2020 suggests landing practice activity on an aircraft carrier off California.
- The onground flag is rather unreliable; information should be cross-checked with other features;
- Aircraft may land or take off outside designated areas (gliders, helicopters).
3.4. Detection of Events around a Flight Plan
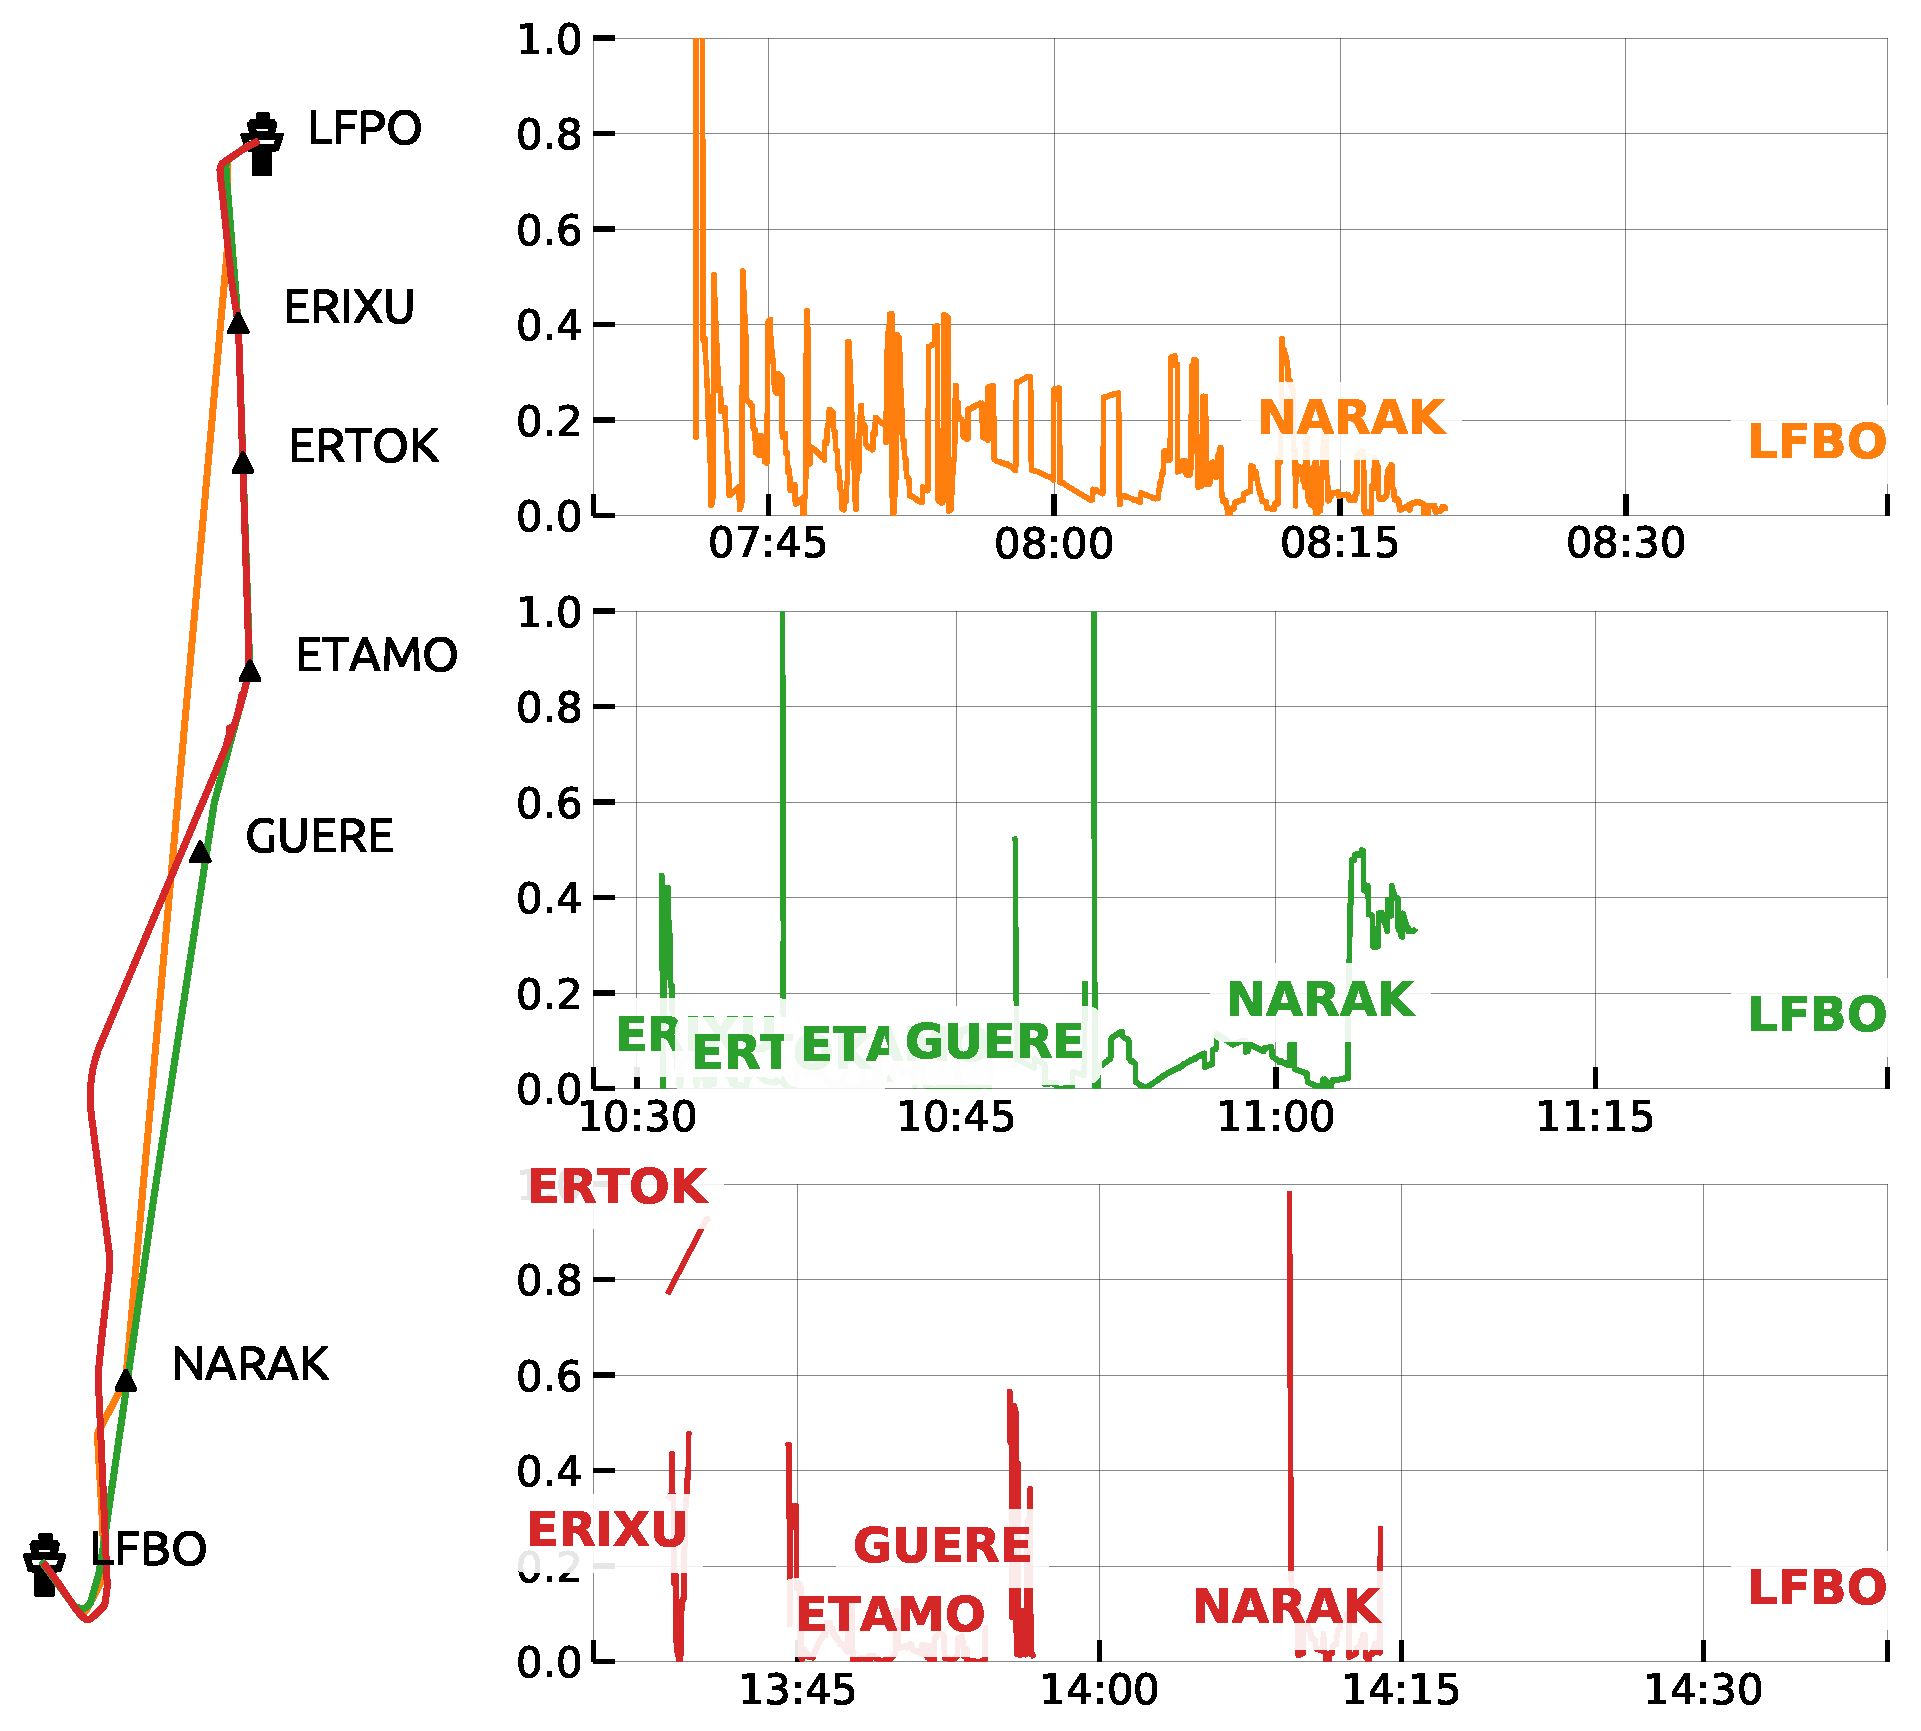
Commercial aircraft are equipped with onboard devices that are very precise for flying trajectories heading toward a particular position, regardless of its technical characteristic (VOR, NDB, FIX, GPS coordinates). Provided a flight plan, the selection of segments heading toward a defined position is direct, after a comparison of the true track angle with the bearing of the aircraft toward the defined location. Figure 3 shows the angular difference between both angles for a set of flights between Paris–Orly LFPO and Toulouse LFBO airports, the usual flight plan to be filed being ERIXU UN860 GUERE UZ365 NARAK.
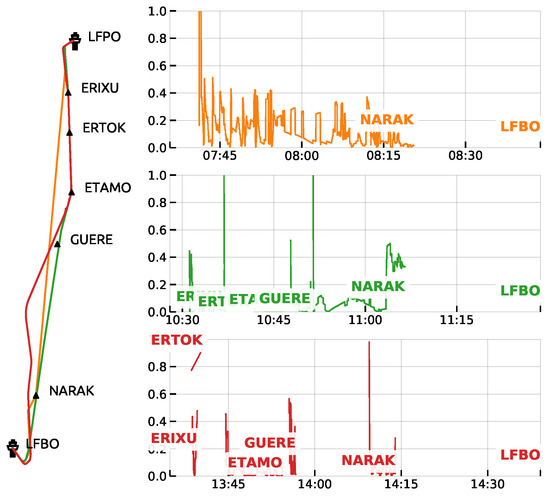
Figure 3.
Different trajectories from Paris–Orly LFPO to Toulouse LFBO range from a direct to NARAK(entry point to the TMA) to a route following all the points of the flight plan. A long interval without a flight plan navigational point in heading may suggest an instruction from the ATC.
This figure plots an angular difference normalised by the remaining distance to the navigational point. Rule-based detection of targeted navigational points involves setting a threshold for the selected criterion and a minimal time the target should be locked on: the figure suggests corner cases with GUERE on the green and red trajectories.
☞ Pitfalls:
- During a long-haul flight, aircraft sometimes target navigational points that are far ahead, pushing ad hoc criteria to their limits;
- It is difficult to know which point is targeted when they appear nearly aligned (see ERTOKand ERIXUin the red trajectory in Figure 3);
- Flight management systems are able to follow Standard Lateral Offset Procedures (SLOP) during transatlantic flights: they follow a route parallel to the next navigational point, which adds complexity to an automatic rule-based detection procedure.
3.5. Detection of Events during Final Approach
There are two direct ways to detect landing on a particular runway:
- consider the runway thresholds as targeted navigational points (ILS modelling);
- consider the ground trajectory, and select the part matching the footprint of a runway (taxi modelling).
☞ Pitfalls (Figure 4):
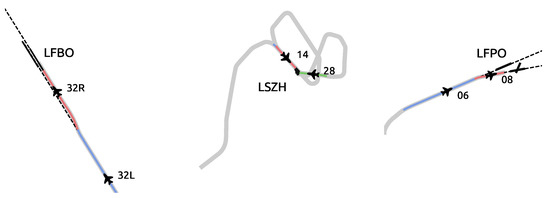
Figure 4.
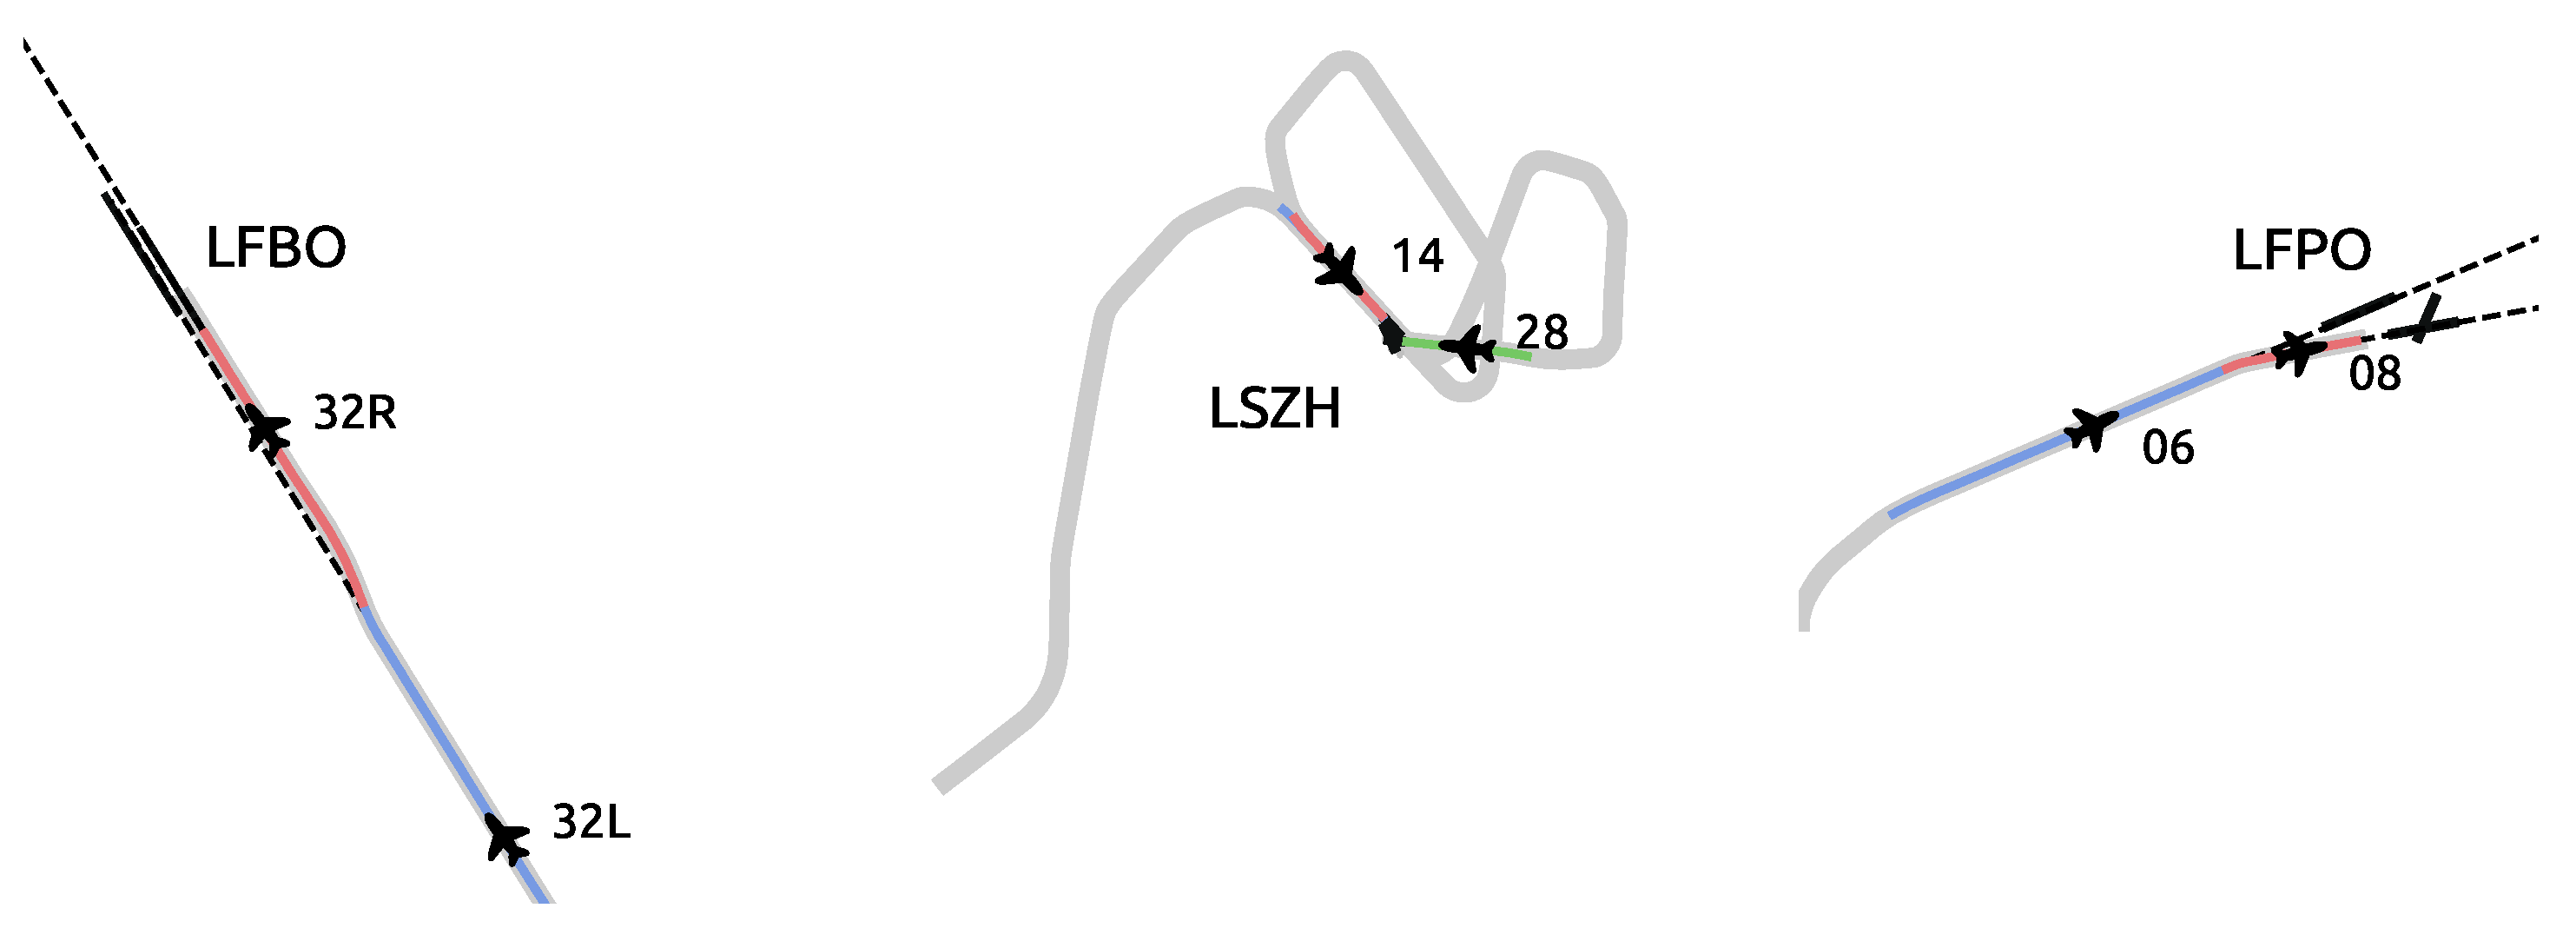
Successive runway alignments may suggest different situations depending on the configuration of the airport and on the vertical speed: runway change with parallel runways at Toulouse LFBO airport on the left, failed landing attempts with go-around at Zürich LSZH airport in the middle or circle to land manoeuvres at Paris–Orly LFPO airport.
- VFR (Visual Flight Rule) landing may be harder to detect using the ILS modelling;
- Successive runway alignments (ILS modelling) may suggest a runway change (if the aircraft continuously descends) or a go-around (if the aircraft climbs between the two segments);
- Circle to land manoeuvres yield a different runway with the ILS modelling approach and with the taxi modelling approach.
3.6. Identification of the Flight Phase with Fuzzy Logic
Commercial flights can commonly be split into five different flight phases, namely take-off, climb, cruise, descent and landing. Determining a set of rules to properly identify flight phases can be arduous as, e.g., aircraft can cruise at different altitudes or levelling may occur during climb or descent. While these varying conditions cause predefined rules on altitude, speed and vertical rate to fail with uncommon conditions, the human brain excels at understanding general trends, thereby intuitively splitting flights into distinctive flight segments.
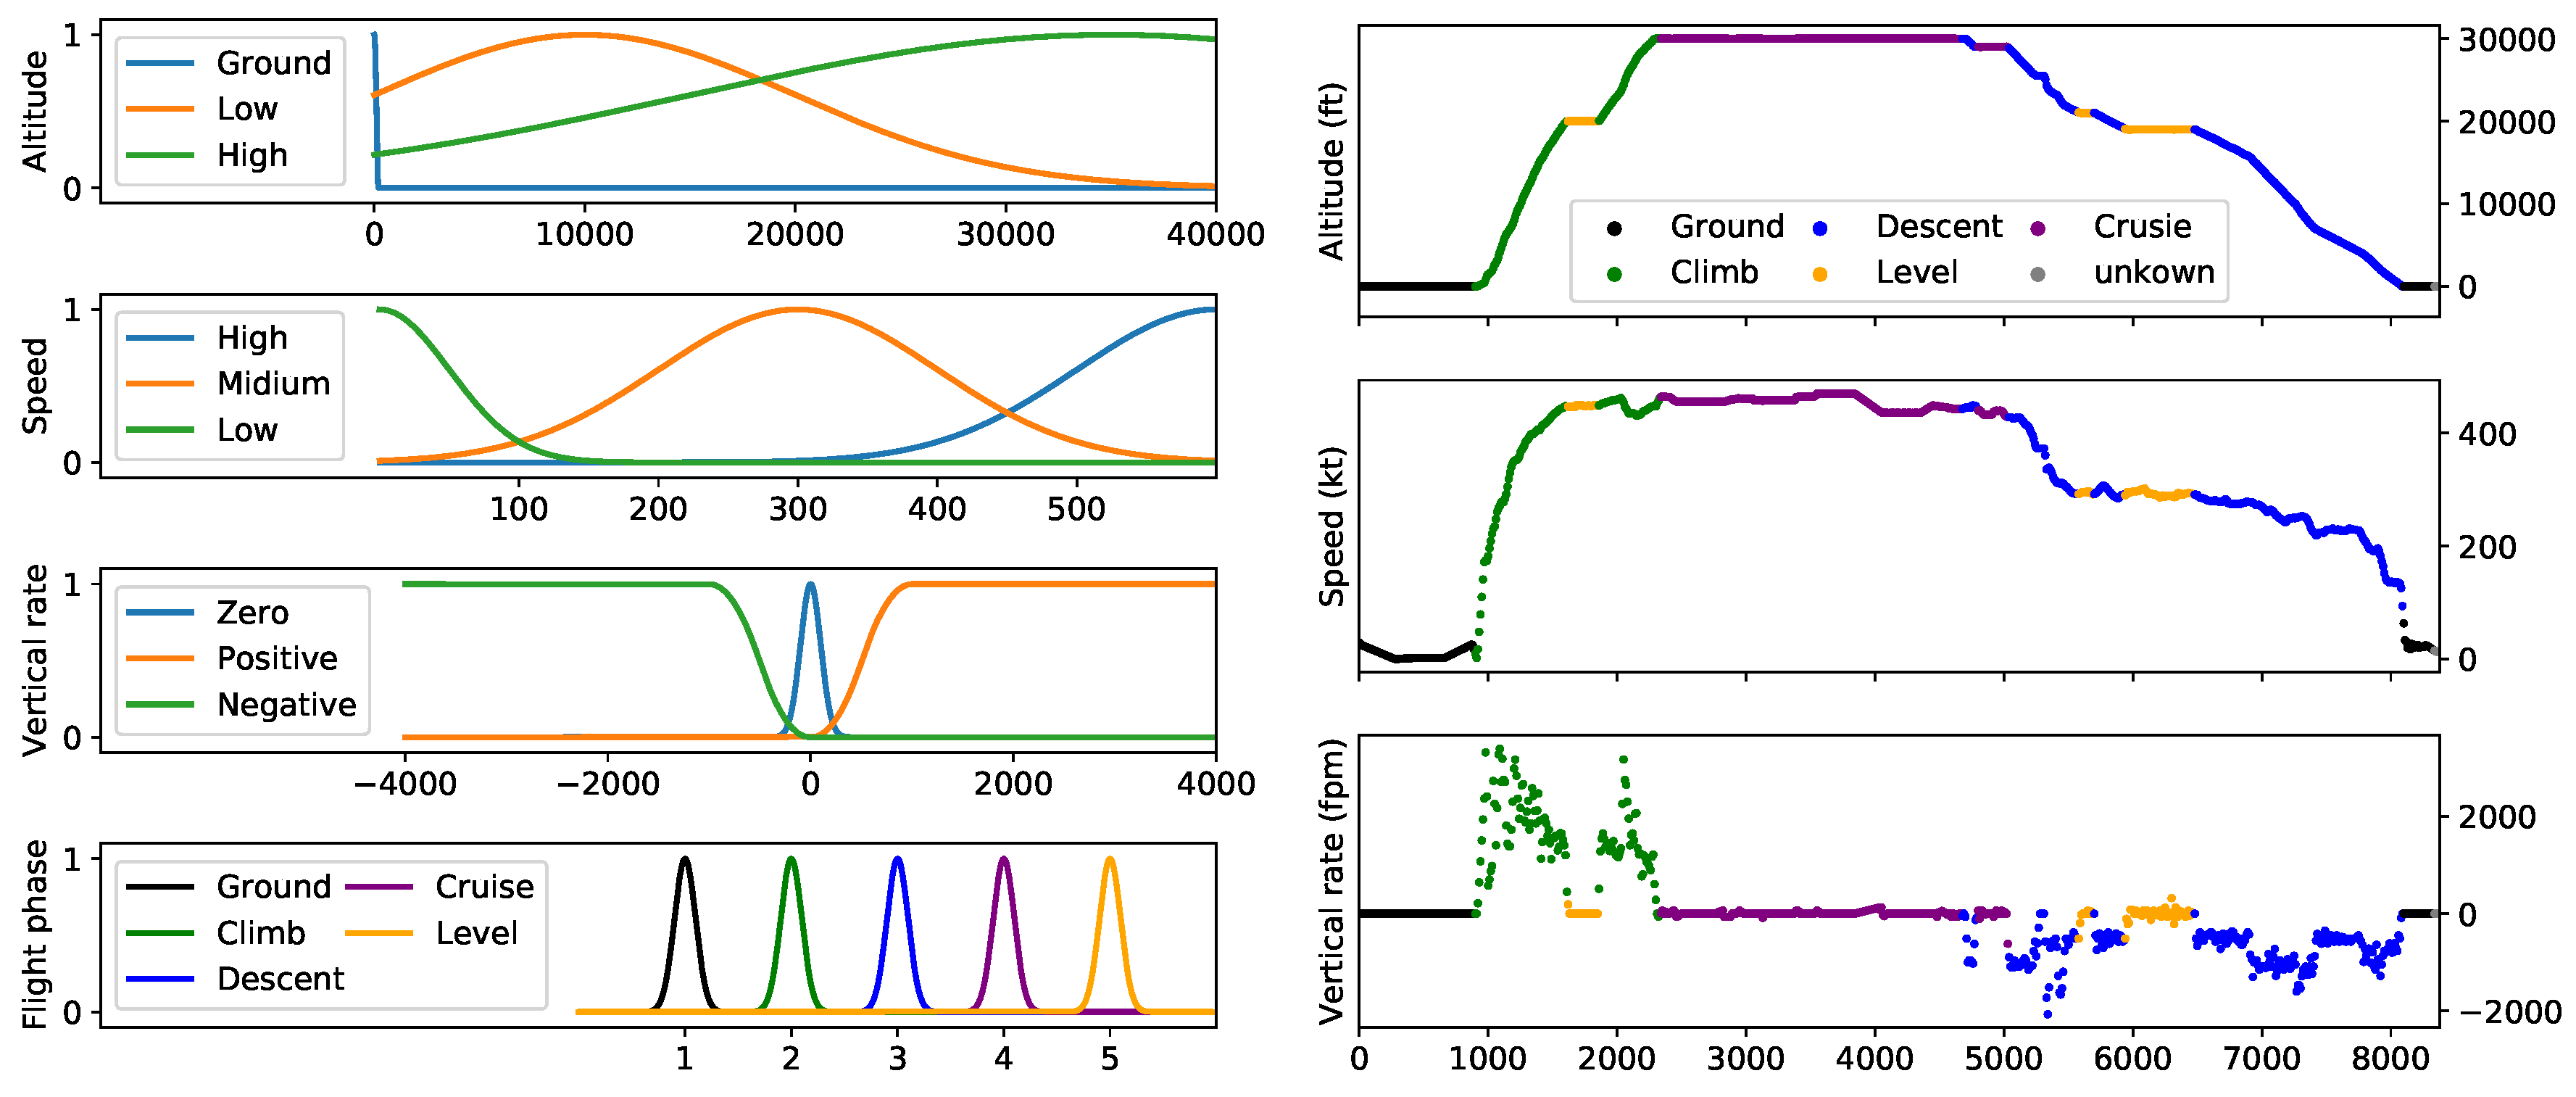
Fuzzy logic aims at modelling this way of reasoning: instead of selecting a set of fixed thresholds, the degrees of truth model target states. Degrees of truth are computed using a combination of different parameters represented by membership functions. For example, an aircraft is likely to be in cruise if it is flying at a high speed at a high altitude and has no vertical speed. With fuzzy logic, membership functions are designed to model high speed, high altitudes, no vertical speed and other possible membership states. Figure 5 illustrates the fuzzy logic phase identification implementation from OpenAP [10] on an example flight trajectory.
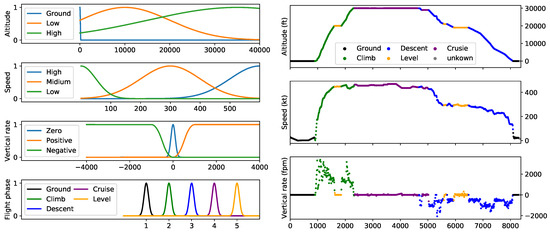
Figure 5.
Example of flight phase identification using fuzzy logic, with fuzzy logic member functions (left) and the vertical profile with identified flight phases (right).
4. Statistical Methods to Detect Specific Patterns
4.1. Runway Changes
Figure 4 suggests that rule-based methods perform well at detecting runway changes during final approach, between parallel or different bearing runways. In a previous contribution [4], we introduced a Functional Principal Component Analysis (FPCA)-based approach to detect runway changes and assess safety-related contributors for the risk of runway excursion. FPCA is a statistical tool well suited to performing dimensionality reduction through a linear operator of projection.
In this section, we compare the runway change situations detected:
- with a rule-based method: segments of trajectories aligned with a runway (ILS modelling) for at least one minute are computed for each flight; we select only trajectories yielding two different alignments without go-around;
- with a statistical method: trajectories, limited to the time series associated with the track angle values, are selected between zero and eight nautical miles before the runway threshold, scaled down to a constant number of samples (resampled), before computing their Karhunen–Loève decomposition [4]; the first component models the alignment phase with the runway, and we select trajectories with a second and third component—the variation modes associated with a runway change—above the 90th percentile.
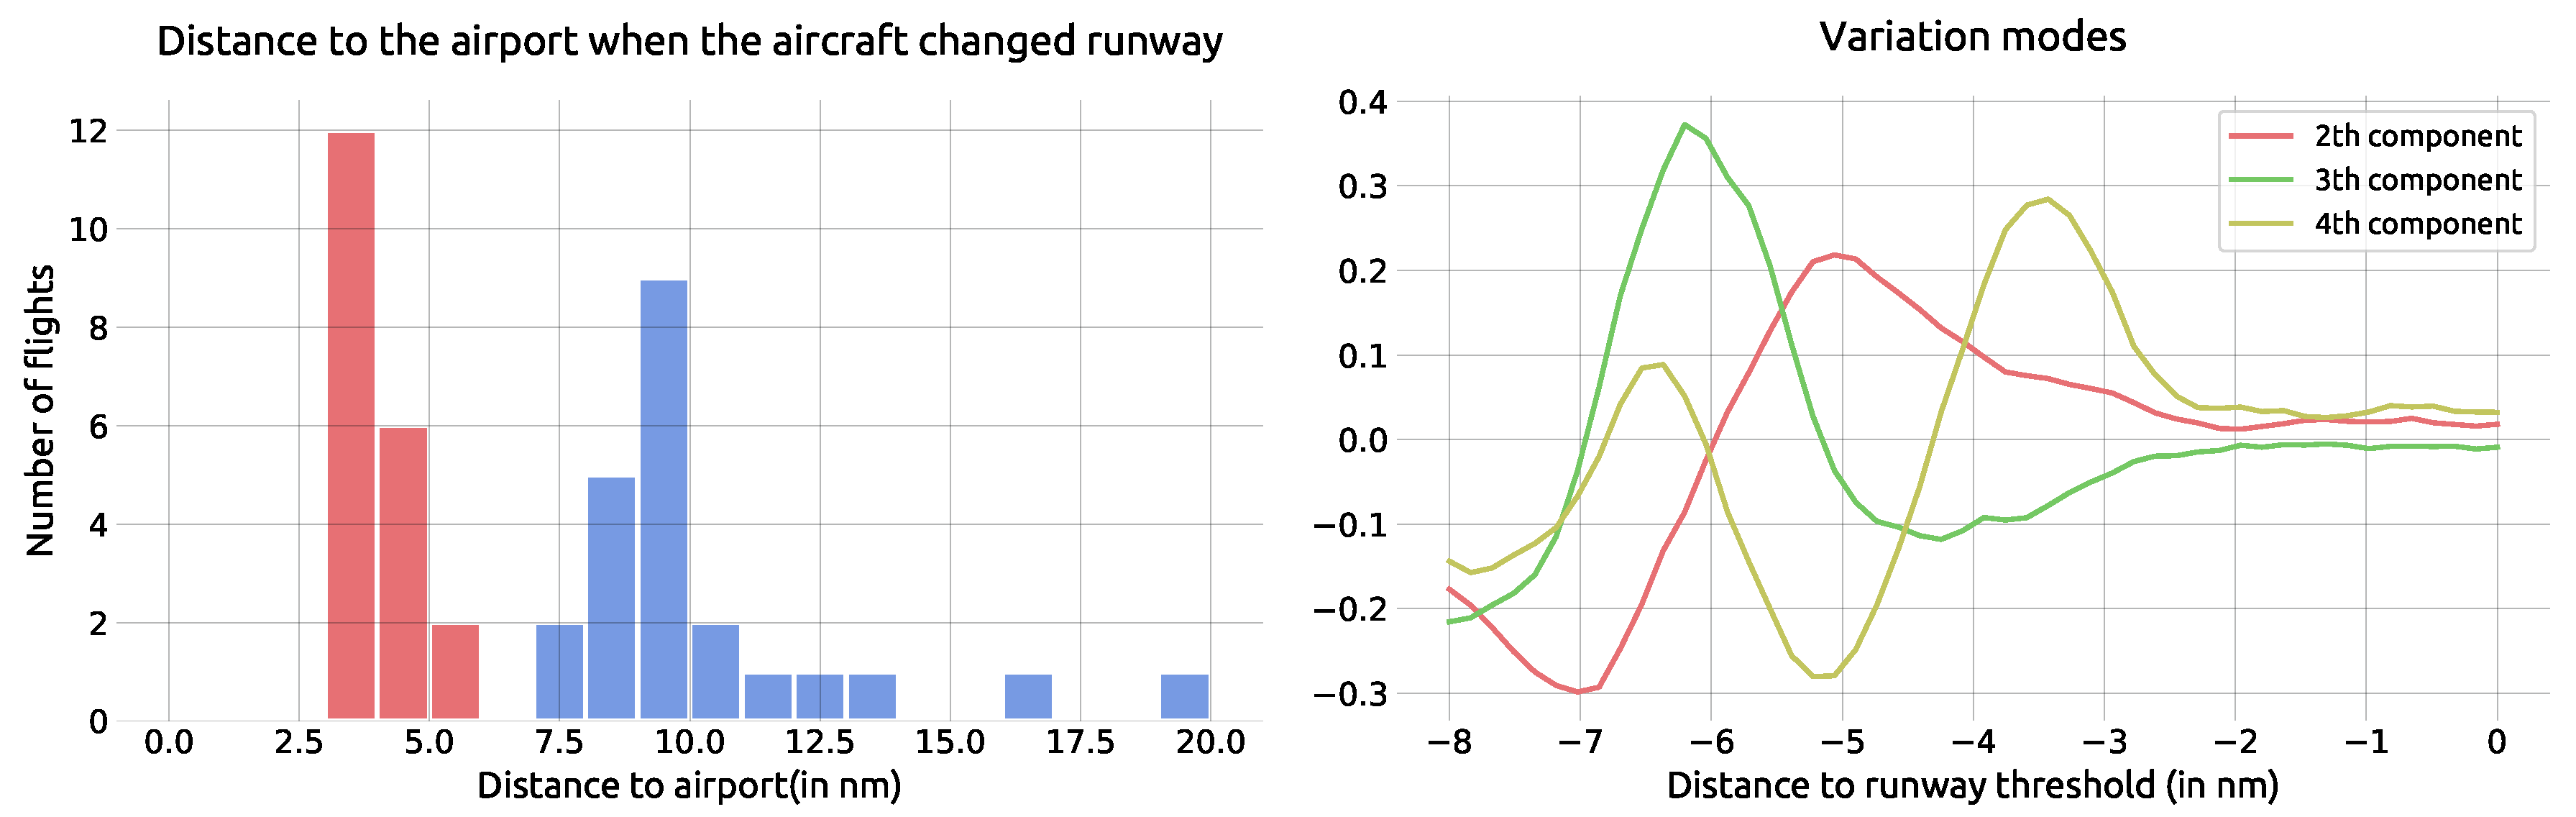
In our dataset, the rule-based method detected 183 runway change situations, 44 of which were not detected by the statistical method. Figure 6 plots on the left-hand side the distribution of distances to the runway threshold at the end of the first segment aligned with one runway for situations detected by the rule-based method, but not by the statistical method:
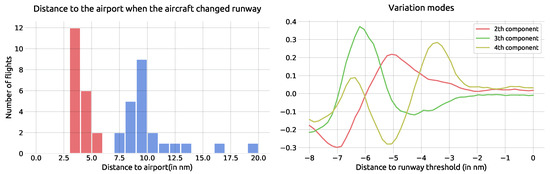
Figure 6.
The statistical method did not detect runway changes happening beyond eight nautical miles (out of scope) and within four nautical miles: the statistical model is to be refined, taking the fourth component (i.e., variation mode [4]) of the PCA into account.
- The blue part of the distribution corresponds to runway changes occurring beyond the eight nautical miles where we clipped trajectories for the statistical method. This is not a surprise as the dataset for the statistical method was clipped within eight nautical miles from the runway thresholds.
- The red part of the distribution corresponds to a very late runway change. This suggests that we should probably include the fourth component of the PCA in the criterion.
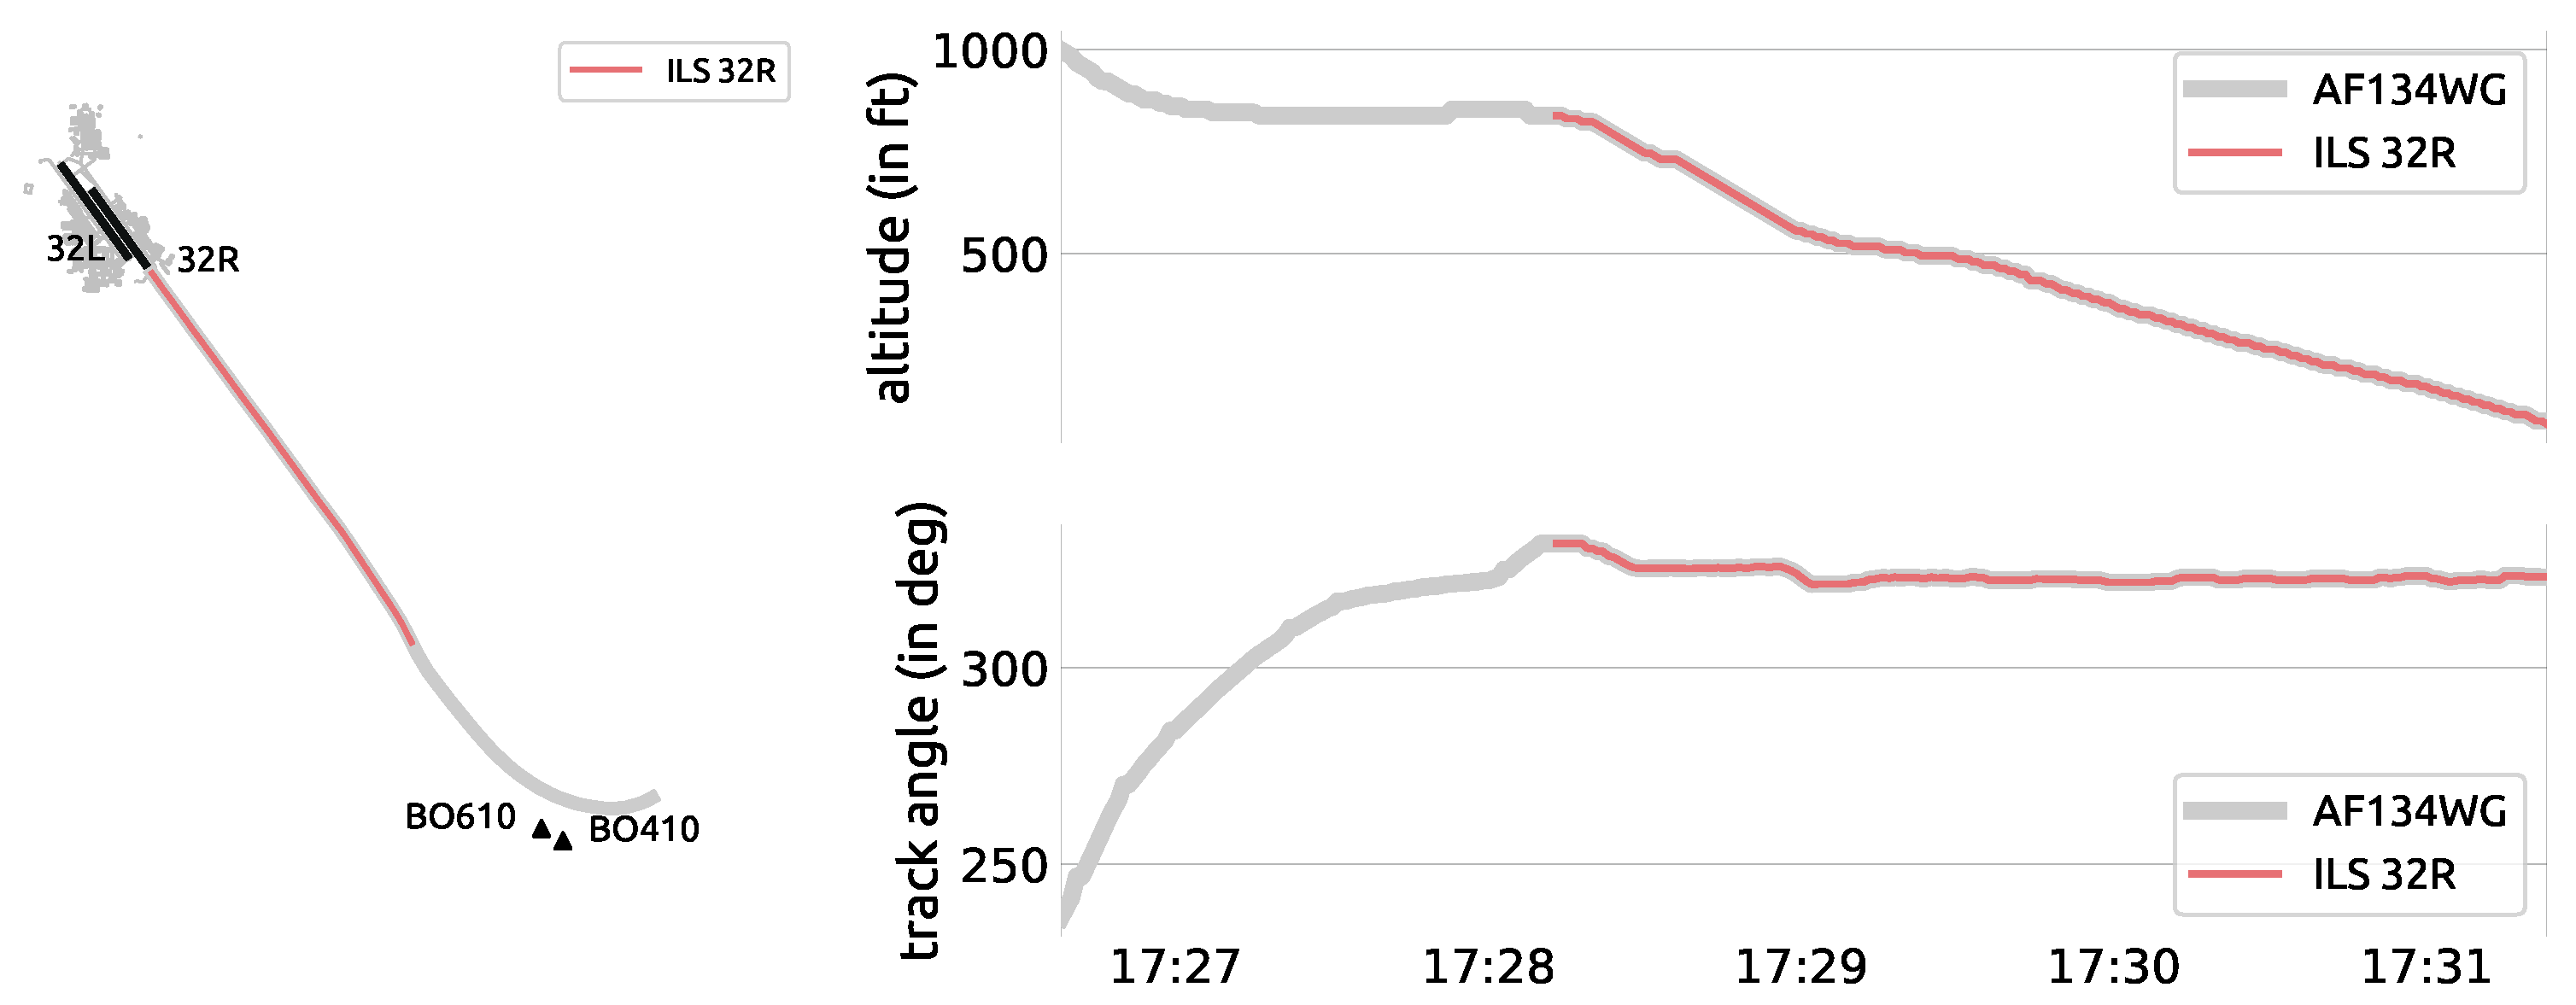
Conversely, the statistical method detected 23 situations that were not detected by the rule-based method. Indeed, the rule-based method missed trajectories catching the ILS for a period of time shorter than the fixed threshold. In Figure 7, the trajectory could look like the aircraft crossed the right runway before catching the right ILS; however, the PCA detected the variation mode, and the runway change can be confirmed from the altitude profile as the aircraft adapted to a lower glide profile.
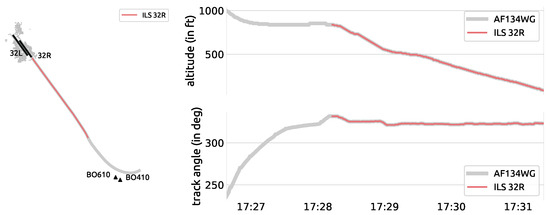
Figure 7.
The rule-based method did not match situations that had similar characteristics to regular runway changes. This late runway alignment on 32R with a late catching of the glide plan after the aircraft attempted an alignment on 32L is detected by the statistical method.
4.2. Holding Patterns
A holding pattern is a manoeuvre designed to delay an aircraft already in flight. These are commonly implemented in TMA or in flight when the crew needs to run through check lists [8]. In TMAs, holding patterns are usually designed around a holding fix, and specific rules explain how to enter and exit the racetrack pattern. A standard holding pattern uses right-hand turns and takes approximately 4 min to complete (one minute for each 180-degree turn and two one-minute straight ahead sections), but deviations are common.
It is very tempting to use this set of rules to implement a holding pattern detection mechanism, but trajectories flying similar looking patterns would result as true negatives. The first three trajectories in Figure 8 are easily mistaken (true negatives) for holding patterns because of similar features: long parallel returning tracks and self-intersecting segments. In particular, large tankers used to refuel military aircraft fly (in designated areas) a variant of classical holding patterns with longer straight lines. On the other hand, variations of holding patterns are easily missed (false positives) by rule-based methods: while it could be argued that the aircraft in a. did not engage in a holding pattern, it looks like the aircraft in b. did not fly a full pattern; as for c., it stacked two holding patterns, but it may be relevant to label the full 270 right-hand turn out of the pattern as part of it.
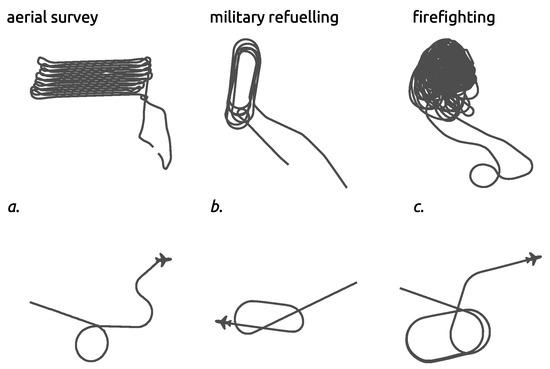
Figure 8.
Holding patterns: A set of rules based on sets of parallel lines or self-intersecting segments may mistakenly select different patterns like those displayed on the first line. On the other hand, the line between a holding pattern and other sequencing procedures is thin: the trajectory in a. has been subject to sequencing actions by the ATC because of heavy traffic, but the oval shape is not visible; the trajectory in b. looks like a holding pattern was initiated, but the full shape is not visible. The trajectory in c. stacks two holding patterns, but the way out of the pattern should probably be labelled as well.
A data-driven approach to identify such patterns is to project trajectories over a particular airspace into a lower dimensional latent space and expect them to be isolated in certain clusters or appear as outliers [5]. In an attempt to label parts of the trajectories as holding patterns, we considered sliding windows of min iterating over trajectories every min. Track angles were unwrapped, resampled, here with , and rescaled so that the first sample in each window has a track angle value of 0. Principal Component Analysis (PCA) is then used to project all samples into a lower dimension space holding most of the variance.
Figure 9 plots the resulting latent space where holding patterns tend to cluster on the right-hand side of the scatter plot. Holding patterns can then be properly labelled; commonly mistaken trajectories stay out of this cluster. The publication of the in depth details of the implementation of a properly validated holding pattern detection mechanism is planned in the near future.
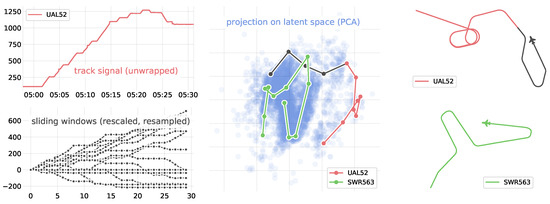
Figure 9.
The 19,480 trajectories are split into sliding windows, rescaled and resampled (30 samples per window). The resulting 72,353 samples are then projected with a PCA. Holding patterns cluster in the latent space: the red part of the trajectory is well identified as a holding pattern, whereas the green trajectory, in spite of a pattern easily mistaken with rule-based models, stays in the regular cluster.
5. Conclusive Remarks
Large-scale analysis of trajectories requires flight phase, pattern and procedure identification so as to bring useful insight to situational awareness, monitoring and decision making systems. In the first sections of this paper, we present how very simple rules based on aircraft or call sign identification can be enough to extract relevant information.
External structured knowledge about flight plans, airspace structure, procedures and operational practice is essential to implement relevant rule-based detection mechanisms, whereas statistical machine-learning-based methods are of great help when access to such information is sparse. Section 4 presents a more in depth analysis of the pros and cons of both approaches for two specific use cases: runway changes and holding patterns.
Rule-based methods are easy to describe. They present robust and explainable results, but are subject to many parameters to adjust in order to select corner cases only fitting part of the implemented definition, albeit widespread in the operational world. ML-based statistical methods on the other hand excel at extracting knowledge without or with poorly specified operational input; however, significant expertise is essential to interpret the results.
Based on these observations, the authors would recommend statistical methods when a detailed definition or knowledge about context and external constraints is missing. Based on the results and extracted information, rule-based methods should be considered and implemented, and the performance of both approaches should be reviewed without bias.
Author Contributions
Conceptualization, X.O.; methodology, X.O. and J.S.; software, X.O. and A.L.; validation, X.O. and J.S.; investigation, X.O. and J.S.; resources, X.O.; data curation, X.O. and A.L.; writing, original draft preparation, X.O.; writing, review and editing, X.O., J.S., and L.B.; visualization, X.O. All authors read and agreed to the published version of the manuscript.
Funding
This research received no external funding.
Conflicts of Interest
The authors declare no conflict of interest.
References
- Schultz, M.; Rosenow, J.; Olive, X. A-CDM Lite: Situation Awareness and Decision-making for Small Airports based on ADS-B Data. In Proceedings of the 9th SESAR Innovation, Athens, Greece, 2–5 December 2019; p. 8. [Google Scholar]
- Schultz, M.; Olive, X.; Rosenow, J.; Fricke, H.; Alam, S. Analysis of airport ground operations based on ADS-B data. In Proceedings of the 2020 International Conference on Artificial Intelligence and Data Analytics for Air Transportation (AIDA-AT), Singapore, 3–4 February 2020; p. 9. [Google Scholar]
- Proud, S.R. Go-Around Detection Using Crowd-Sourced ADS-B Position Data. Aerospace 2020, 7, 16. [Google Scholar] [CrossRef]
- Olive, X.; Bieber, P. Quantitative Assessments of Runway Excursion Precursors using Mode S data. In Proceedings of the 8th International Conference for Research in Air Transportation, Barcelona, Spain, 26–29 June 2018. [Google Scholar]
- Olive, X.; Basora, L. Detection and identification of significant events in historical aircraft trajectory data. Transp. Res. Part C Emerg. Technol. 2020, 119, 102737. [Google Scholar] [CrossRef]
- Olive, X. traffic, a toolbox for processing and analysing air traffic data. J. Open Source Softw. 2019, 4, 1518. [Google Scholar] [CrossRef]
- Hernandez, M.; Scarr, S.; Sharma, M. How California Uses Dozens of Aircraft to Battle Wildfires. 2020. Available online: https://graphics.reuters.com/CALIFORNIA-WILDFIRE/AIRCRAFT/bdwpkzmyyvm/ (accessed on 29 November 2020).
- Olive, X.; Tanner, A.; Strohmeier, M.; Schafer, M.; Feridun, M.; Tart, A.; Martinovic, I.; Lenders, V. OpenSky Report 2020: Analysing in-flight emergencies using big data. In Proceedings of the 39th IEEE/AIAA Digital Avionics Systems Conference (DASC), San Antonio, TX, USA, 11–15 October 2020. [Google Scholar]
- Sun, J.; Ellerbroek, J.; Hoekstra, J. Large-Scale Flight Phase Identification from ADS-B Data Using Machine Learning Methods. In Proceedings of the 7th International Conference on Research in Air Transportation, Philadelphia, PA, USA, 20–24 June 2016. [Google Scholar]
- Sun, J.; Hoekstra, J.M.; Ellerbroek, J. OpenAP: An open-source aircraft performance model for air transportation studies and simulations. Aerospace 2020, 7, 104. [Google Scholar] [CrossRef]


Publisher’s Note: MDPI stays neutral with regard to jurisdictional claims in published maps and institutional affiliations. |
© 2020 by the authors. Licensee MDPI, Basel, Switzerland. This article is an open access article distributed under the terms and conditions of the Creative Commons Attribution (CC BY) license (https://creativecommons.org/licenses/by/4.0/).