1. Introduction
The continuing integration of unmanned aircraft system (UAS) operations into the National Airspace System (NAS) requires new or updated regulations, policies, and technologies to maintain safe and efficient use of the airspace. Specifically, detect and avoid (DAA) provides a UAS with the situational awareness, alerting, and avoidance necessary to maintain separation away from other aircraft. To support development and evaluation of UAS DAA systems, the low altitude airspace needs to be characterized and modeled. Previous research [
1] has shown that, given a close encounter between two aircraft, the risk is dependent on the type and size of the aircraft. Characterizing the type and size of low altitude manned aircraft can inform the development of detect and avoid (DAA) systems to mitigate this risk.
In response, we previously identified and determined that the OpenSky Network [
2], a community network of ground-based sensors that observe aircraft equipped with Automatic Dependent Surveillance-Broadcast (ADS-B) Out, would provide sufficient and appropriate data to characterize manned aircraft operations. Leveraging this previous work [
3,
4], we assess the frequency of specific aircraft types given various criteria.
1.1. Scope
This work considered only aircraft observed by the OpenSky Network, flying within the United States, Puerto Rico, and the US Virgin Islands, at or below 18,000 feet above ground level (AGL) and 18,000 feet mean sea level (MSL). Only observations from 2018 and 2019 were considered. This work does not consider all aircraft, as not all aircraft are equipped with ADS-B nor are all ADS-B aircraft surveilled by the OpenSky Network. This scope was informed by the United States Federal Aviation Administration (FAA) UAS Integration Office, along with the standards activities of ASTM F38, RTCA SC-147, and RTCA SC-228.
1.2. Contribution
The primary contribution of this paper is a repeatable process to calculate the distribution of ADS-B equipped fixed wing multi-engine, fixed wing single engine, and rotorcraft given different criteria of airspace class, altitude, location, and the number of seats onboard the aircraft. This repeatable process uses solely open source or freely available technologies. Please refer to previous work for discussion on how data sourced from the OpenSky Network was processed and assessed [
3,
4].
2. Materials and Methods
The OpenSky Network primarily surveils aircraft equipped with onboard transponders with ADS-B Out. This transponder technology was developed to leverage the proliferation of global navigation satellite systems (GNSS) in the 1990s. ADS-B was initially developed and standardized [
5,
6] to transition from ground radar and navigational aids to precise tracking using satellite signals. ADS-B requirements can vary by operating altitudes. In the United States, ADS-B Universal Access Transceiver (UAT) is allowed for operations below 18,000 feet mean sea level (MSL); and ADS-B extended squitter (ES) is required for operations above 18,000 feet MSL and is an acceptable means of meeting ADS-B Out requirements below 18,000 feet MSL. ADS-B Out refers to an aircraft periodically broadcasting its position, a unique global identifier, and other information. The identifier is the ICAO 24-bit address, with more than 16 million (2
24-2) unique addresses available worldwide.
ADS-B is not the sole transponder technology to leverage the ICAO 24-bit address, but the address is a foundational data element for ADS-B. This data element enables airspace characterization based on aircraft type using aircraft registries. We identified unique aircraft by parsing and aggregating the national aircraft registries of the United States, Canada, the Netherlands, and Ireland. Registries were processed for each year. All registries specified the registered aircraft’s type (e.g., rotorcraft, fixed wing single engine, etc.) and ICAO 24-bit address. Most also specified the maximum number of seats for each aircraft. The software to parse these registries was released under a permissive open source license (
https://github.com/Airspace-Encounter-Models/em-core/tree/master/matlab/utilities-1stparty/aircraftregistry). For this paper, we also use the following terminology when discussing aircraft:
Type—A description of how the aircraft generates lift (e.g., rotorcraft, fixed wing single engine)
Model—A specific aircraft (e.g., Robinson R44, Cessna 172)
Variant—A variant of a specific aircraft model (e.g., Cessna 172s, Cessna 172n)
We did not leverage the aircraft database provided by the OpenSky Network (
https://opensky-network.org/aircraft-database), which also seeks to correlate aircraft type and information with an ICAO 24-bit address. This existing database was not used due to the lack of information on database validation, maintenance, and transparency. While infrequent, an ICAO 24-bit address can change between aircraft, thus the identified aircraft type is dependent on the year. Unfortunately, the OpenSky Network currently only makes available their most recent database. There was also a lack of documentation on how the OpenSky Network generates their aircraft database, nor any relevant software hosted on the @openskynetwork GitHub organization (
https://github.com/openskynetwork).
We’ve previously described how the OpenSky Network data was processed [
3] using the Lincoln Laboratory Supercomputing Center [
7] with open source software (
https://github.com/Airspace-Encounter-Models/em-processing-opensky). Our approach differs from similar research that also correlated observations by the OpenSky Network with specific aircraft types. Sun et al. [
8] only considered turning maneuvers and 17 aircraft models, while Alligier [
9] only considered climbing segments associated with 11 aircraft models from 2017. Our paper assessed data from multiple years with no constraints on phase of flight and considered all aircraft models within the aircraft registries. When processing the data, Alligier [
9] required at least one raw point every 30 s, whereas we required a raw point every 20 s and detected altitude outliers using a 1.5 scaled median absolute deviations approach. Additionally, we did not comprehensively identify all aircraft, and some aircraft were classified with an “unknown” aircraft type and model. Given our limited scope to the United States and leveraged aircraft registries, the unknown aircraft rate was acceptably low; this is shown in
Section 3.3. As a result, we did not seek nor develop a classifier to infer aircraft type, such as the one prototyped by Strohmeier et al. [
10].
After processing, more than 380,000 aircraft flight hours below 18,000 feet MSL and at least 52,000 aircraft flight hours observed at 50–1200 feet AGL were available for analysis. This was based on more than 1.2 billion data points across more than 1660 h [
3] provided by the OpenSky Network. To estimate the frequency and distribution of aircraft types, we considered three different criteria based on airspace class, altitude, and the number of seats onboard the aircraft.
2.1. Airspace Class and Altitude Layer
We first classified latitude, longitude, and barometric altitude reports based on airspace class and altitude. We considered Class B, Class C, and Class D airspace classes and organized all remaining airspace, into an “other” category. The other category includes both airspace controlled by air traffic control (Class E) and uncontrolled airspace (Class G). This discretization is the same as the one implemented by statistical models of aircraft behavior [
11]. Altitude reports were then discretized into 100 feet intervals. This interval was smaller than that used by the statistical models of aircraft behavior [
11]. Previous statistical models [
12], trained using OpenSky Network data, also only used geometric altitude reports, whereas this analysis considered both barometric and geometric reports.
2.2. Generalized Operational Regions and Airspace Segmentation
Next, we classified aircraft positions based on generalized operational regions where a UAS may encounter manned aircraft. The ASTM F3442/F3442M-20 DAA performance standard [
13] and the Joint Authorities for Rulemaking on Unmanned System (JARUS) [
14] provides generalized guidance on this concept, but not specific requirements or methods to calculate these regions.
In response, we developed software [
15] to quantitatively estimate and visualize three categories of generalized operational regions for all fifty USA states. Given our objective to identify the frequency of aircraft, we segmented the airspace into volumes that assume that a UAS has a low, medium, or high likelihood of encountering a manned aircraft. These airspace segmentations may or may not strongly correlate with the likelihood of a UAS encountering a cooperative transponder-equipped or noncooperative manned aircraft. In coordination with the local airspace authority, it is possible that, for a given location, the recommended airspace segmentation could differ for cooperative and non-cooperative manned aircraft.
Using open datasets from the FAA, Natural Earth Data, the US Census, and United States Geological Survey (USGS), we generated air maps with a 1824 feet lateral grid spacing for altitudes of 499, 500, 699, 700, 1199, and 1200 feet AGL. Based on the draft durability and reliability (D&R) means of compliance (MOC) from February 2020 or FAA brief to type certificate applicants from July 2019, we assumed rural areas have a population density of 100 people per square mile or less. Specifically, our default low airspace segmentation criteria was for coordinates in uncontrolled Class G airspace, below 500 feet AGL, over a rural area (100 people per square mile or less), and at least 5 nautical miles away from aerodromes. Medium airspace segmentation criteria was more stringent, with varying requirement based on airspace class. For Class G airspace, the medium criteria was:
Below 1200 feet AGL over rural areas and away from aerodromes;
Below 500 feet AGL over rural areas and within 5 nautical miles of Class E, F, or G aerodromes;
Below 500 feet AGL over urban areas.
For positions outside of Class G airspace and for Class B, C, D, and E airspaces, the dependency on population density was removed for the following medium criteria:
Locations that failed the low and medium criteria, or if there was no terrain elevation data available, were assigned as high.
Figure 1 illustrates an example airspace segmentation map of North Carolina for altitudes of 0–499 feet AGL. It is important to note that segmentation of the airspace is sensitive to minor altitude changes. The altitude floor of Class E can start at 700 feet AGL, so a minor altitude change can lead to an increase of medium to high assumed encounter likelihood.
2.3. Aircraft Seats
The last, and arguably the most important, criteria was based on altitude and the number of seats onboard the aircraft, as many registries report the number of seats associated with the ICAO 24-bit address. We estimated the relative frequency for each aircraft type at or below 18,000 feet AGL and at or below 1200 feet AGL. For aircraft with multiple variants, we calculated the average number of seats across all instances of the same aircraft model. We did not remove seat outliers. We assert that the number of seats can be used as surrogate for aircraft size, as aircraft size typically increases with the quantity of seats. Freighter aircraft designed solely for cargo transport with a small manned crew violate this assumption. For example, the registries included multiple large Boeing 747-8F variants with eight or less seats. Because our analysis is based on the average number of reported seats per aircraft model, large aircraft are still associated with more seats.
Particularly for DAA system development, the distribution of aircraft size is more important than the relative frequency between aircraft models. The probability of detecting an aircraft is dependent upon the aircraft’s size, with larger aircraft more easily observed by primary radars or visually acquired by human pilots. It is also easier to select aircraft for flight tests based on the number of seats, rather than seeking a specific aircraft model or variant.
3. Results
This section reports the results based on the three different criteria, with the presented results and discussion focused on processed barometric altitude reports from 2019. We considered both barometric and geometric altitude reports and data from 2018 and 2019. There was no statistical difference between any of these variables. This is important because there were more observations in 2019 than in 2018, partly due to more ADS-B ground receivers participating in the OpenSky Network and an impending ADS-B requirement in 2020 (14 CFR § 91.225).
3.1. Airspace Class and Altitude Layer
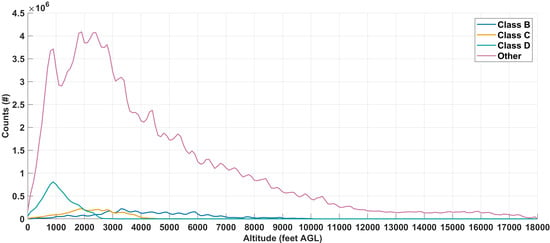
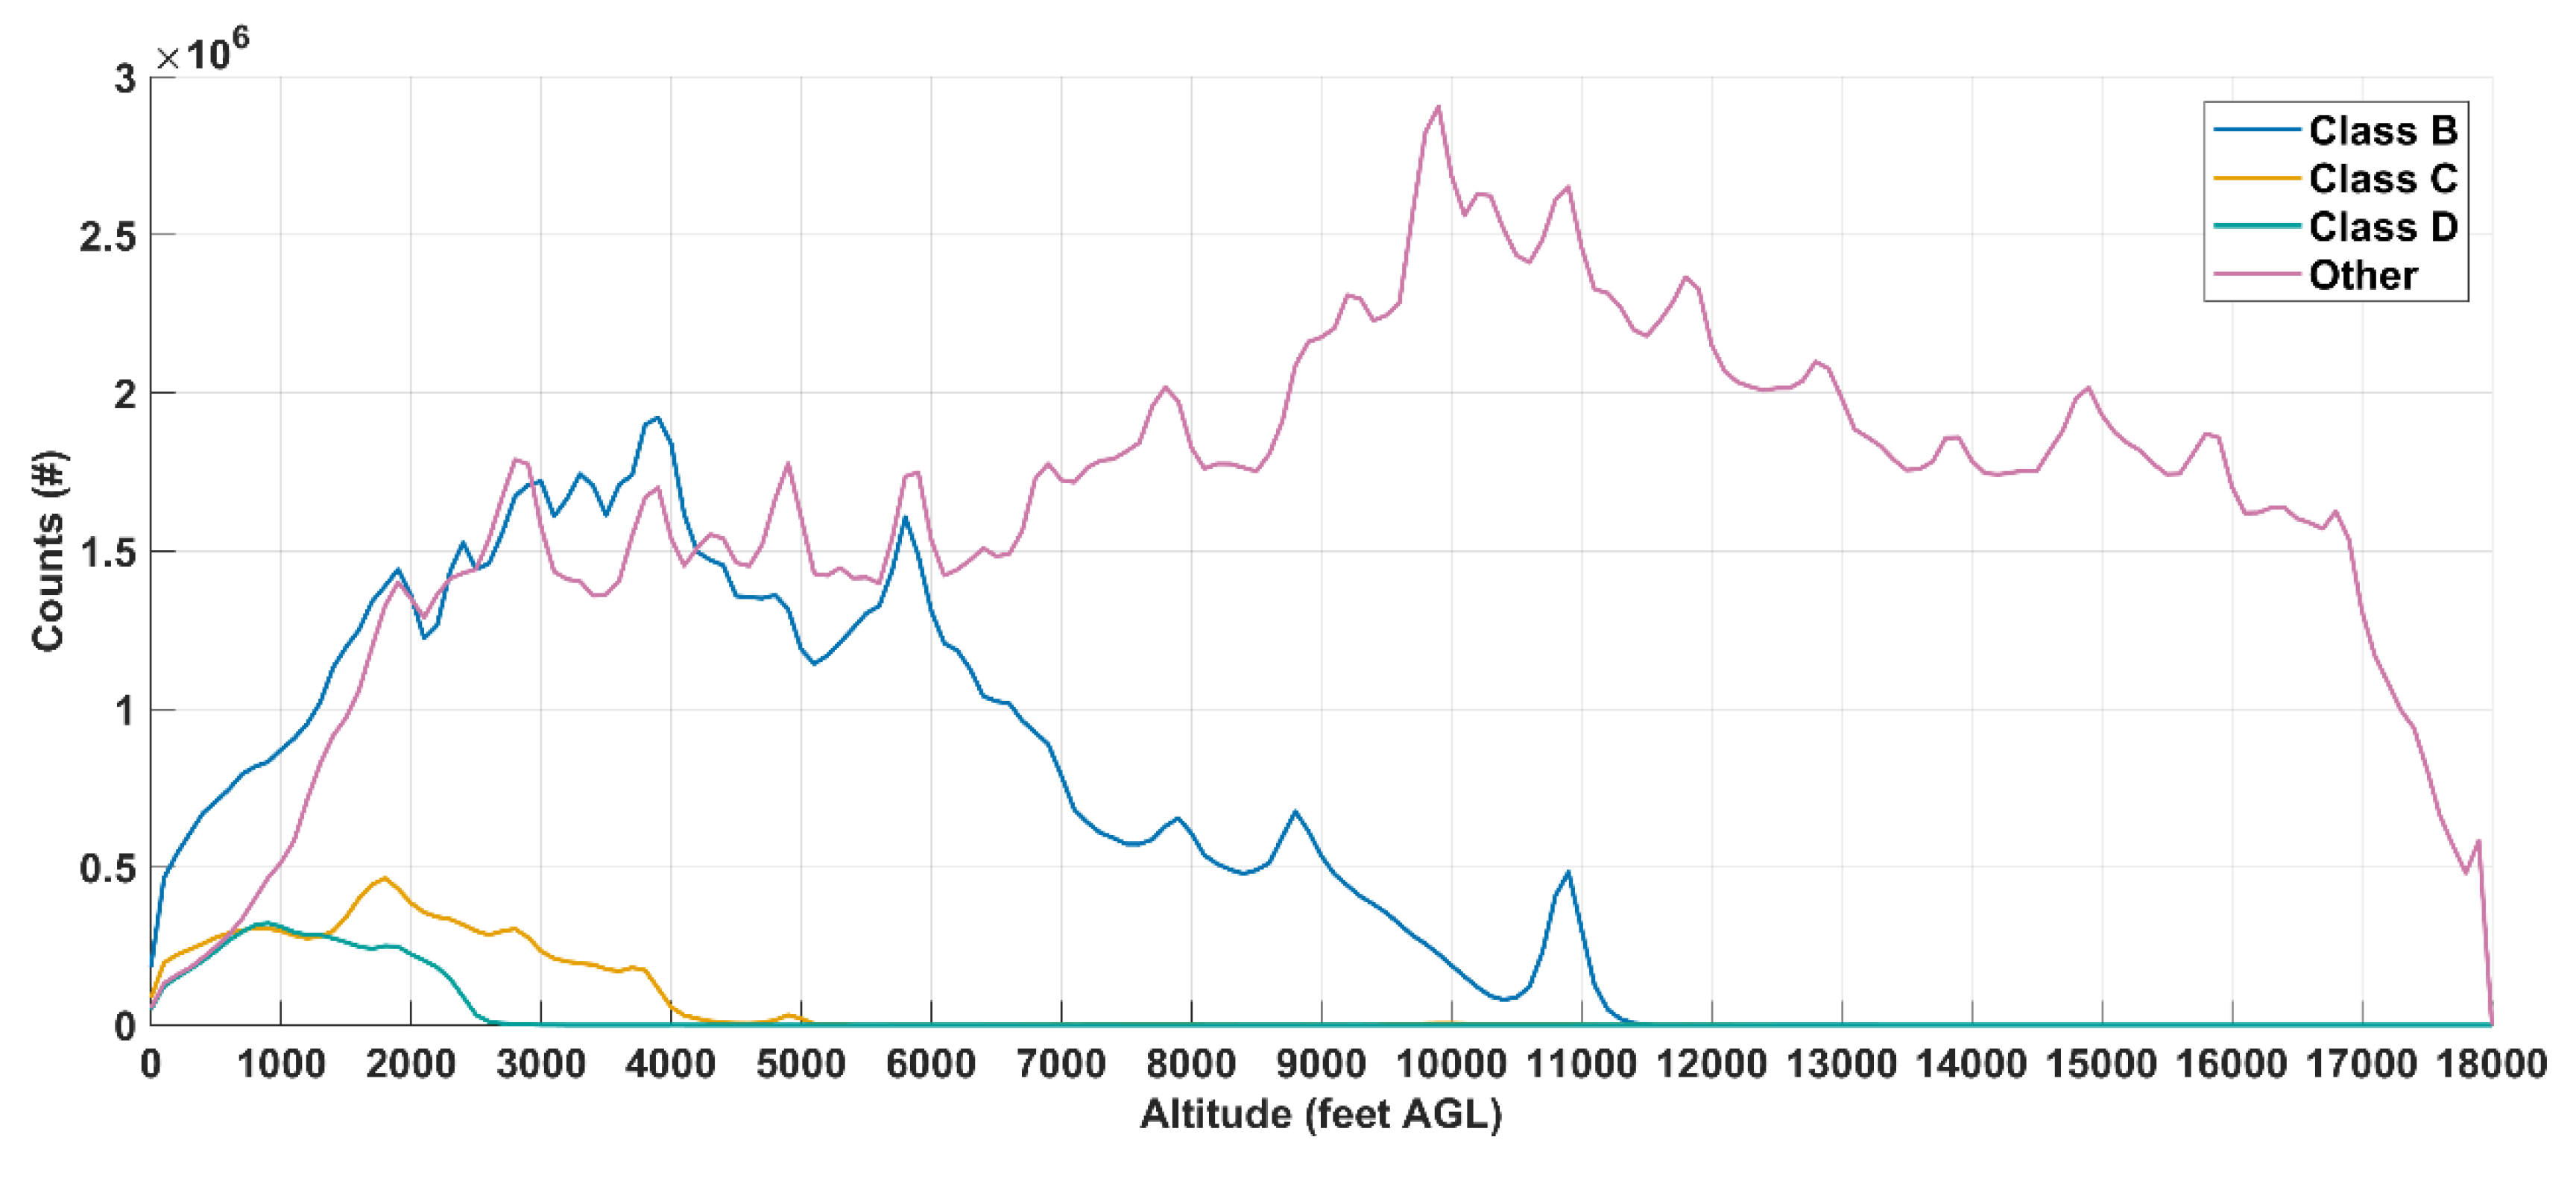
The observed altitude distributions in
Figure 2,
Figure 3 and
Figure 4 were strongly dependent on aircraft type but still indicated that, across the aggregate, UAS will encounter all three different types of ADS-B equipped manned aircraft at low altitudes. All the aircraft types had sufficient observations below 500 feet AG.
3.1.1. Fixed Wing Multi Engine
Fixed wing multi-engine aircraft tend to operate at altitudes above 5000 feet AGL with the majority of the ADS-B observations occurring in either Class B or “other” airspace. This is as expected because these aircraft primarily transport goods and people, which are more prevalent near Class B airports. Additionally, the distributions reflect the altitude ceilings of the different airspace classes. In the United States, Class D ceilings are typically 2500 feet AGL, Class C ceilings are typically 5000 feet AGL, and Class B ceilings are approximately 10,000 feet AGL.
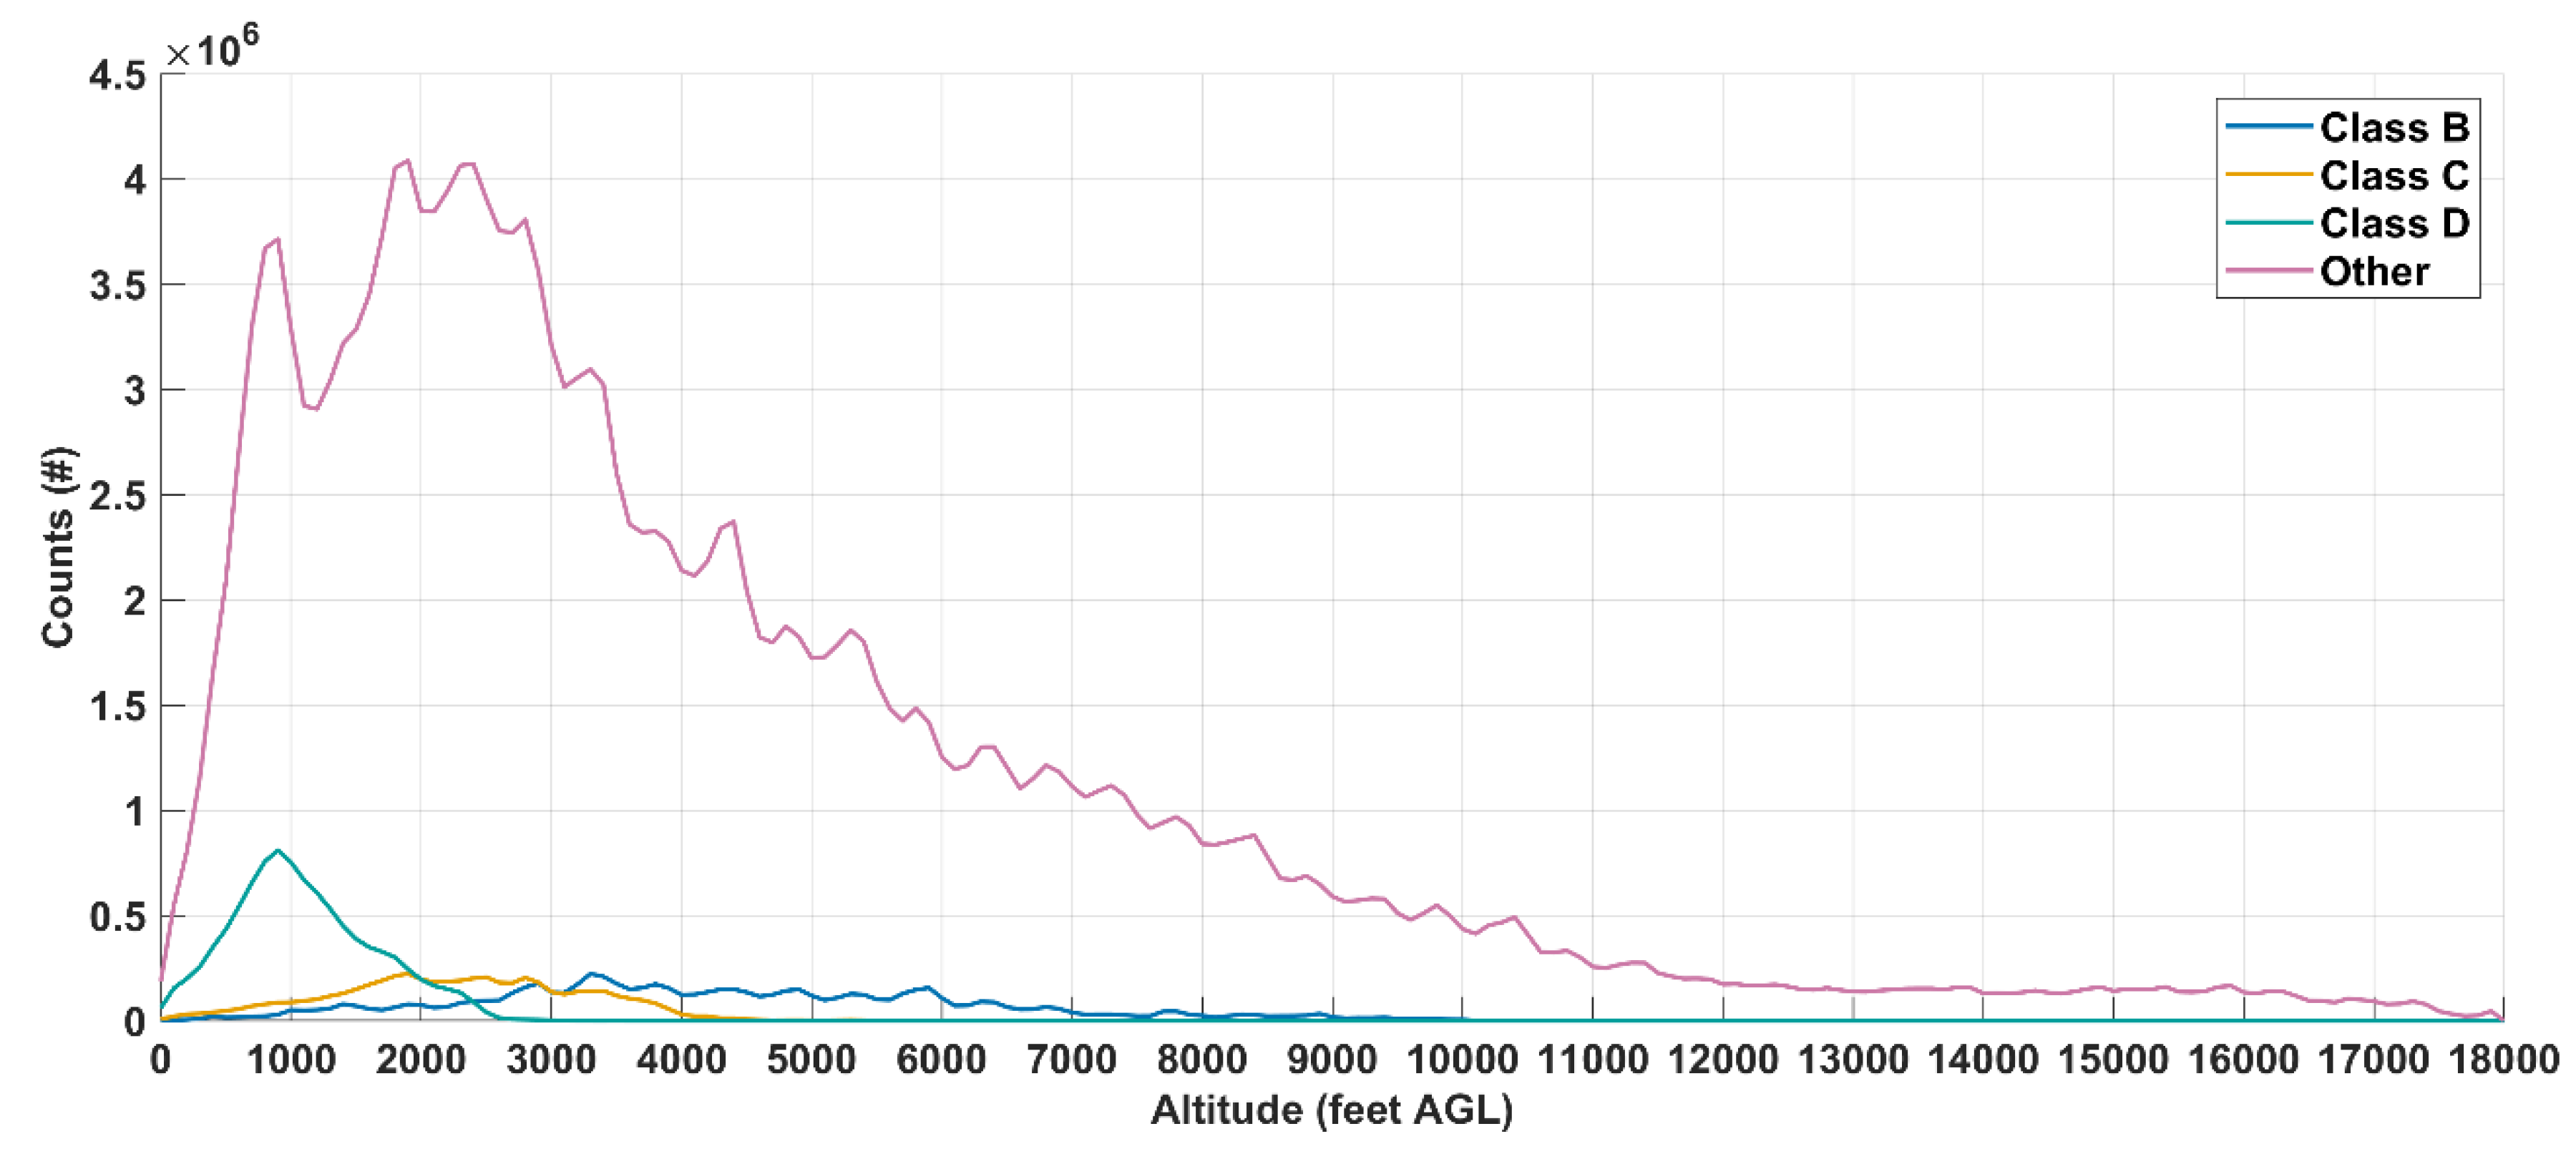
3.1.2. Fixed Wing Single Engine
There were limited ADS-B observations of fixed wing single engine aircraft in Class B, C, and D airspace. The density of observations also decreased as AGL altitude increased. These aircraft also were rarely observed in controlled terminal airspace.
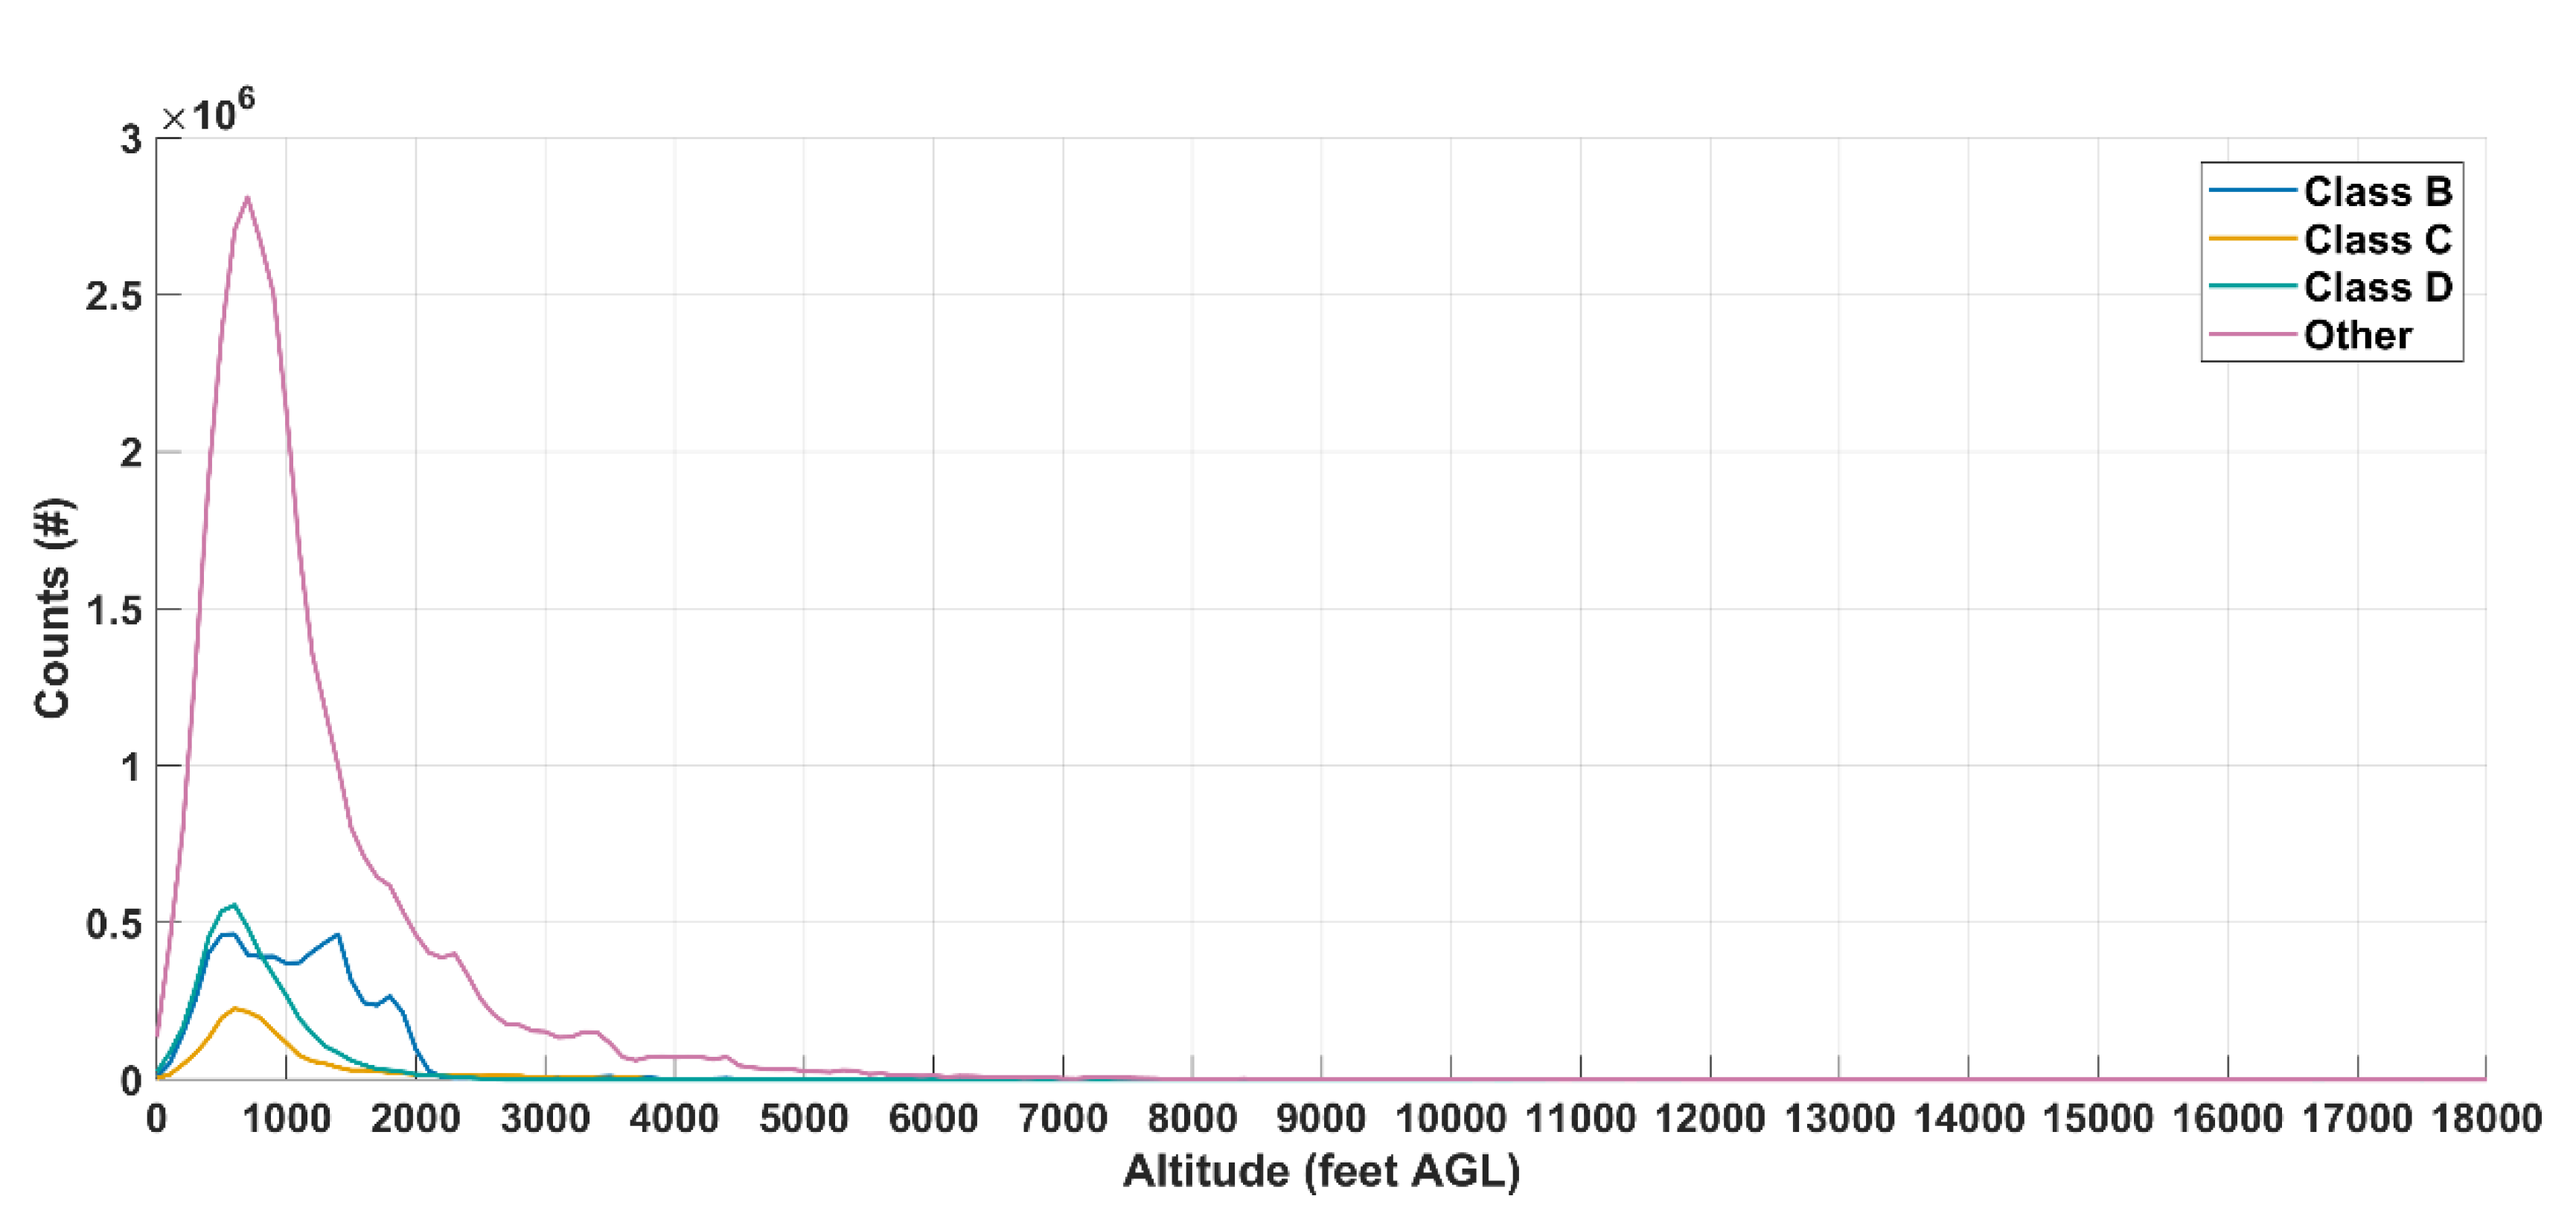
3.1.3. Rotorcraft
The majority of rotorcraft ADS-B observations were below 2000 feet AGL and outside of Class B, C, and D airspace. In comparison to ADS-B equipped fixed wing multi-engine aircraft, rotorcraft equipped with ADS-B operating altitude had less of a dependency on airspace class.
3.2. Generalized Operational Regions and Airspace Segmentation
The OpenSky Network observed fewer ADS-B equipped aircraft in generalized operational regions assumed to have a low and medium likelihood of encountering a manned aircraft. More than 95% of all observations were in the assumed high regions. Less than 1% of rotorcraft observations satisfied the low criteria, and less than 5% satisfied the medium criteria. This skewed distribution can partly be attributed to the fact that aircraft at higher altitudes are easier to surveil and so are less likely to be missed. As all observations with an altitude greater than 1200 feet AGL were associated with the high criteria and that manned aircraft, especially larger aircraft, typically fly above this altitude, it was not surprising that airspace segmentation distribution skewed to the high criteria. Because the airspace volume for the low, medium, and high criteria was not estimated, and the high criteria has significantly more altitude range up to 18,000 ft, these results do not represent the relative likelihood that a UAS will encounter an ADS-B equipped intruder aircraft in the low, medium, or high airspace segmentations. These results also do not suggest that UAS will not encounter non-transponding aircraft in regions that satisfy the low or medium criteria or are below 500 feet AGL.
Additionally, we could not determine how many ADS-B equipped aircraft satisfied the low or medium criteria but were not observed by the OpenSky Network. Surveillance performance is based on a variety of factors, such as location of the ADS-B ground receivers and if the receivers had adequate line of sight or field of view to the aircraft. Having sufficient surveillance coverage is more challenging at lower altitudes due to obstacles, the curvature of the earth, and spectrum interference.
3.3. Aircraft Seats
The number of seats was a good indicator of altitude, with larger aircraft less prevalent at or below 1200 feet AGL. The relative frequency of unknown aircraft was 1.8% or less for all aircraft types and criteria in this ADS-B based data. These results also inform evaluations based on aircraft size, specifically an extension of J.W. Andrews’ research on air-to-air visual acquisition [
16] or any general simulation that uses aircraft size to estimate a probability of detection. Simulations could also be weighted based on the observed distribution of aircraft size.
3.3.1. Fixed Wing Multi Engine
The distribution of fixed wing multi-engine aircraft (
Table 1 and
Table 2) skewed towards larger aircraft, with negligible differences between the two altitude thresholds. About 30–40% had less than 31 seats, with Beechcraft King Air and DHC-6 Twin Otters as good examples of these smaller fixed-wing aircraft. The 32 seat lower bound was selected such that the last bin included a majority of transport aircraft, with the ERJ-135 with about 37 seats as a good example of being just above this threshold.
3.3.2. Fixed Wing Single Engine
Unlike multi-engine, observations of fixed wing single engine aircraft (
Table 3 and
Table 4) skewed to six seats or less, with a more significant skew at low altitudes. Cessna 172 variants were the most frequently observed fixed wing single engine aircraft and were also some of the most observed overall.
3.3.3. Rotorcraft
As reported by
Table 5 and
Table 6, independent of any variables, the majority of rotorcraft observed had 5–8 seats. Similarly, to the other aircraft types, there was a skew towards smaller aircraft at the lower altitude.


