Abstract
In the recent past, several examples of the application of Exergy Analysis (ExA) to Very Large Complex Systems, including entire countries, have been published, and it can be fairly said that—while the goals of the individual authors were completely consistent—the results, the conclusions and the recommendations diverge. There are several contingent reasons for this, but the underlying problem is that a purely thermodynamic analysis cannot reproduce the complex influence that monetary, social, political and technological factors have on the purely “material” or “energetic” streams. Clearly, ExA represents a substantial improvement with respect to the “Material and Energy Balance Reports” published annually by most industrialized countries, because the exergy flow diagram unequivocally demonstrates how and at what penalty the primary exergy inflow (fossil fuels, renewables, ores, harvested food and other primary goods) is transformed into final energy, such as diesel fuel, electricity or other commodities. The issue here is, though, that the so-called Externalities (Capital, Labor and Environmental Effects) are, in spite of some opinion to the contrary, completely left out of the picture. It turns out though that ExA can be extended by including the exergy equivalents of the externalities. The theory is called Extended Exergy Accounting (EEA) as a reminder of the inclusion of monetary, labor and environmental “exergy costs” in the global budget. The scope of the study presented in this paper is twofold: First, the introduction of a novel approach based on the exploitation of a very disaggregated dataset, in order to perform the EEA of a whole country; second, the analysis of the results of the application of the method to the Italian society, over a five-year (2013–2017) window of observation, to extract new insights that could be useful to critically assess the trend of the exergy destruction of Italy vs. that of the GDP.
1. Introduction
The present tendency in the world seems to imply that an ever-increasing number of countries are willing to access a “Western life standard”, whereas the limited supply of primary energy is driving politicians, economists and public awareness toward an unavoidable acknowledgment of the necessity of a “sustainable” growth. A first bias is hidden within its definition, though; going back to 1987, the “Brundtland Commission” of the United Nations formally coined the term sustainable development in the report named “Our Common Future” as “development which meets the needs of the present without compromising the ability of future generations to meet their own needs” [1]. Such a definition, although attractive, is barely suitable to rigorous methodological applications, because of the fuzziness of the concept of “needs of the present” (despite globalisation, different cultures coexist on Earth, etc.), of the lack of proper guidelines to pursue the purpose and of a series of benchmark tools that may indicate whether we are indeed moving in the right direction [2]. In this regard, it is quite clear that analysts must avail themselves of an environment indicator (or a set of indicators) suggestive of the actual evolution and state of the environment. The available data sets are too often pre-filtered by scarcely objective (and at times completely unscientific) considerations, especially because of the enormous political and economic interests involved. In fact, National Energetic Balances are available for most countries of the world (e.g., [3,4,5]): extremely disaggregated mass and energy flow data are available and actually employed in statistical analysis, in order to get strategical insights. One example suffices: the energy intensity, i.e., the ratio between the primary energy consumption and the GDP, is widely adopted as a measure of “progress”, completely ignoring the “quality” of the energy flows involved. It is as if there were a historical or cultural barrier that forces analysts to deal with “First Law analyses”, completely neglecting the natural degradation along energy conversion, transportation and final use. This limitation can be overcome by the adoption of exergy analysis to evaluate the efficiency of industrial systems and countries.
The term exergy is ascribed to the Slovenian Zoran Rant [6] and quite literally means “externally available technical work”, i.e., the actual amount of energy that can be used for real, technical purposes, neglecting the amount degraded (and becoming unavailable) in the inevitably non-reversible processes that compose any conversion chain. The method of exergy analysis has been developed in the 1970s by Gaggioli, Moran, Fratzcher, Bayer, Szargut and many others [7]. At the time of this writing, the exergy methods have formed the basis for a multitude of studies performed on industrial systems and countries, e.g., [8,9,10,11,12,13,14]; although this approach represents a substantial leap forward with respect to the assessment of the “exploitation” of the primary resources that feed the final energy use, too many factors are neglected when one considers the exergy balances of a whole country: we live in an extremely complex world in which the circulation of financial resources is just as crucial for the growth of a society as the primary energy use, and the latter, in turn, is a key player in the production of wealth. Several scholars and international agencies in the last decades have underscored the importance of the reduction of the environmental impact of human activities — reduction that implies technological and thus energetic efforts. The cruxes of the problem are the so-called “externalities” (Labor, Capital, Environmental Costs): they are not explicitly considered in the context of an exergy analysis, resulting in a rather blurred picture of the system being considered. In light of these considerations, the algorithm of the exergy analysis was extended by “internalizing externalities” which can be done adopting a monetary, Second Law-based accounting (Thermo-Economics, TE) or, the so-called Extended Exergy Analysis (EEA). According to this second method, the exergy cost of a commodity is computed treating the energy carriers, the whole supply chain, labor, capital and remediation costs in terms of their embodied primary exergy, thus eliminating the monetary cost from the picture. In fact, this is the difference between TE and EEA: the former leads to a monetary cost, the latter to an exergy cost (TE can be formulated so as to lead to the calculation of an exergy cost as well, but in this case, the externalities are either neglected or accounted for by means of hybrid assessment methods [15,16]). EEA has been successfully applied to different societies [17,18,19,20], proving to be a good, rigorous and consistent sustainability indicator.
The aim of this work is twofold: First, the introduction of a novel approach based on the exploitation of a very disaggregated dataset, in order to perform the EEA of a whole country; second, the analysis of Italian society, over a five-year (2013–2017) window of observation, to extract new insights that could be useful to critically assess the trend of the exergy destruction of Italy vs. that of the GDP.
1.1. Exergy and Energy
Conservation of energy [21,22,23] is a fundamental law, a postulate, always verified even at microscales: It is remarkable, though, that even nowadays, physics cannot explain what energy actually is [21].
Despite this ambiguity, the energy conservation law is a fundamental tool for the purposes of a thermodynamic analysis: Indeed, the first step of any system analysis consists in performing an energy balance [22].
However, an energy analysis may not be the best choice for operative cases involving exploitation of resources, a very important issue in engineering where “costs” (be they defined as “monetary units per unit of product” or more fundamentally in terms of “amount of useful energy necessary to produce a unit of useful energy as a product, see below) are crucial.
The shortcomings of an energy balance approach are related to the fact that it assigns the same “value” to every form in which energy flows through the system. To witness, consider a gas turbine producing shaft power and releasing gas at a relatively high temperature (with respect to the surrounding environment): A first law evaluation cannot provide the correct information about the “quality” of the energy streams, if we agree to define “quality” the potential of producing work. Within a First Law context, 1 kWh of shaft work is equivalent to 1 kWh of thermal energy.
Second law consideration changes the picture substantially [23]:
- Two systems in different thermodynamic states, when physically communicating with each other, provide a potential for producing work.
- “Work” and “Heat” flows represent ways by which two systems attain mutual thermodynamic equilibrium by equalizing their respective thermodynamic state parameters.
- All real processes are irreversible: it is impossible to transform work into (a different type of) work, work into heat, heat into work and heat into heat (at different temperature) with no losses.
- Given that “work” and “heat” are two different forms of energy, the former can ideally be converted entirely into the latter (1 kWhwork −> 1 kWhheat); but the reverse is not true: any heat-to-work transformation requires that a portion of the high-T heat in input be dispersed into the environment as low-T waste heat: 1 kWhheat ≠ 1 kWhwork.
Exergy is defined as the maximum theoretical useful work obtained when a system S is brought into thermodynamic equilibrium with the environment by means of processes in which S interacts only with the environment [24].
Alternatively, reversing the point of view, we have another definition by Riekert [25]:
Exergy expresses the amount of work necessary to produce a material in a specified state from components common in the natural environment, in a reversible way, heat being exchanged only with the environment.
From the above, one can derive that the environment is essential in the definition of exergy:
The environment can be viewed as a system sufficiently large as to be unaffected by the thermodynamic transformations occurring inside of it, that is its thermodynamic properties (temperature, pressure etc.) remain constant throughout the process.
The dead state is defined as the thermodynamic state of the system we are considering in equilibrium with the environment: no work can be extracted from such a system [23].
For an open system in a state 1 that interacts only with a reference environment O, the specific exergy content (J/Kg) for the system is the state function [Kotas] [24]:
where h is the enthalpy of the system, V the velocity, g the gravitational acceleration, Z the height, Δg is the Gibbs potential, R the gas constant, T the temperature, c the concentration and S is the entropy; the subscript 1 and 0 refer to states 1 and 0 respectively. Where differences of velocity or altitude are negligible and there are no chemical reactions affecting the participating streams, Equation (1) reduces to the so-called physical exergy:
The main difference between energy and exergy is represented by the term in Equation (2), which represents the losses due to the irreversibility: exergy is the state function which quantifies the available (“useful”) work discounted of the losses due to irreversibility. Due to this definition, it is clear that an exergy conservation law does not exist. A new virtual scalar flow, called exergy destruction (Eδ) is required to close the “budget”.
1.2. Exergy-Based Analysis: Thermoeconomics, Cumulative Exergy Content, Extended Exergy Analysis
The first exergy-based method proposed in literature for the analysis of industrial plants was Thermoeconomics (Exergo-Ökonomie in Germany) [26,27]. Its aim was to find a compromise between a purely thermodynamic analysis, involving exergy, and a purely economic analysis, involving monetary costs; in TE, the monetary cost of a commodity, a production process etc., is allocated to the exergy content of each stream involved. TE takes, thus, into account, capital and labor costs and then converts each exergy flow into its monetary cost. The cost per unit of exergy of a product can be obtained by summing the capital and operation costs of all the components involved. Even from this simplified description, it should be clear that it is difficult to apply TE to the analysis of a country or of a system which include “non-marketable” commodities; for instance, TE cannot satisfactorily deal with what has come to be known as the “natural capital”.
A method independent from a monetary approach was developed in 1967 [15] and later refined [28,29]. The “cost” of a physical asset is expressed only in terms of its exergy content, considering the whole supply chain, from the cradle to the grave. The added value within the supply chain is taken into account by adding the exergy cost of the process to the exergy of the raw materials (the CExC, Cumulative Exergy Content).
The EEA method was first presented in Gliwice [30] and detailed in subsequent works [7,30,31]; the underlying rationale is to assign equivalent exergy values to the externalities: a portion of the exergy influx is spent to ensure the survival and growth of the population, calling this subset exergy of labor , computed as α, α < 1 where α is an econometric coefficient not specified by the theory that must be derived from the budget of the country [31] under study; the monetary circulation is converted into the so-called Extended Exergy of capital, . This second econometric parameter is also outside of the theory and must be evaluated from monetary circulation data for the country. The System-Country is subdivided into the following sectors:
- ➢
- Domestic (DO) power-consuming activities for survival and growth of human population.
- ➢
- Extractive (EX) involves the processes of mining and quarrying.
- ➢
- Conversion (CO) includes energy conversion, heat and power plants, oil refineries, other refinery and base chemistry industries.
- ➢
- Industrial (IN) includes all of the manufacturing activities which generate added value to raw materials.
- ➢
- Transportation (TR) covers transportation services, commercial and private.
- ➢
- Tertiary (TE) includes commercial, financial and all the service sector (government, schools, police, etc.).
- ➢
- Agricultural (AG). Harvesting, forestry, fishing.
The system exchanges flows of matter and energy with two additional sectors: the environment, from which raw materials are mined, and the other countries or societies collectively grouped into a generic sector called abroad.
The Extended Exergy of a generic commodity is computed as:
where EEAc is the Extended Exergy of the commodity, CExCm is the cumulative exergy content of materials involved, CExCe is the cumulative exergy content of the energy involved, EEl is the Extended Exergy of labor, EEk is the Extended Exergy of capital, EEenv is the Extended Exergy associated to the environmental remediation. All of the terms of Equation (3) are homogeneous and measured in Joules. Different types of exergy streams are exchanged among the different sectors, each sector “destroying” part of the exergy inflow. The aim of the analysis is, in fact, the calculation of the rate of exergy destruction and the identification of their causes, so as to gather information useful for the optimization of a single sector or a whole.
2. Method
What is proposed here is a method for collecting data within the context of an EE Analysis: the very extensive and detailed amount of data made available by governmental authorities, statistical agencies, utility companies, industries etc., make it possible to implement a structured “data bank” from which it is possible to derive more realistic results with a hitherto unprecedented accuracy.
2.1. Sector Classification and EE Fluxes
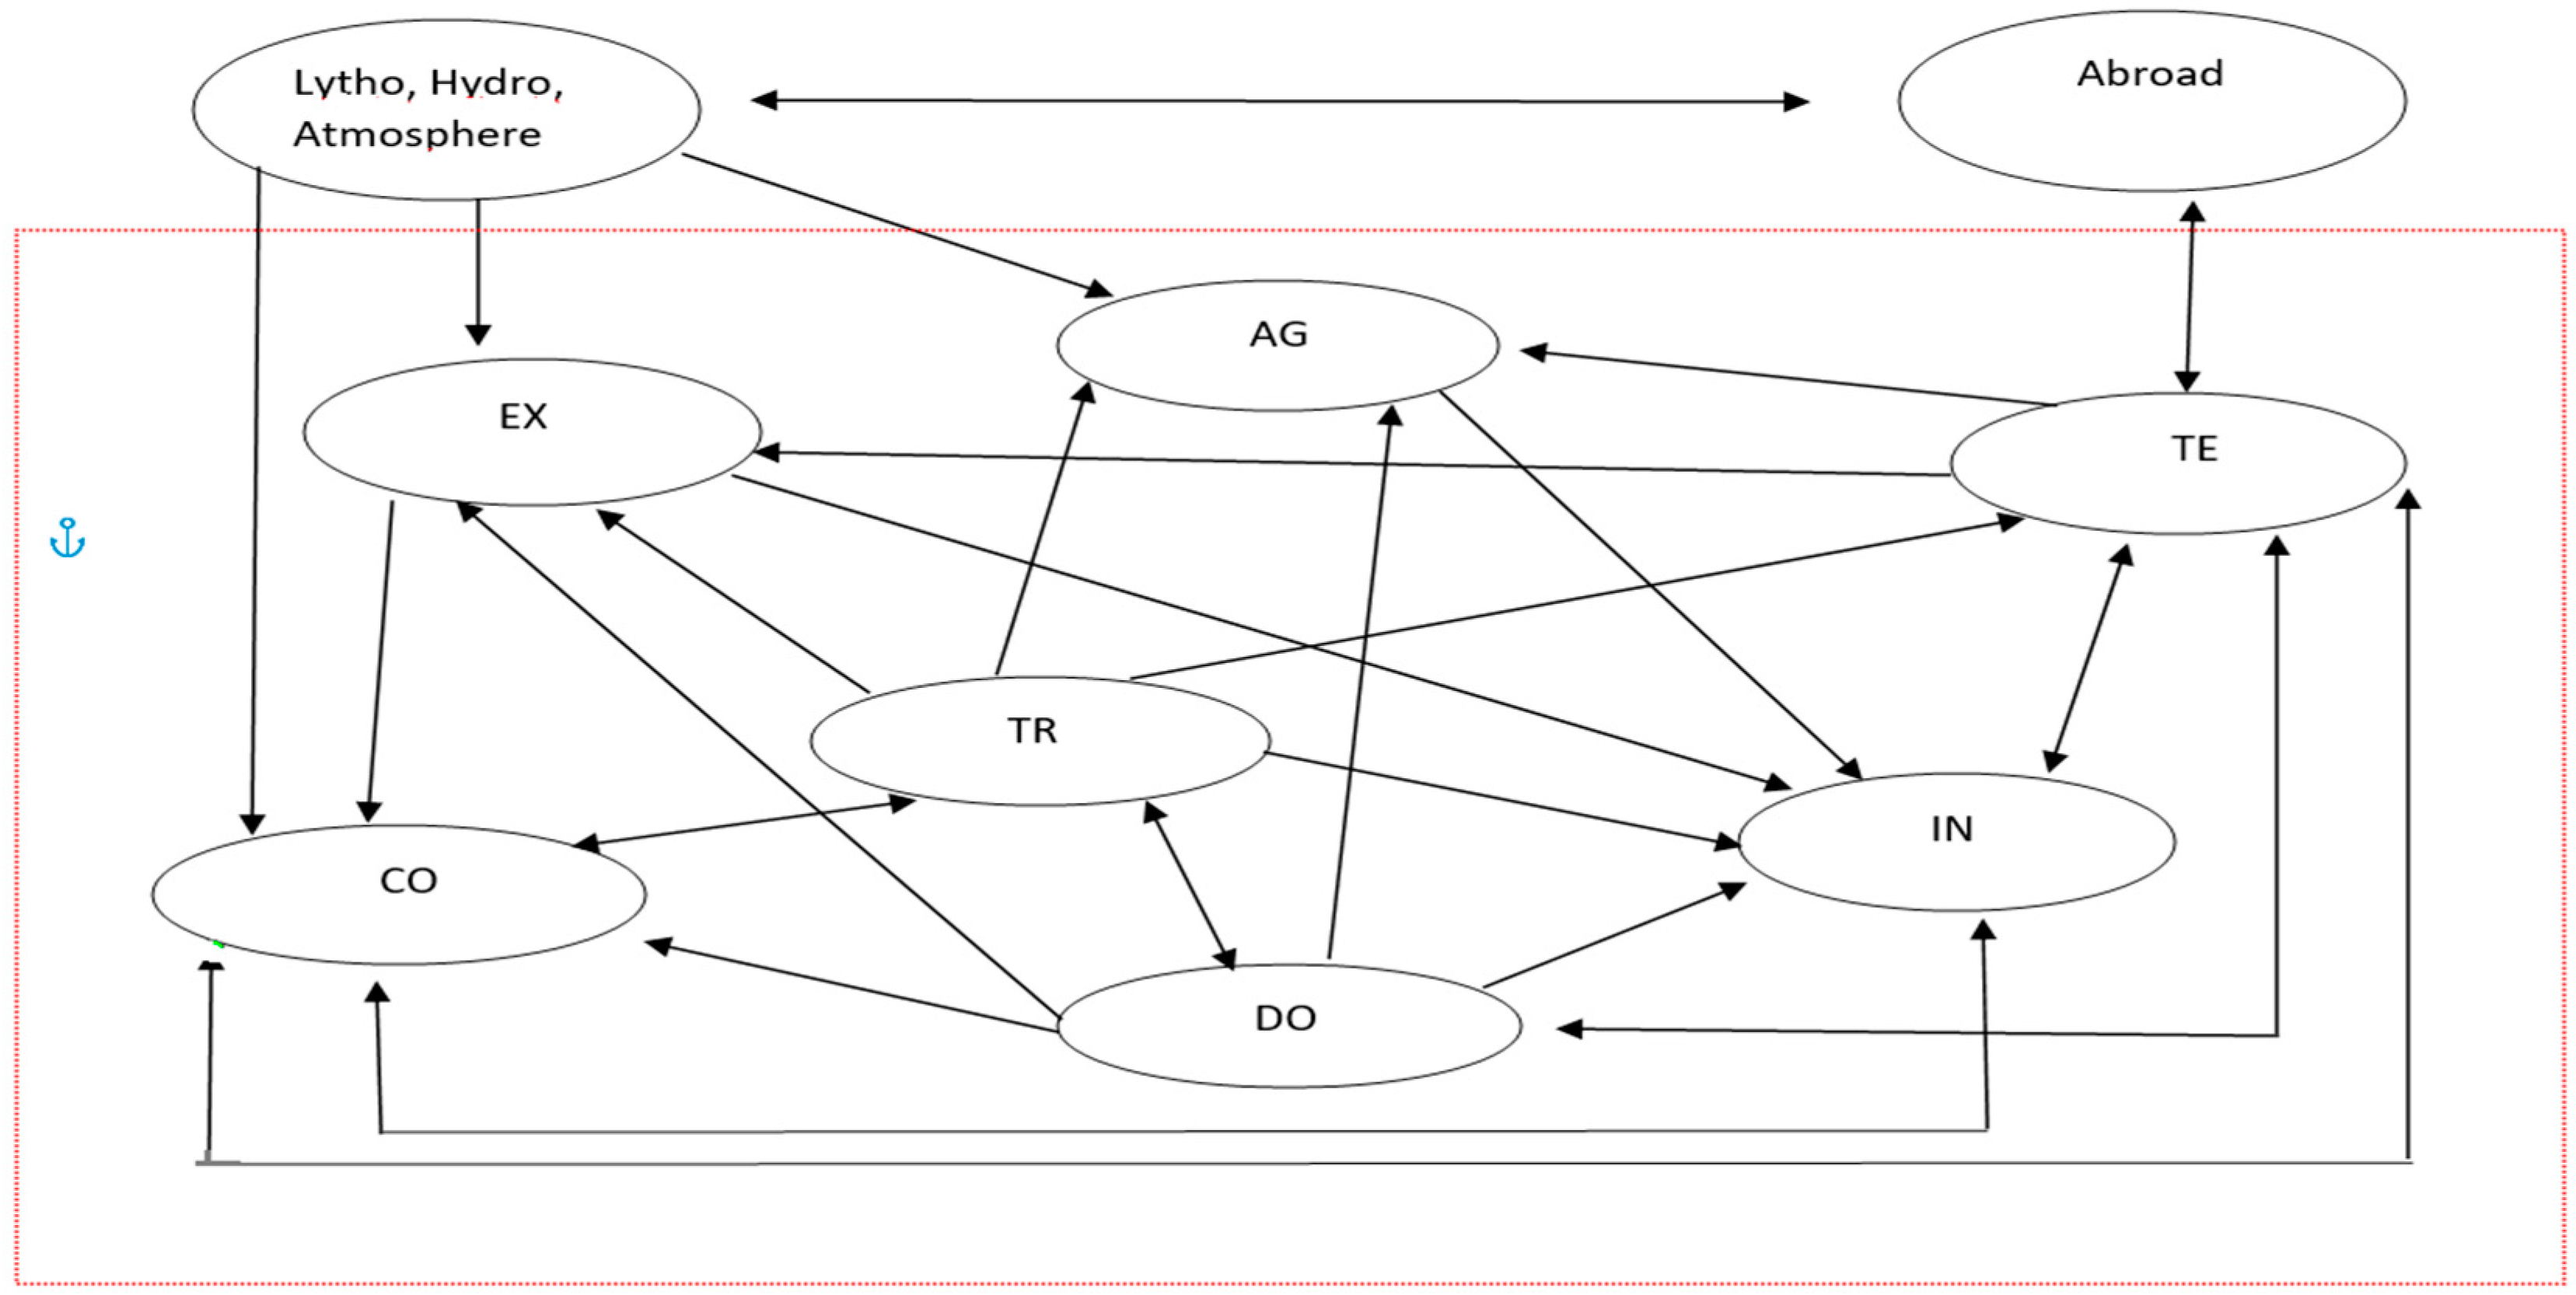
Once the above mentioned 7 sectors have been “assembled” by collecting in each one the relevant and pertinent activities, the next step is to properly identify, describe and quantify the interactions. The proposed model is outlined in Figure 1.
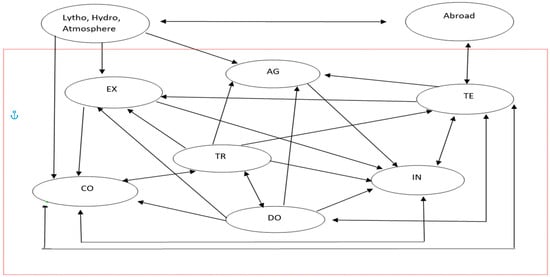
Figure 1.
Allocation of different material, energy, monetary and labor flows among the different sectors (schematic). The system “country” is contained within the boundaries defined by the red box; outside the box, the other two sectors exist, representing the “exergetic communication” of the system with the “universe”: the Environment, i.e., the lytho-hydro-atmosphere, and the other countries/communities/societies cumulatively grouped into “Abroad”.
From the environment, the society draws raw materials and primary energy, whereas there are commercial exchanges with the other communities/societies of raw materials, energy carriers and processed products.
The rationale of the allocation of the exergy fluxes is as follows:
- ➢
- EX extracts from the environment energy carriers and ores as raw materials, thanks to the energy and services supplied by TE, transports provided by TR, financial investments from TE and workers from DO. Its outputs are conveyed to CO for processing.
- ➢
- CO converts the energy carriers from EX, with their CExC and exergy of externalities, into heat and electrical energy with the generation of by-products as coke and refinery output thanks to contribution from DO, TR and TE. Renewable energy primary inputs (solar, wind, geothermal energy, hydropower) are “extracted” from the environment. The products are sent to TR, TE, IN.
- ➢
- IN generates consumer goods with added value. The products are dispatched to TE to be sold. Its inputs are EE fluxes from DO (workers), TR, AG, energy from CO (distributed by TE), raw materials from EX.
- ➢
- AG receives exergy from DO, TE, TR and the Environment, generating semi-finished products to be sent to IN and partly to DO.
- ➢
- DO supplies labor force to all of the sectors, receiving goods and services from TE, TR and, partially, from AG.
- ➢
- TR receives refinery products from CO, labor from DO and supplies all of the sectors.
- ➢
- TE provides goods and services to all of the sectors: receives the EE of CO and IN commodities and sells them to DO and all of the other sectors (for example, electricity generated in CO is sold by utilities to all of the sectors, charged with their content of EE due to the “production” of such an energy service). The exchanges with the other countries (“abroad”) represent import/export fluxes and are totally mediated in their entirety by TE.
2.2. Collecting Data
The stage of data collection shall determine the detail of the model: the more disaggregated, the more credible the results but obviously the more complicated the collection and organization. Data from different sources are summarized in graphics and tables from which it is possible to get insights that at first glance cannot be derived from “raw data”. In the future, this task might be left to specifically designed Expert Systems (Knowledge-Based methods). More specifically, let us consider the natural resources that are available for the Italian system.
2.2.1. Solar Exergy
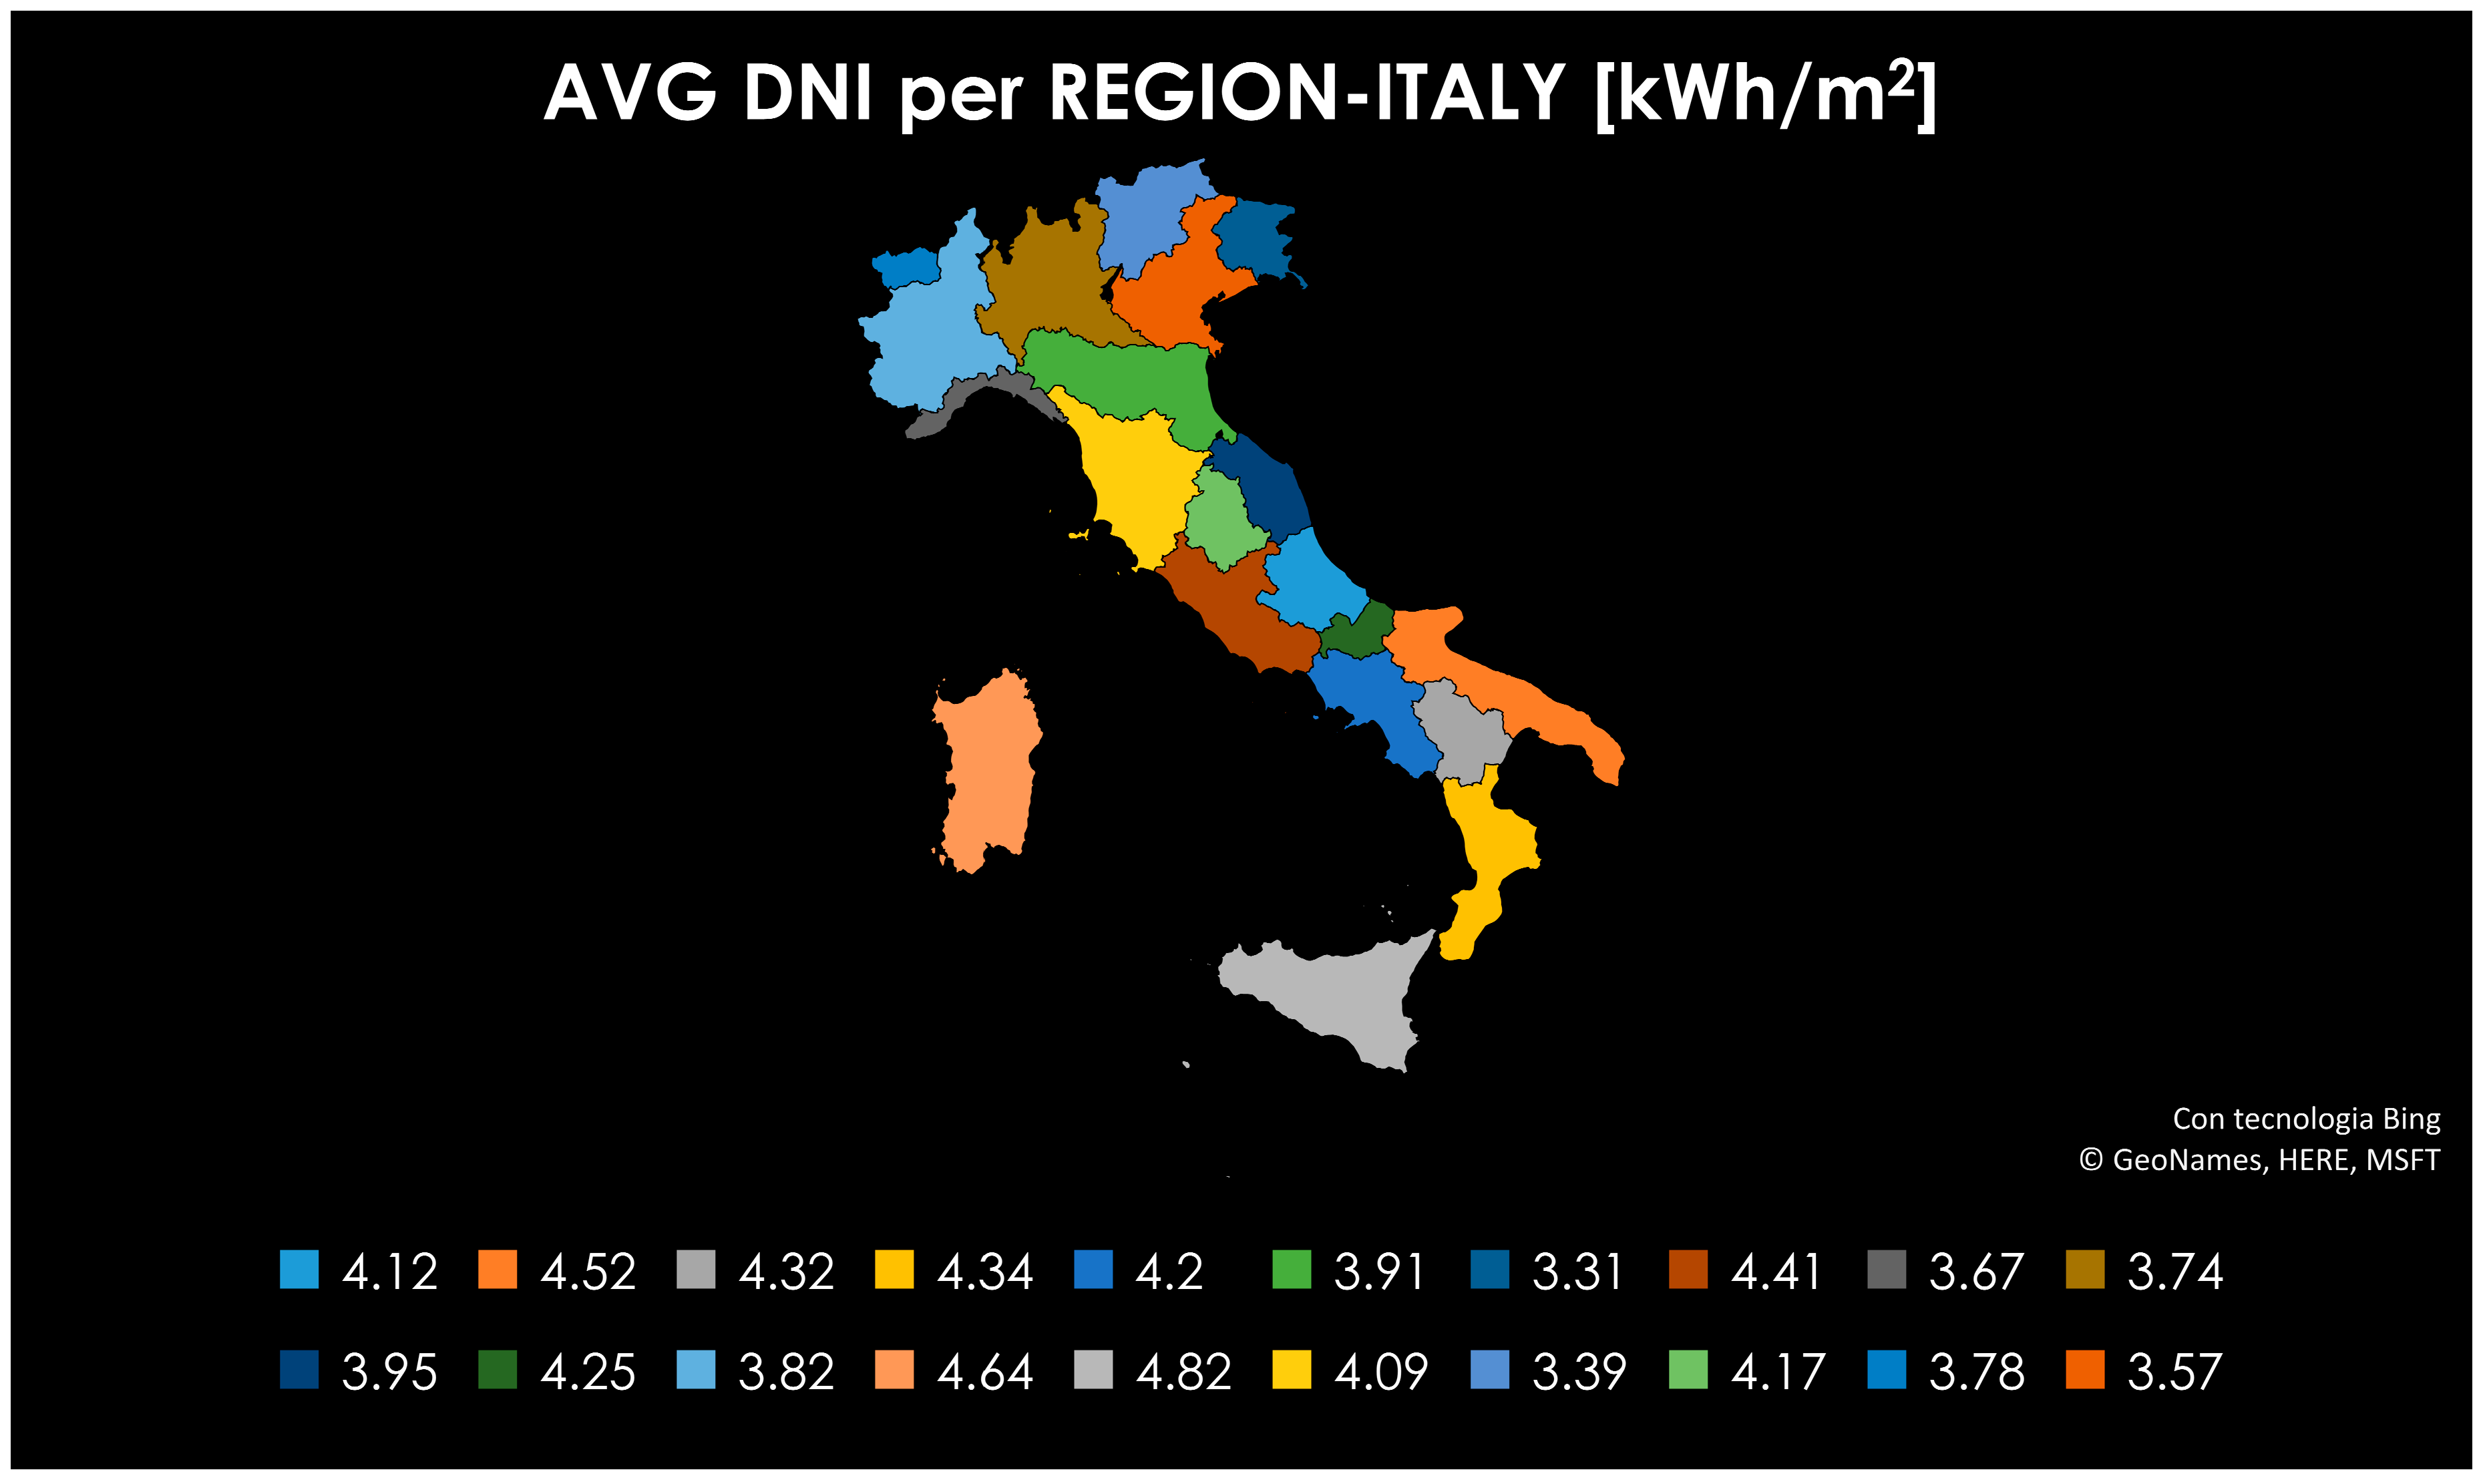
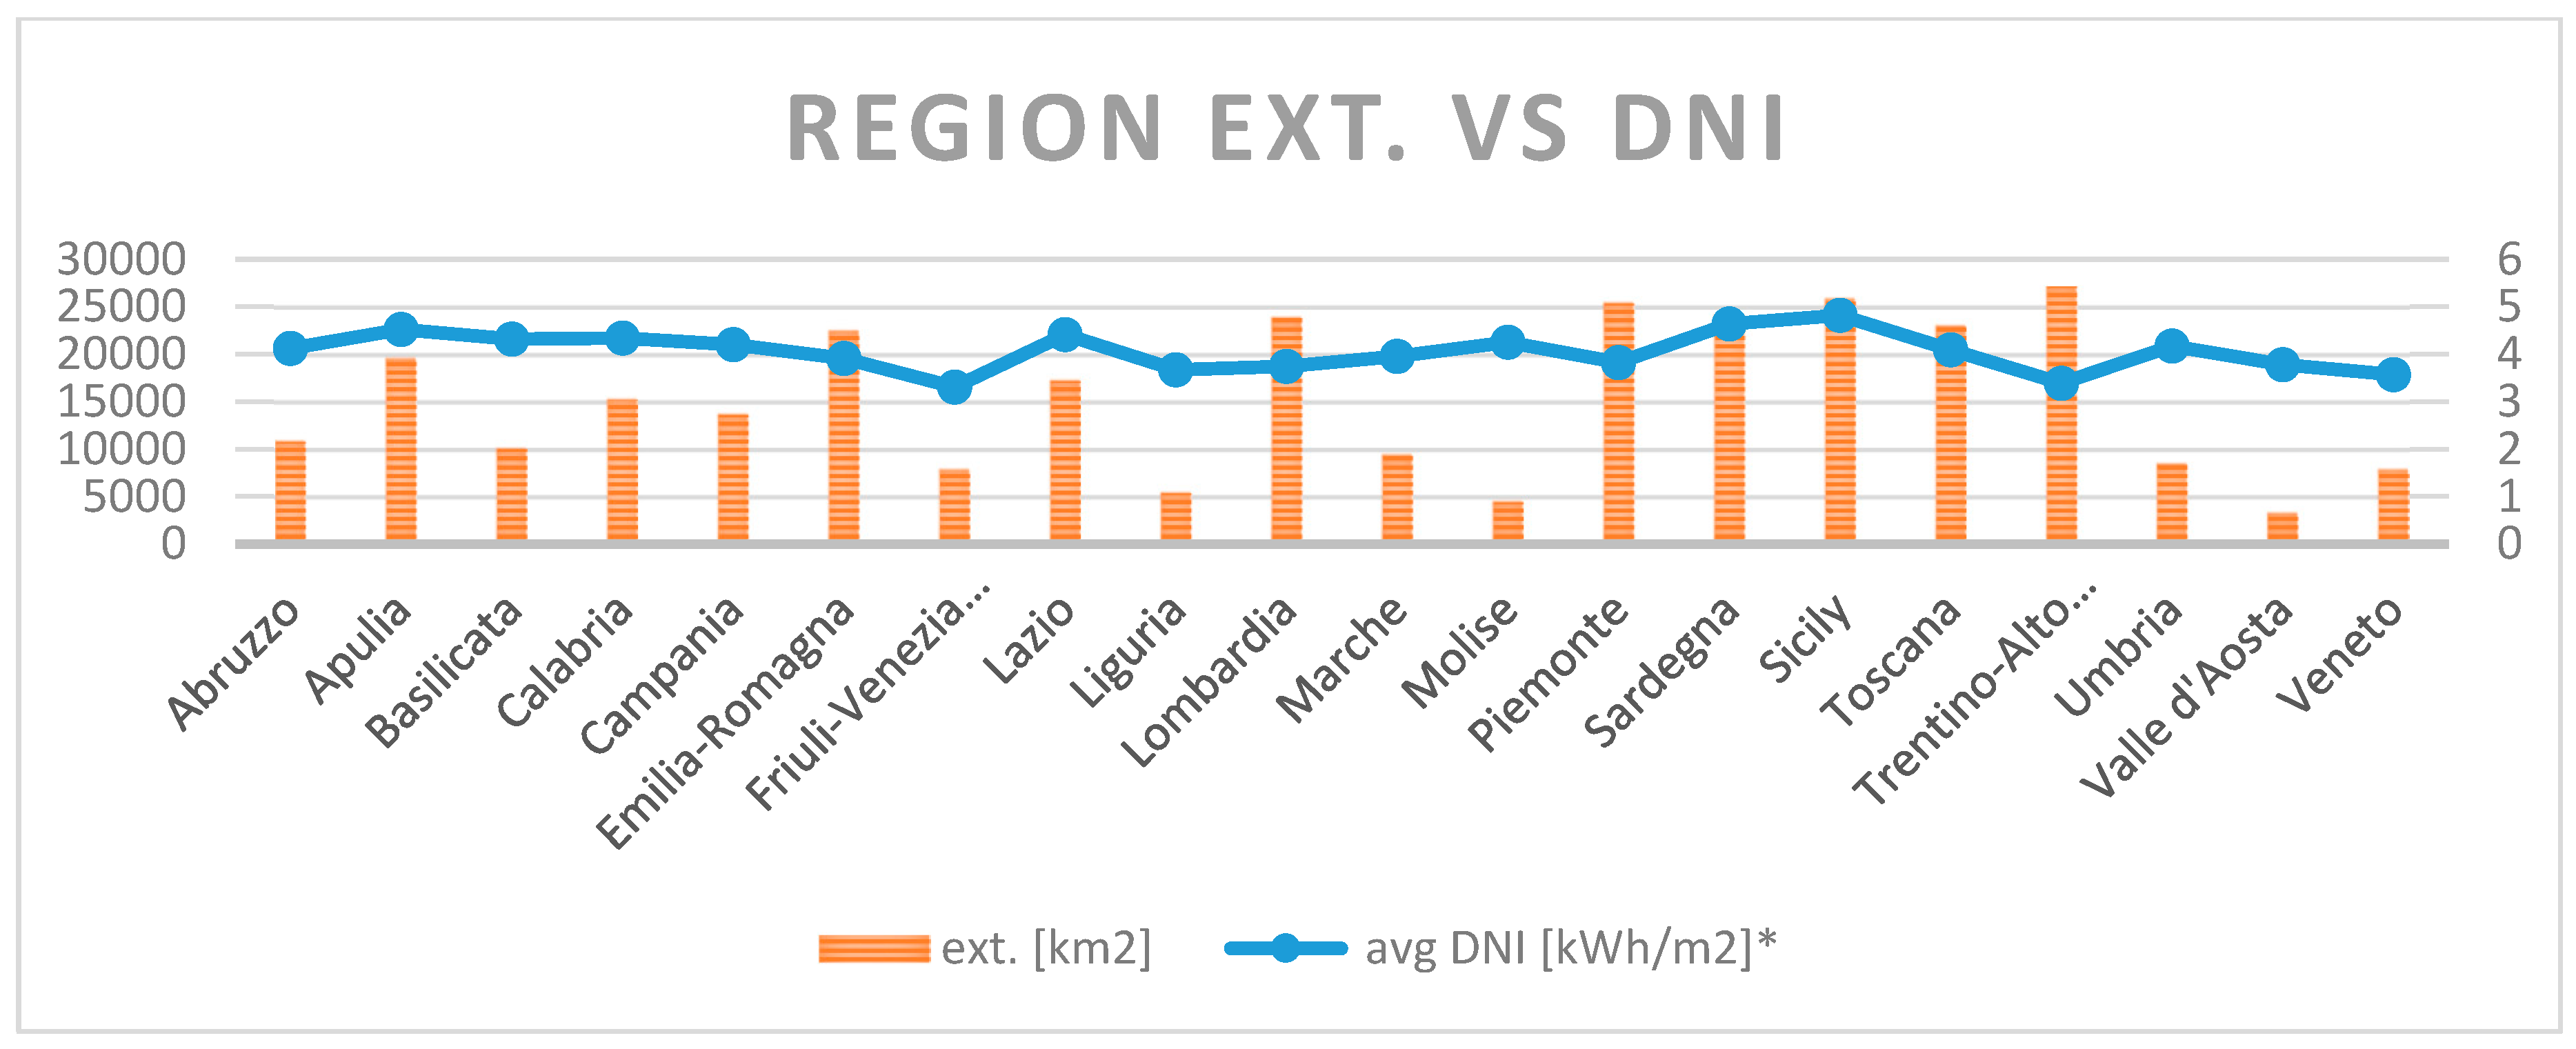
Solar irradiation is obviously an input into AG. However, a portion of it feeds thermal and photovoltaic commercial and residential installations. Figure 2 shows the average value of Direct Normal Irradiance (DNI) and the surface extension of each region of Italy (data collected from [32,33]).
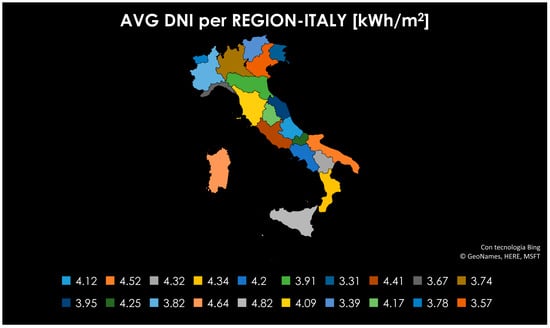
Figure 2.
Distribution of average DNI (Direct Normal Irradiance) in Italy.
As illustrated in Figure 3, in Italy as in most countries, the DNI distribution is not homogeneous, displaying a minimum value of 3.31 kWh/m2 in Friuli-Venezia Giulia and a peak of 4.82 kWh/m2 in Sicily. For the sake of simplicity, a “representative” DNI value was obtained as a weighted mean of the regional values, using the surface extension of each region as weight. The result is an average DNI for Italy of 4.01 kWh/m2.
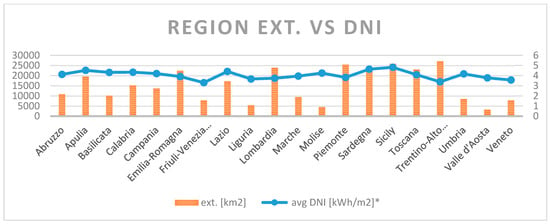
Figure 3.
Average DNI of each Italian region vs. their extension.
Assuming an average yearly temperature of 298K, the ratio between Solar Exergy and Energy equals 0.95 [22], thus the average exergy value of solar power interesting Italy equals the average DNI times the surface of the whole country times 0.95; the result is an average exergy value of 1.9 EWh.
2.2.2. Hydraulic Exergy Potential
For the estimation of the exergy potentially extractable from the Italian territory, the following procedure was adopted:
- ➢
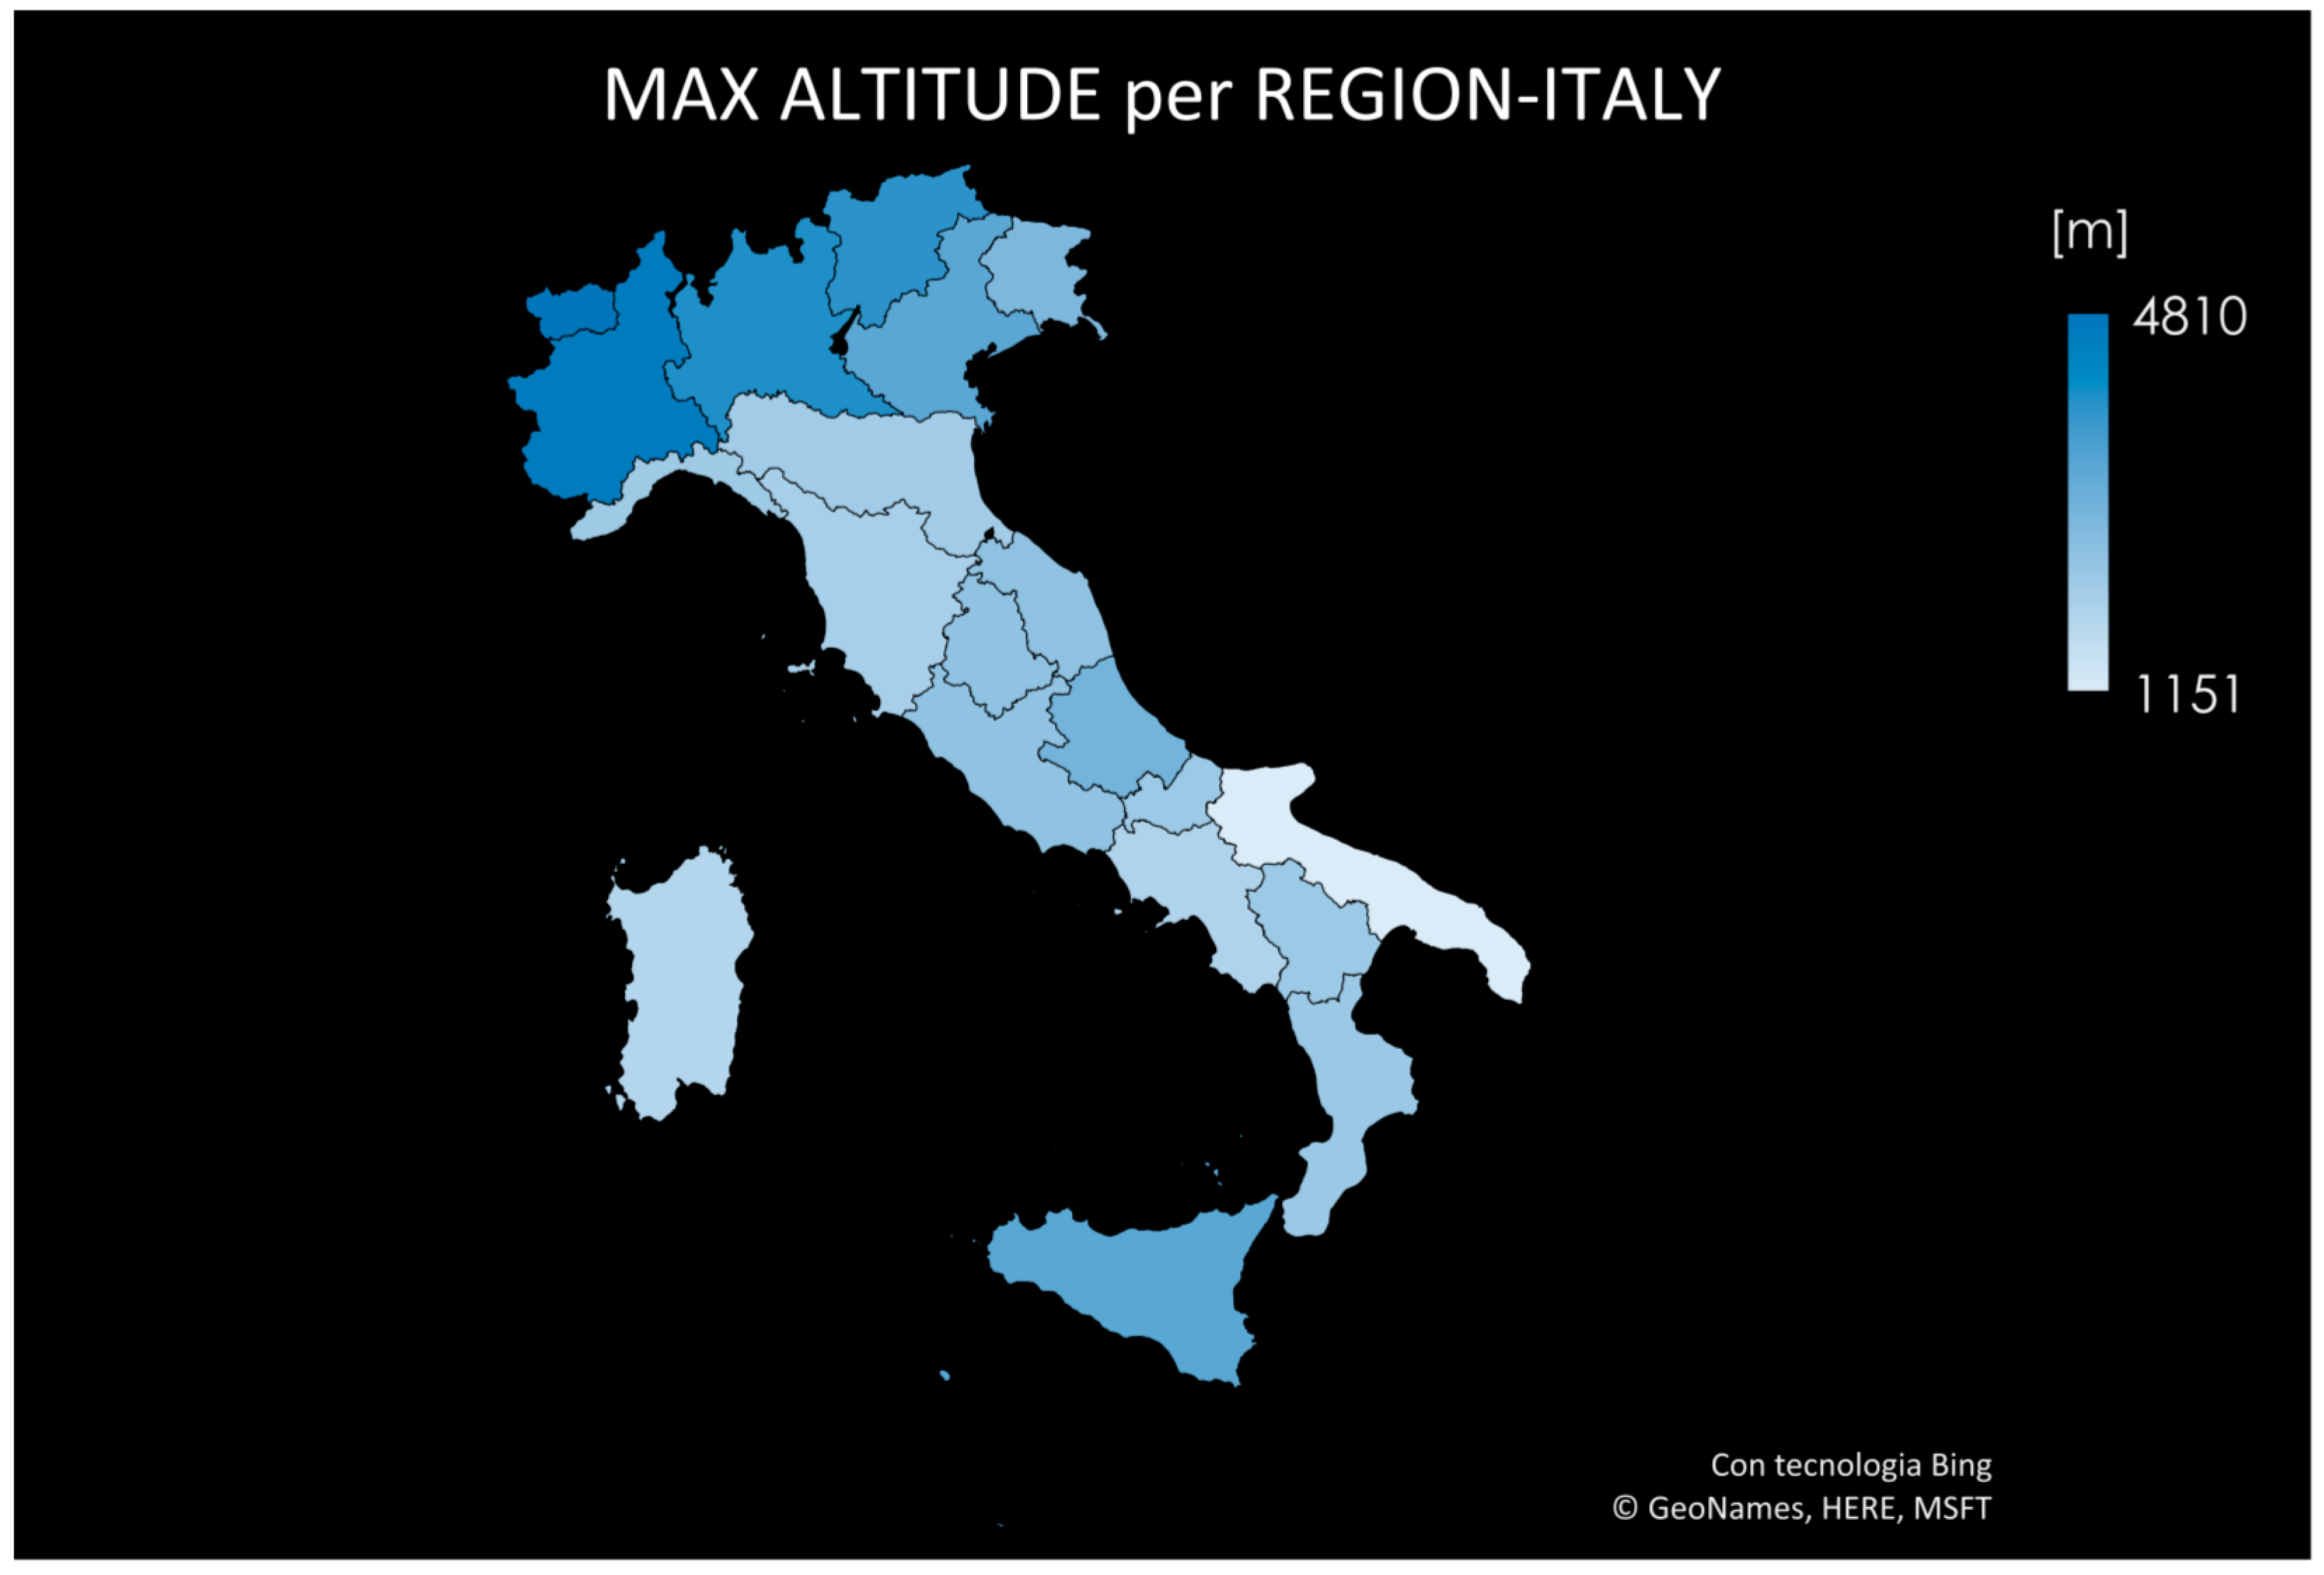
- From an orographic analysis of the Italian territory (Figure 4) [34] the sources’ altitude of the most important Italian rivers (Tevere, Serchio, Po, Arno, Adige, etc.) were derived.
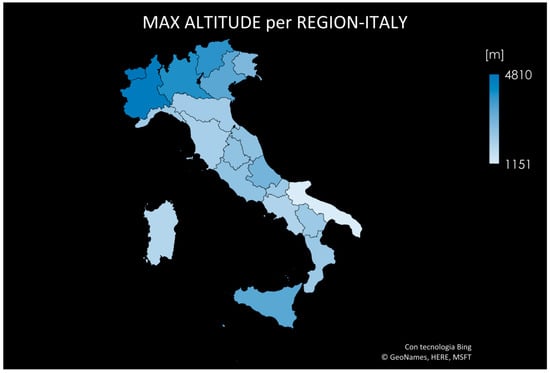 Figure 4. Large-grain orography of the Italian territory.
 - ➢
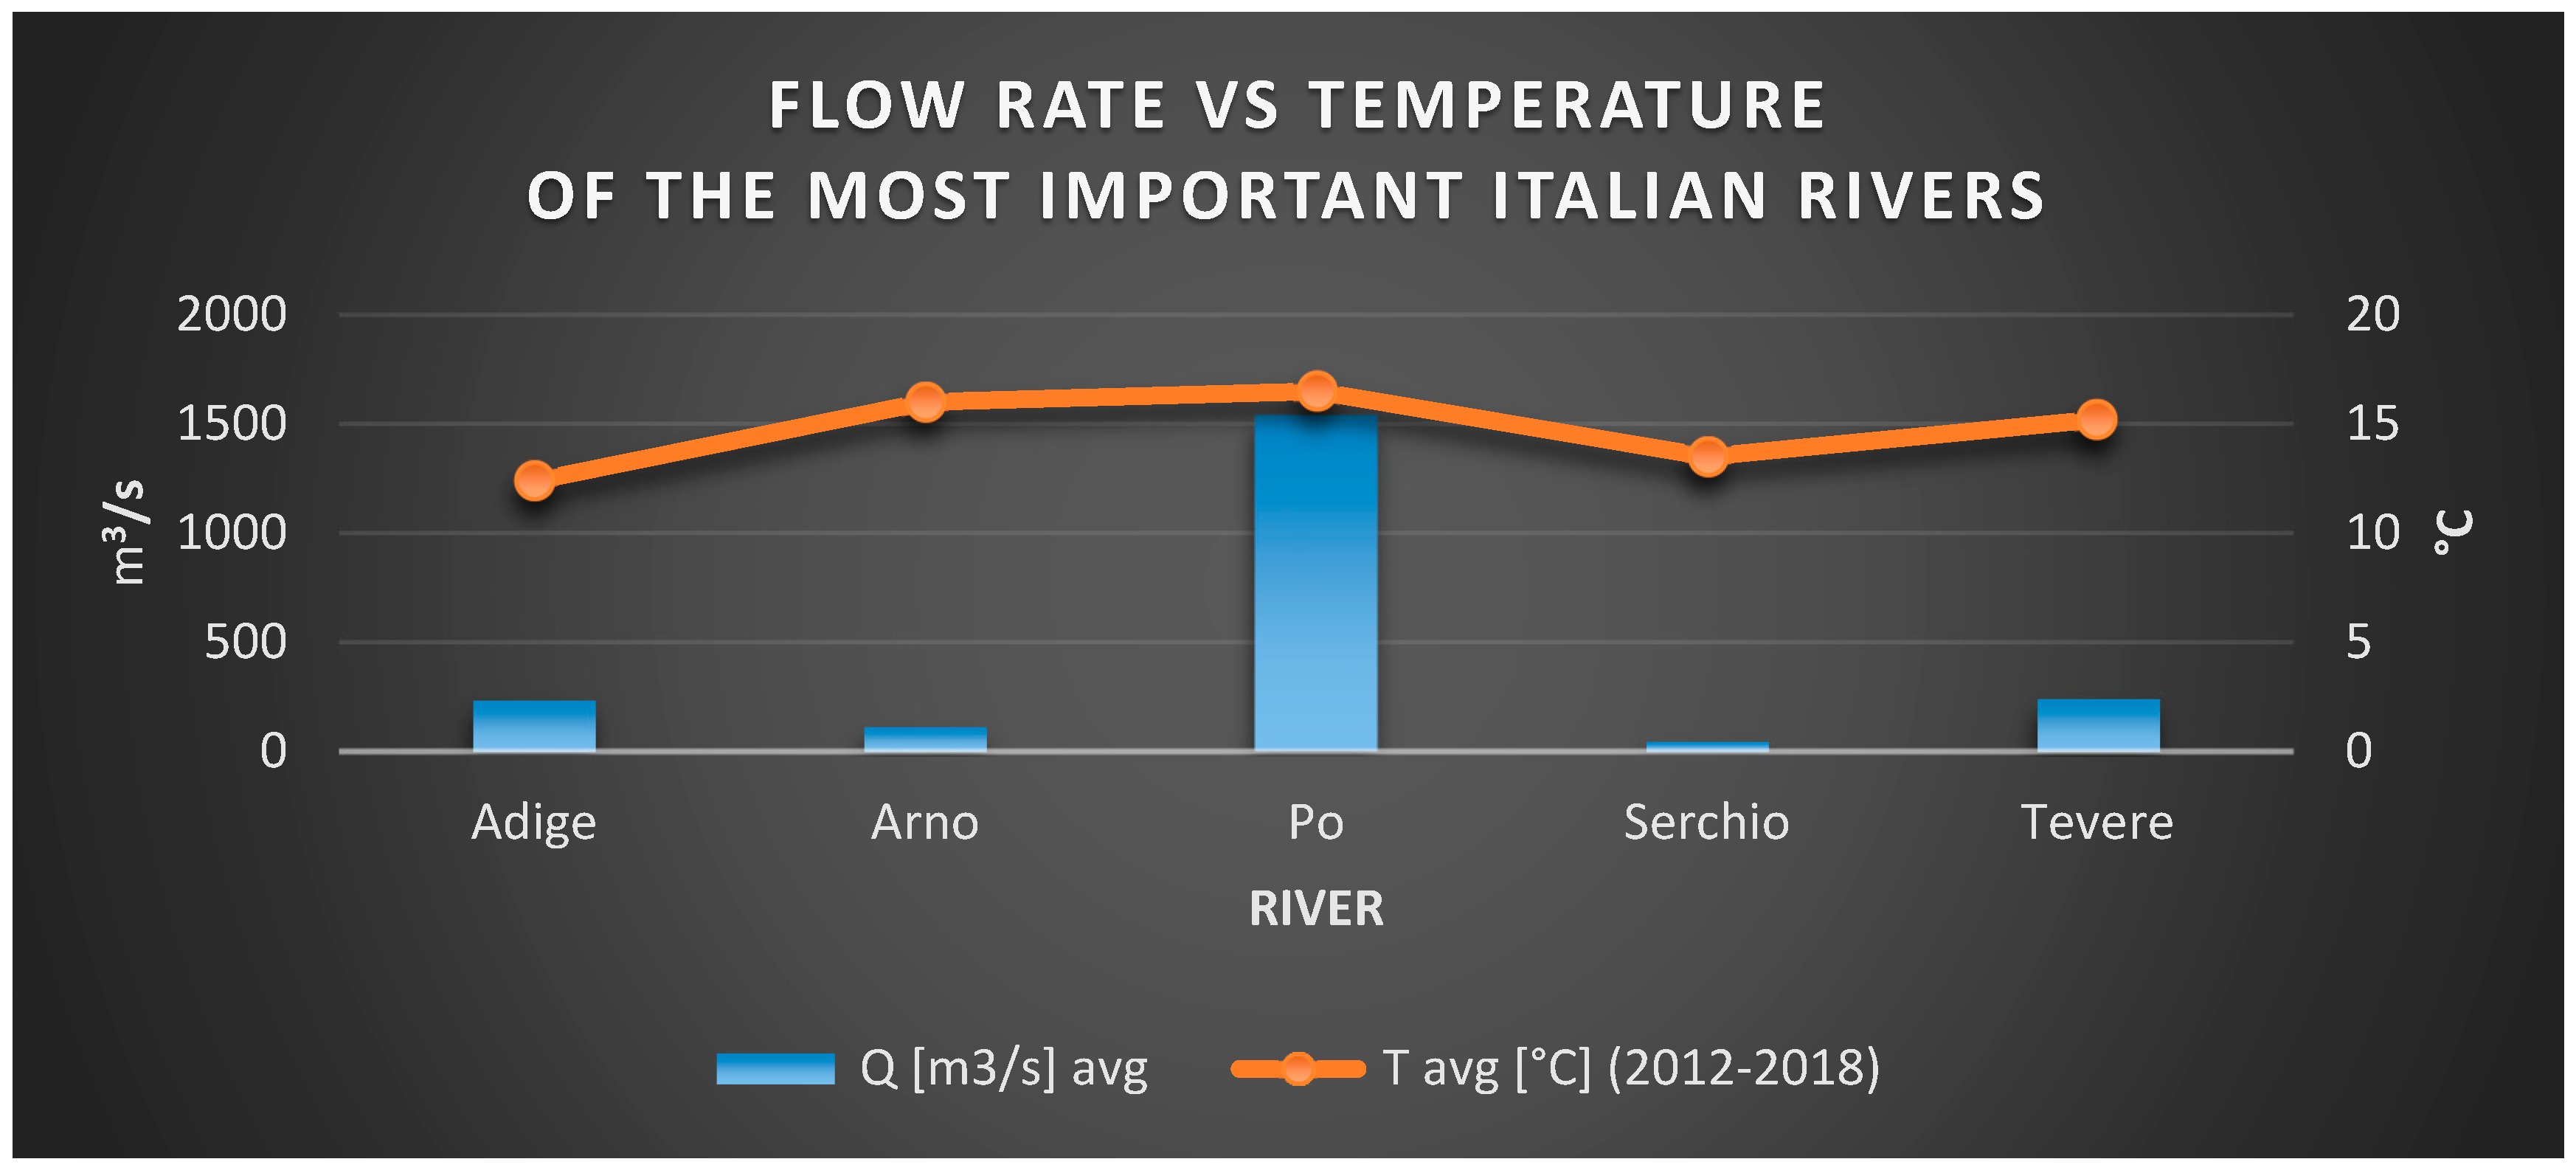
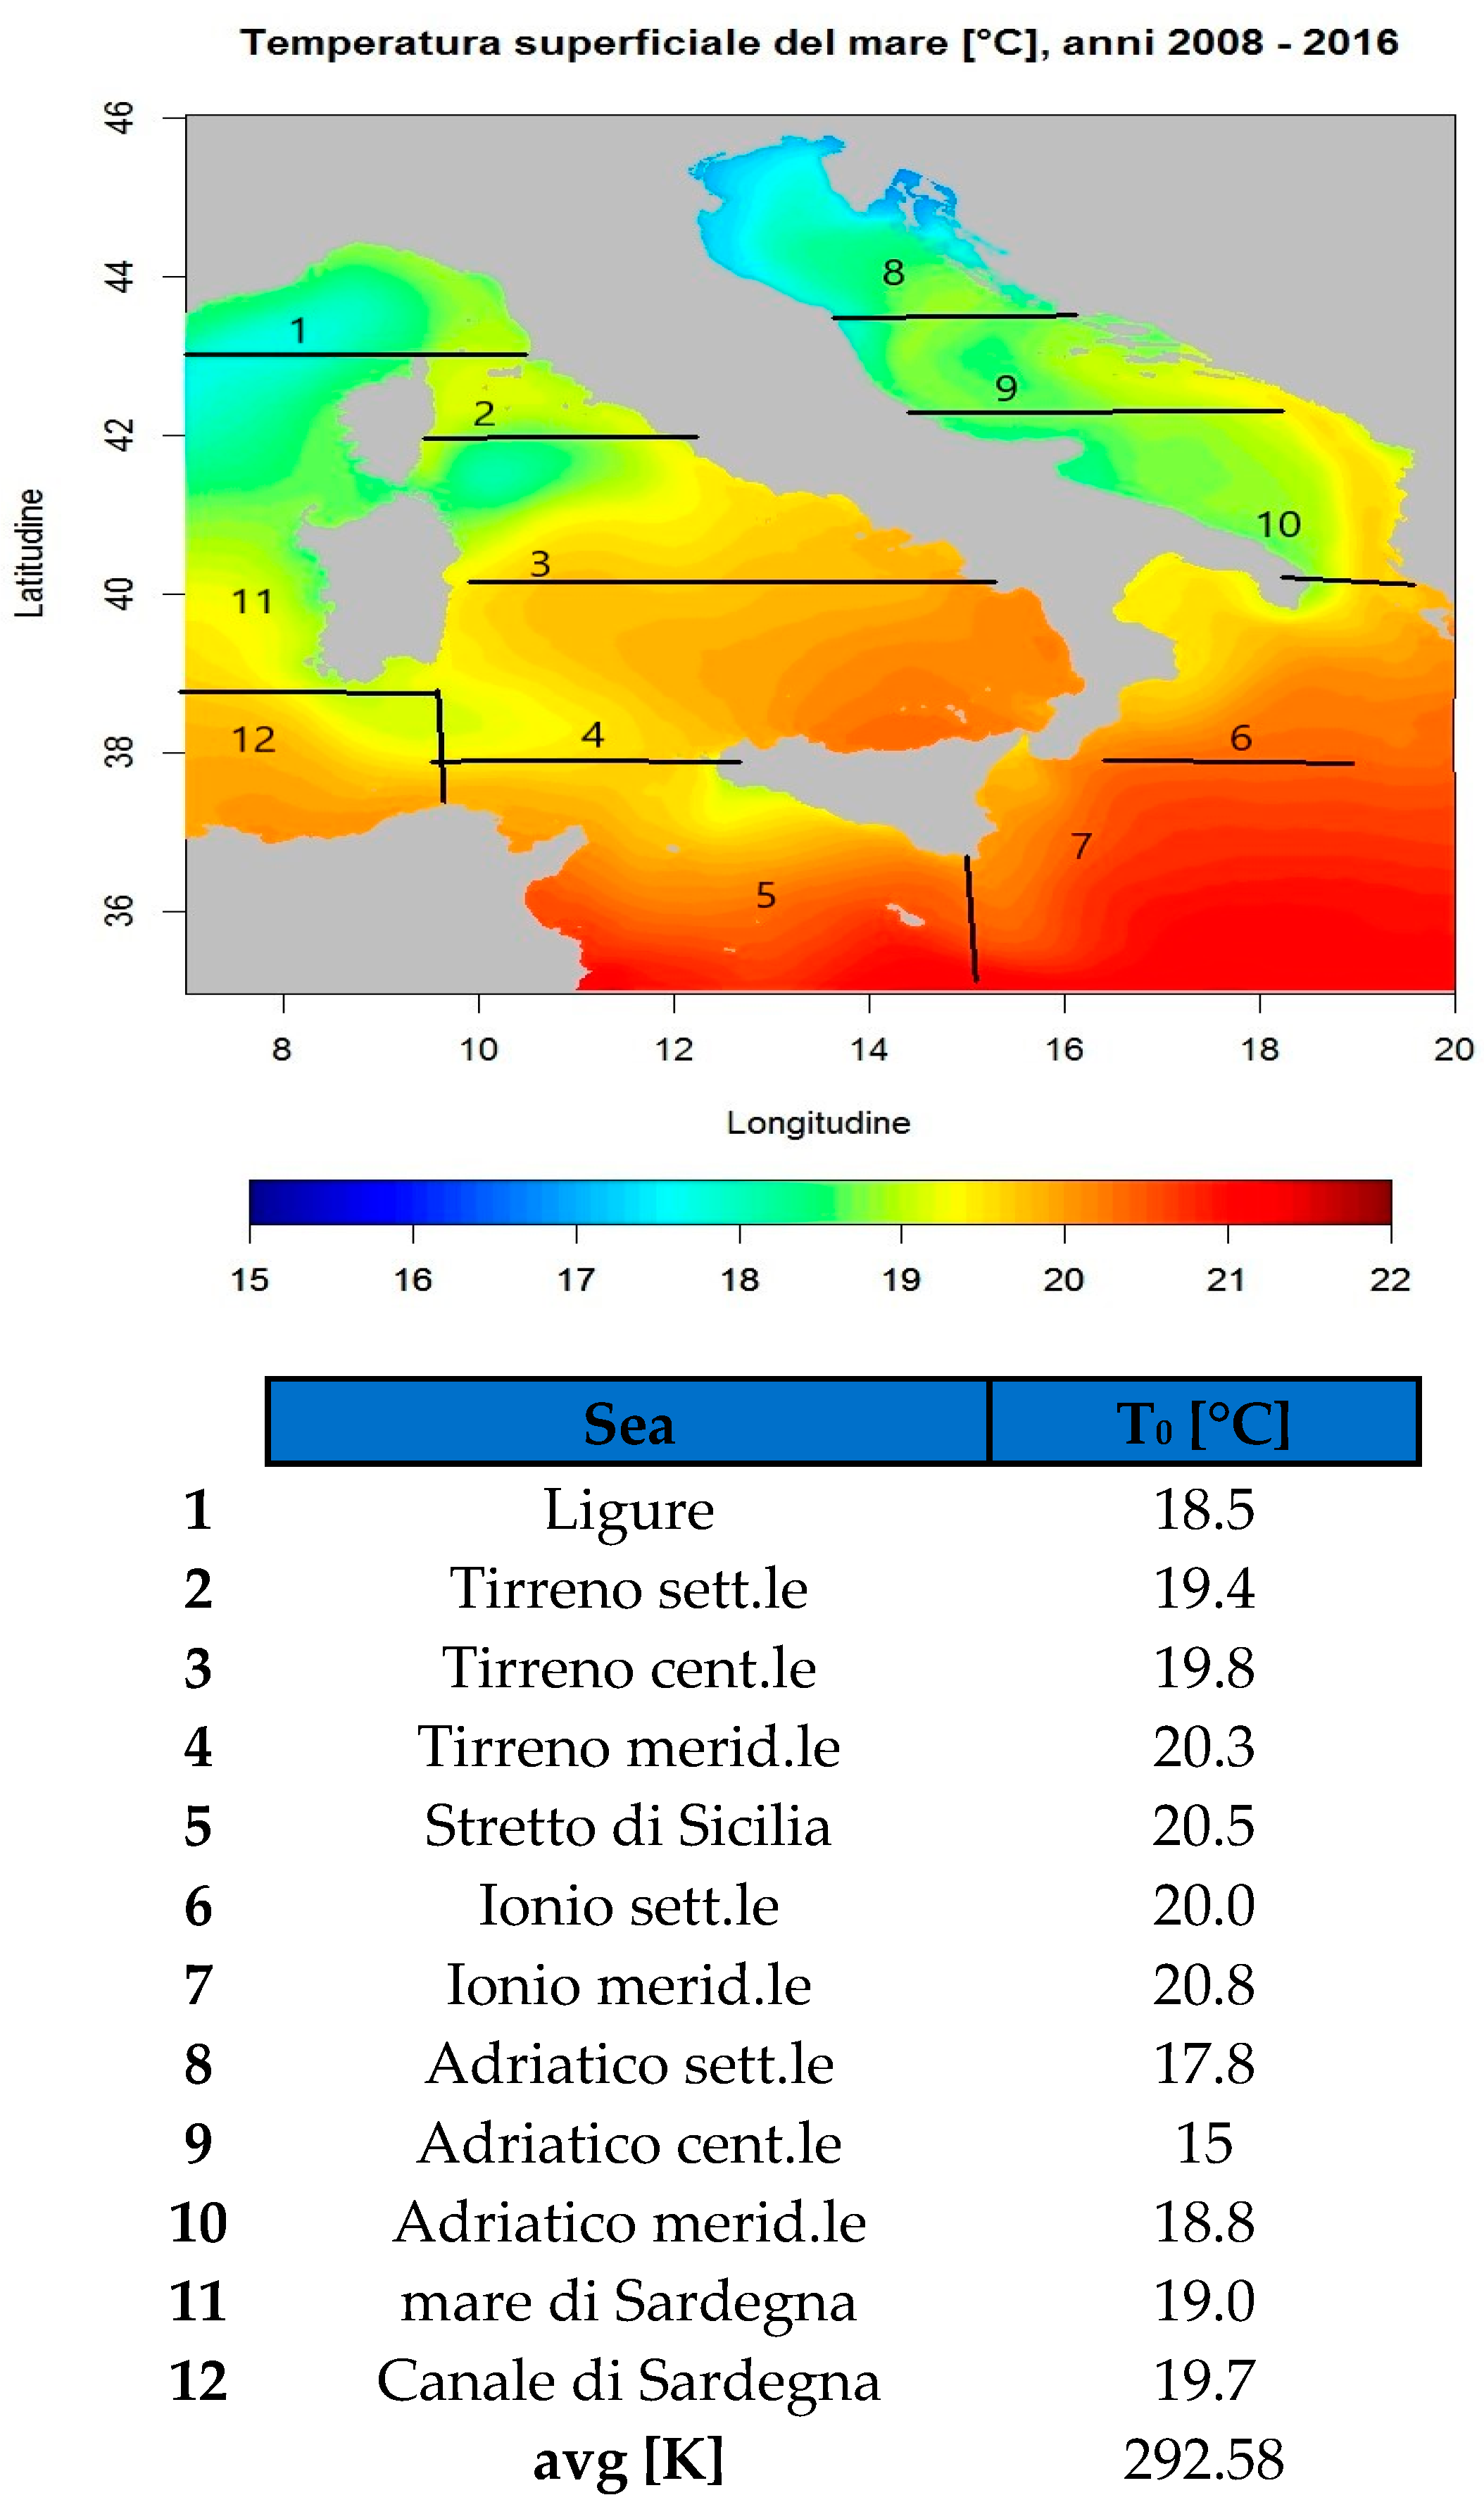
- The flow rates of the rivers and their mean temperature from a database in the period 2012–2018 [35,36,37,38,39] were collected (Figure 5), leading to a calculation of an average mass flow rate of 484 m3/s with a mean temperature of 288.45 K (Figure 6).
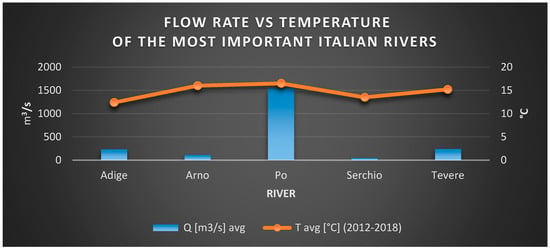 Figure 5. Flow rate of some of the major Italian rivers vs. their mean temperature between 2012 and 2018.
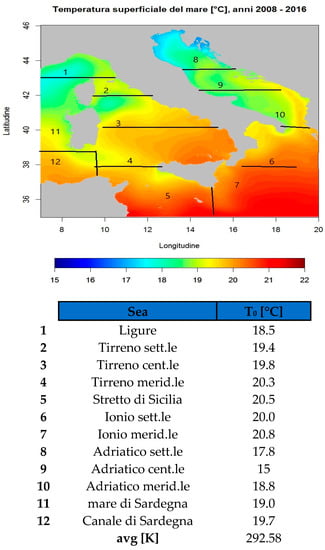 Figure 6. Mean temperature of seas around Italy.
 - ➢
- A mean temperature of the Italian sea was calculated as the average of the temperature of the seas that bathe the Italian coasts.
- ➢
- The equation developed by Valero et al. [34] was then used to compute the hydraulic specific exergy of each river (neglecting the chemical exergy terms):

Table 1.
Values computed according to [34].
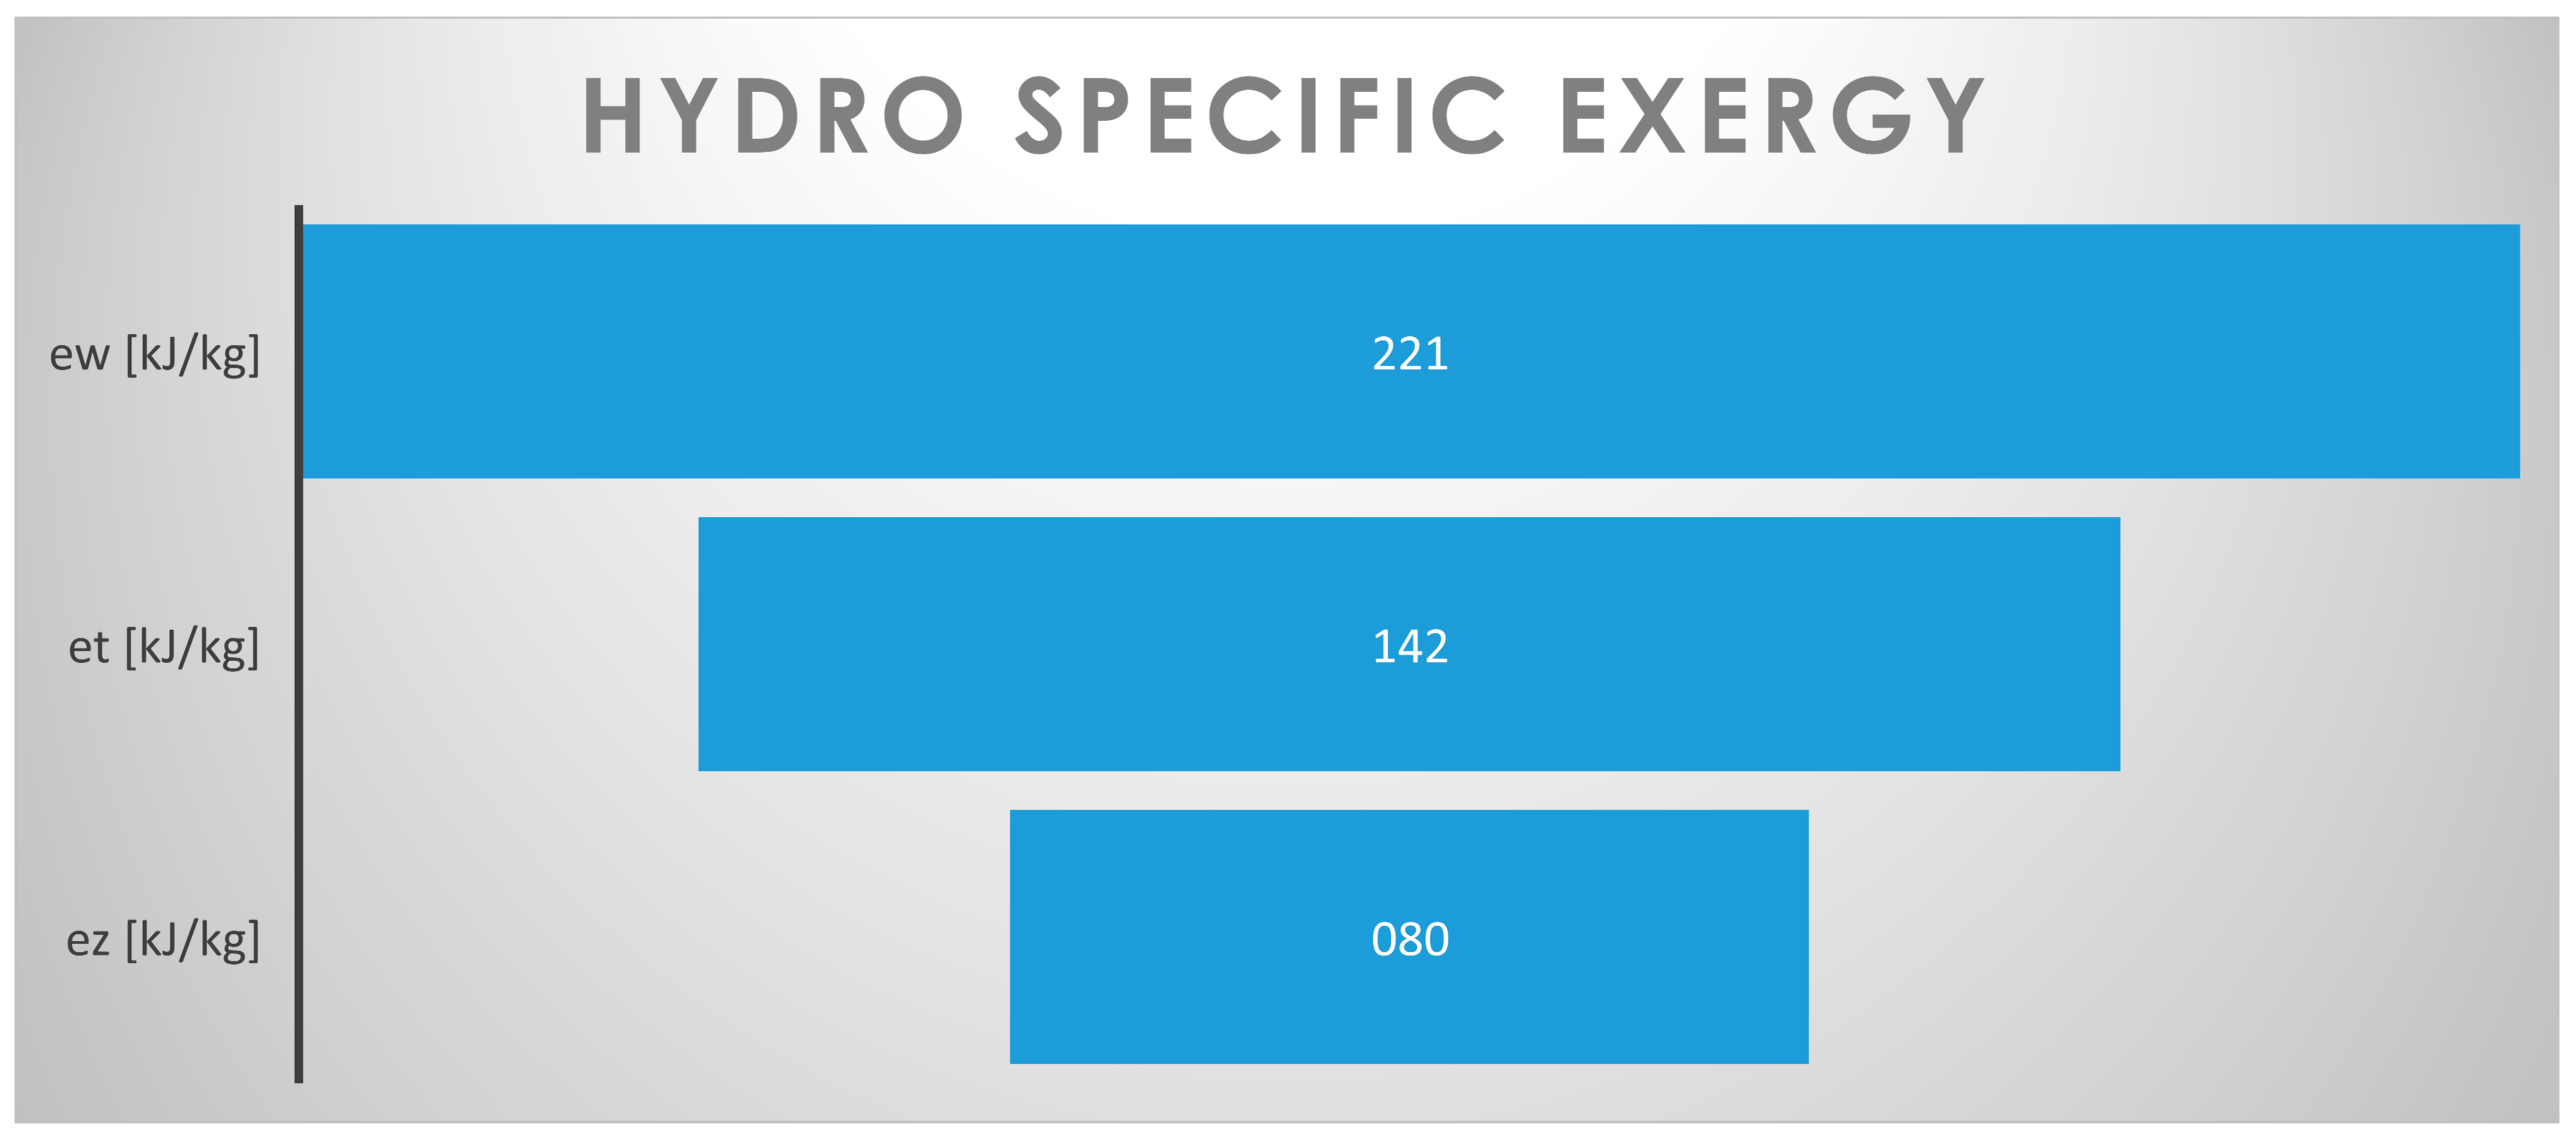
The different contributions to the specific exergy ew are shown in Figure 7.
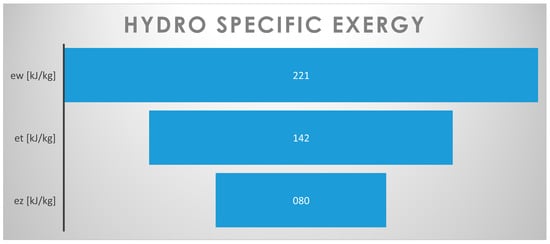
Figure 7.
Hydraulic specific exergy, potential and thermal contributions.
2.2.3. Geothermal Exergy
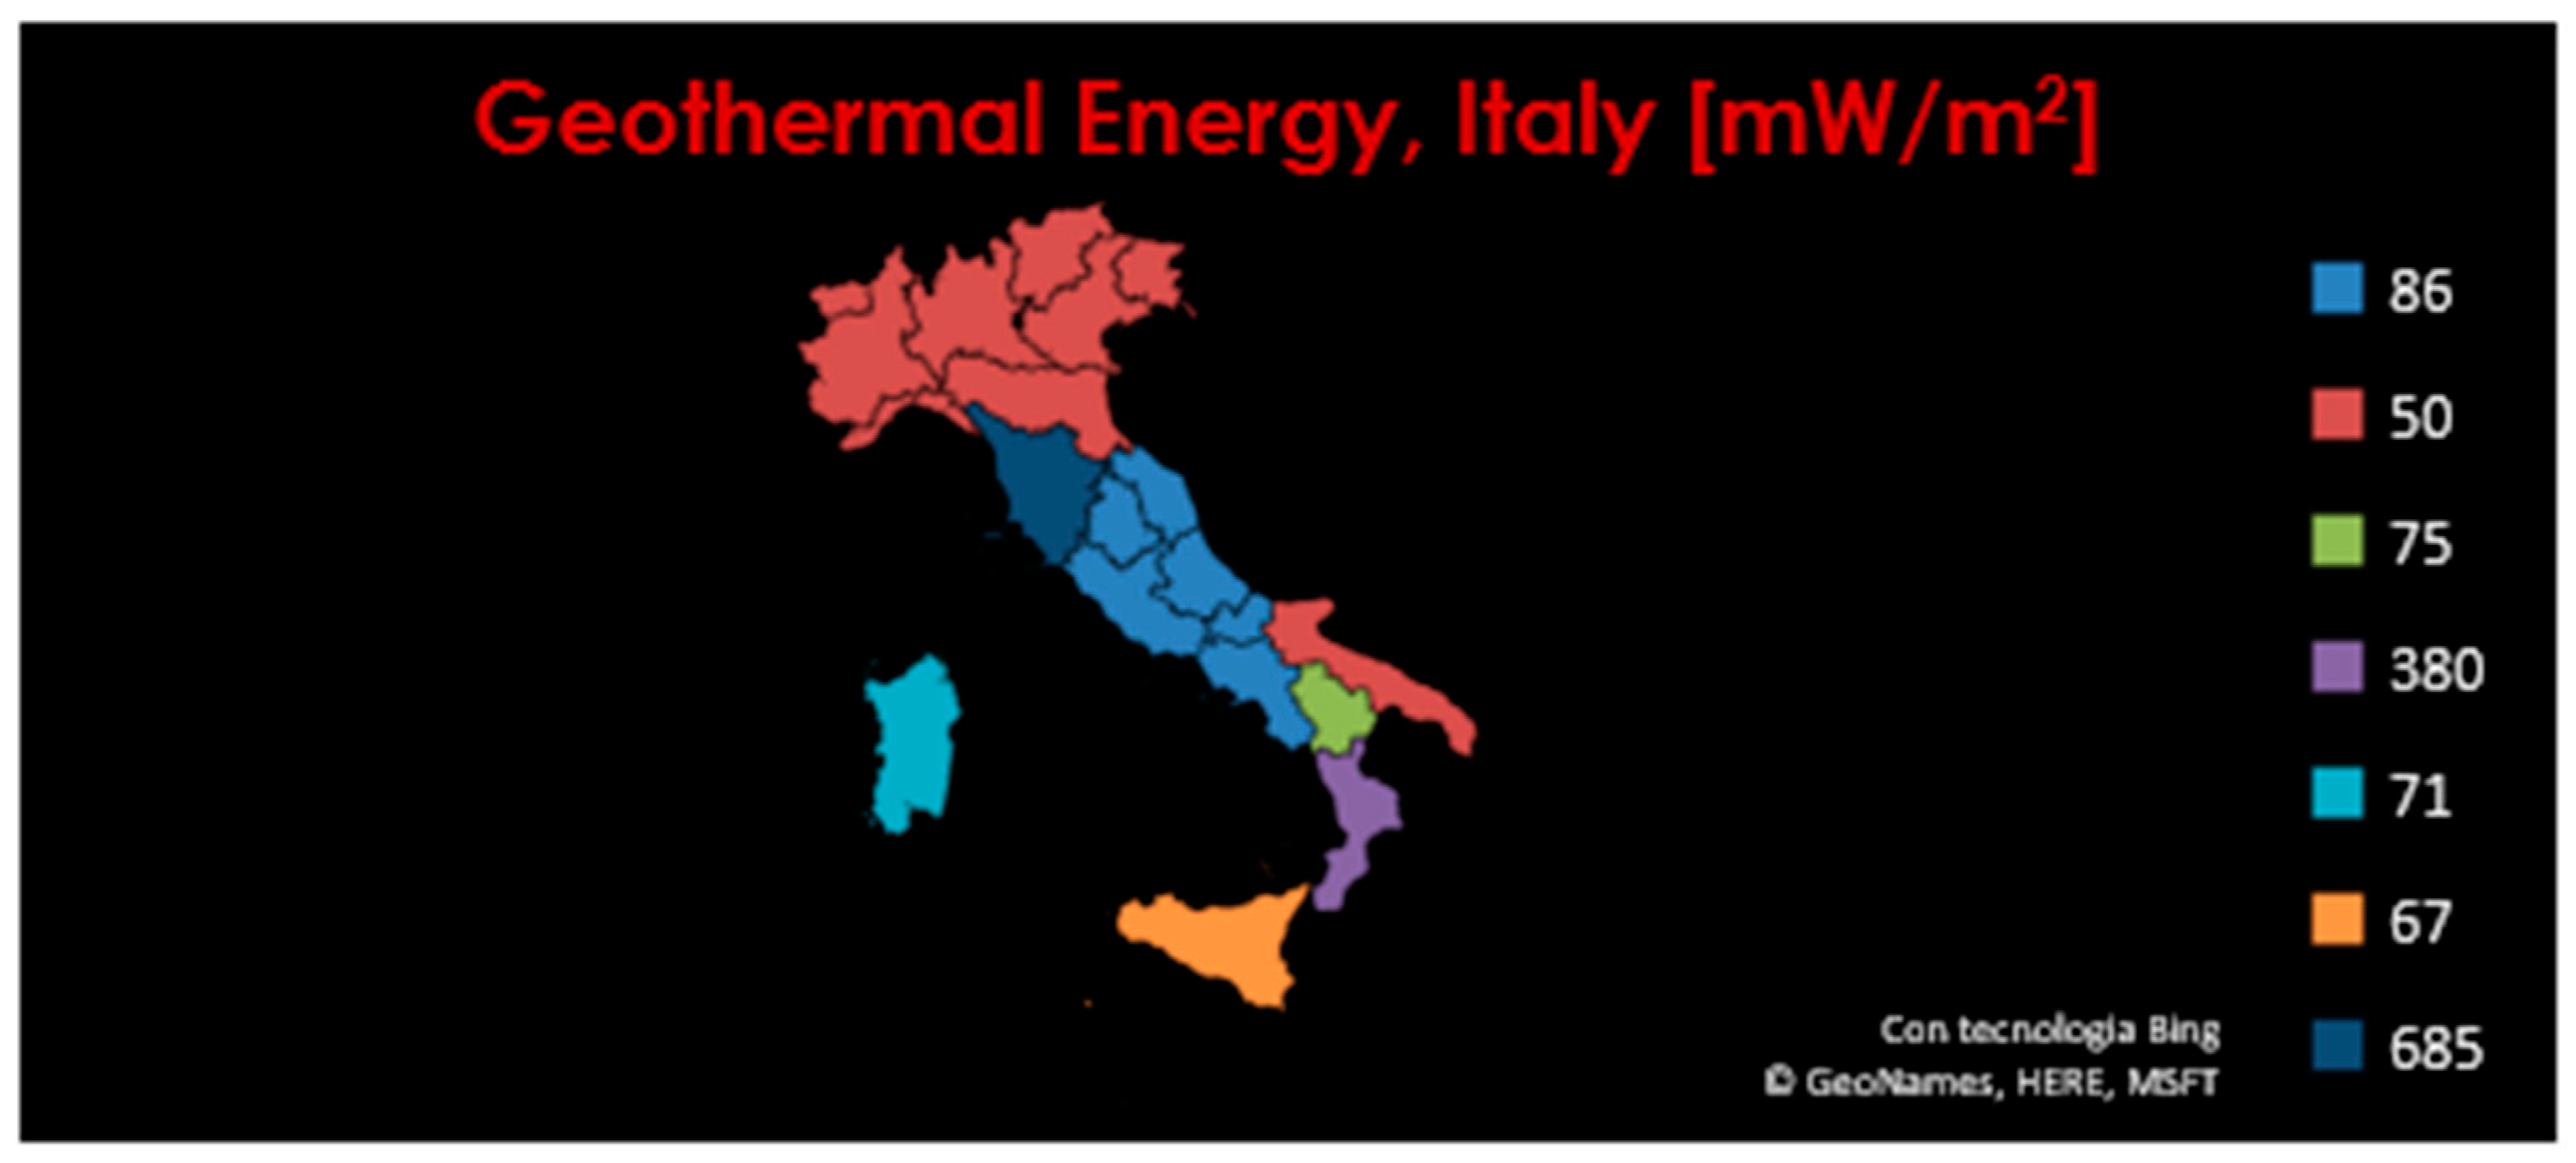
For the computation of geothermal exergy, the procedure was similar to those described above, with the data collected from [41]: the distribution of geothermal power is shown in Figure 8.
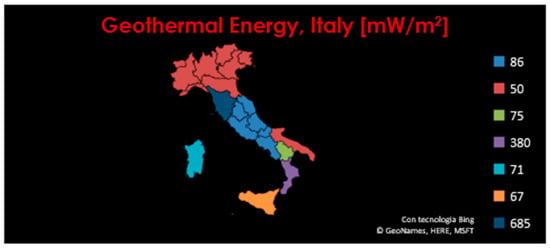
Figure 8.
Distribution of geothermal power within the Italian territory.
Again, the average geothermal energy is computed as a weighted average, the weights being the extensions of each region. The exergy of geothermal energy of Italy is computed multiplying the average value of energy times a Carnot factor of 0.2 considering the typical values of temperature involved in such a process. The value equals 11773.84 TJ.
2.2.4. Other Material and Energy Flows
For the detection of the remaining material and energy flows, similar methods have been adopted, the details being omitted here for brevity. For each sector, several sources have been consulted: National Energy Balance, Material flow balance, clustered data on electricity and heat production as reported by the Italian National Statistics Institute, ISTAT, the European Statistics Institute, EUROSTAT, the national energy provider, TERNA, the national control unit of energy-related services, GSE, the Central Bank of Italy, and many others.
The window of observation spans 5 years, from 2013 to 2017 ([4,42,43,44,45,46,47,48,49,50,51,52]).
2.3. Computation of the Econometric Factors and Specific Exergy of Labor and Capital
The econometric factors α and β were computed as follows:
- ➢
- The α factor represents the portion of the input exergy necessary to the survival of the population. It is thus computed as the ratio between the exergy input of the domestic sector and the country total exergy input. Once is known, the specific Extended Exergy of labor is computed as where Nwh is the number of work hours per year.
- ➢
- The second econometric factor, β is computed on the basis of economic data: the economic “Money and Quasi-Money” aggregate M2 and the average salary; β is the ratio between M2 and the total average salary of a given year. In this definition, β is merely a sort of amplification factor that produces wealth only from financial activities: the higher, the more the society is service-based. EEA introduces a correction to this definition, to take into account the so-called financial capital (the amount in excess of the global salaries in the country): the Extended Exergy embodied in one monetary unit is for a given year and is computed as .
3. Results and Discussion
Once the data were collected, organized, validated and reconciliated, the Extended Exergy Analysis of the Italian system for the period 2013–2017 was performed. The aim is to compute the amount of exergy destruction of the Italian system for each year, in order to gain some insight about its correlation with the GDP, commonly adopted for the evaluation of the wealth of a country. During their operation, each one of the seven sectors destroys exergy and so the exergy budget for each sector will be:
The results of analysis are the following (Table 2.)

Table 2.
Results of the EEA (Extended Exergy Analysis) for Italy, 2013–2017.
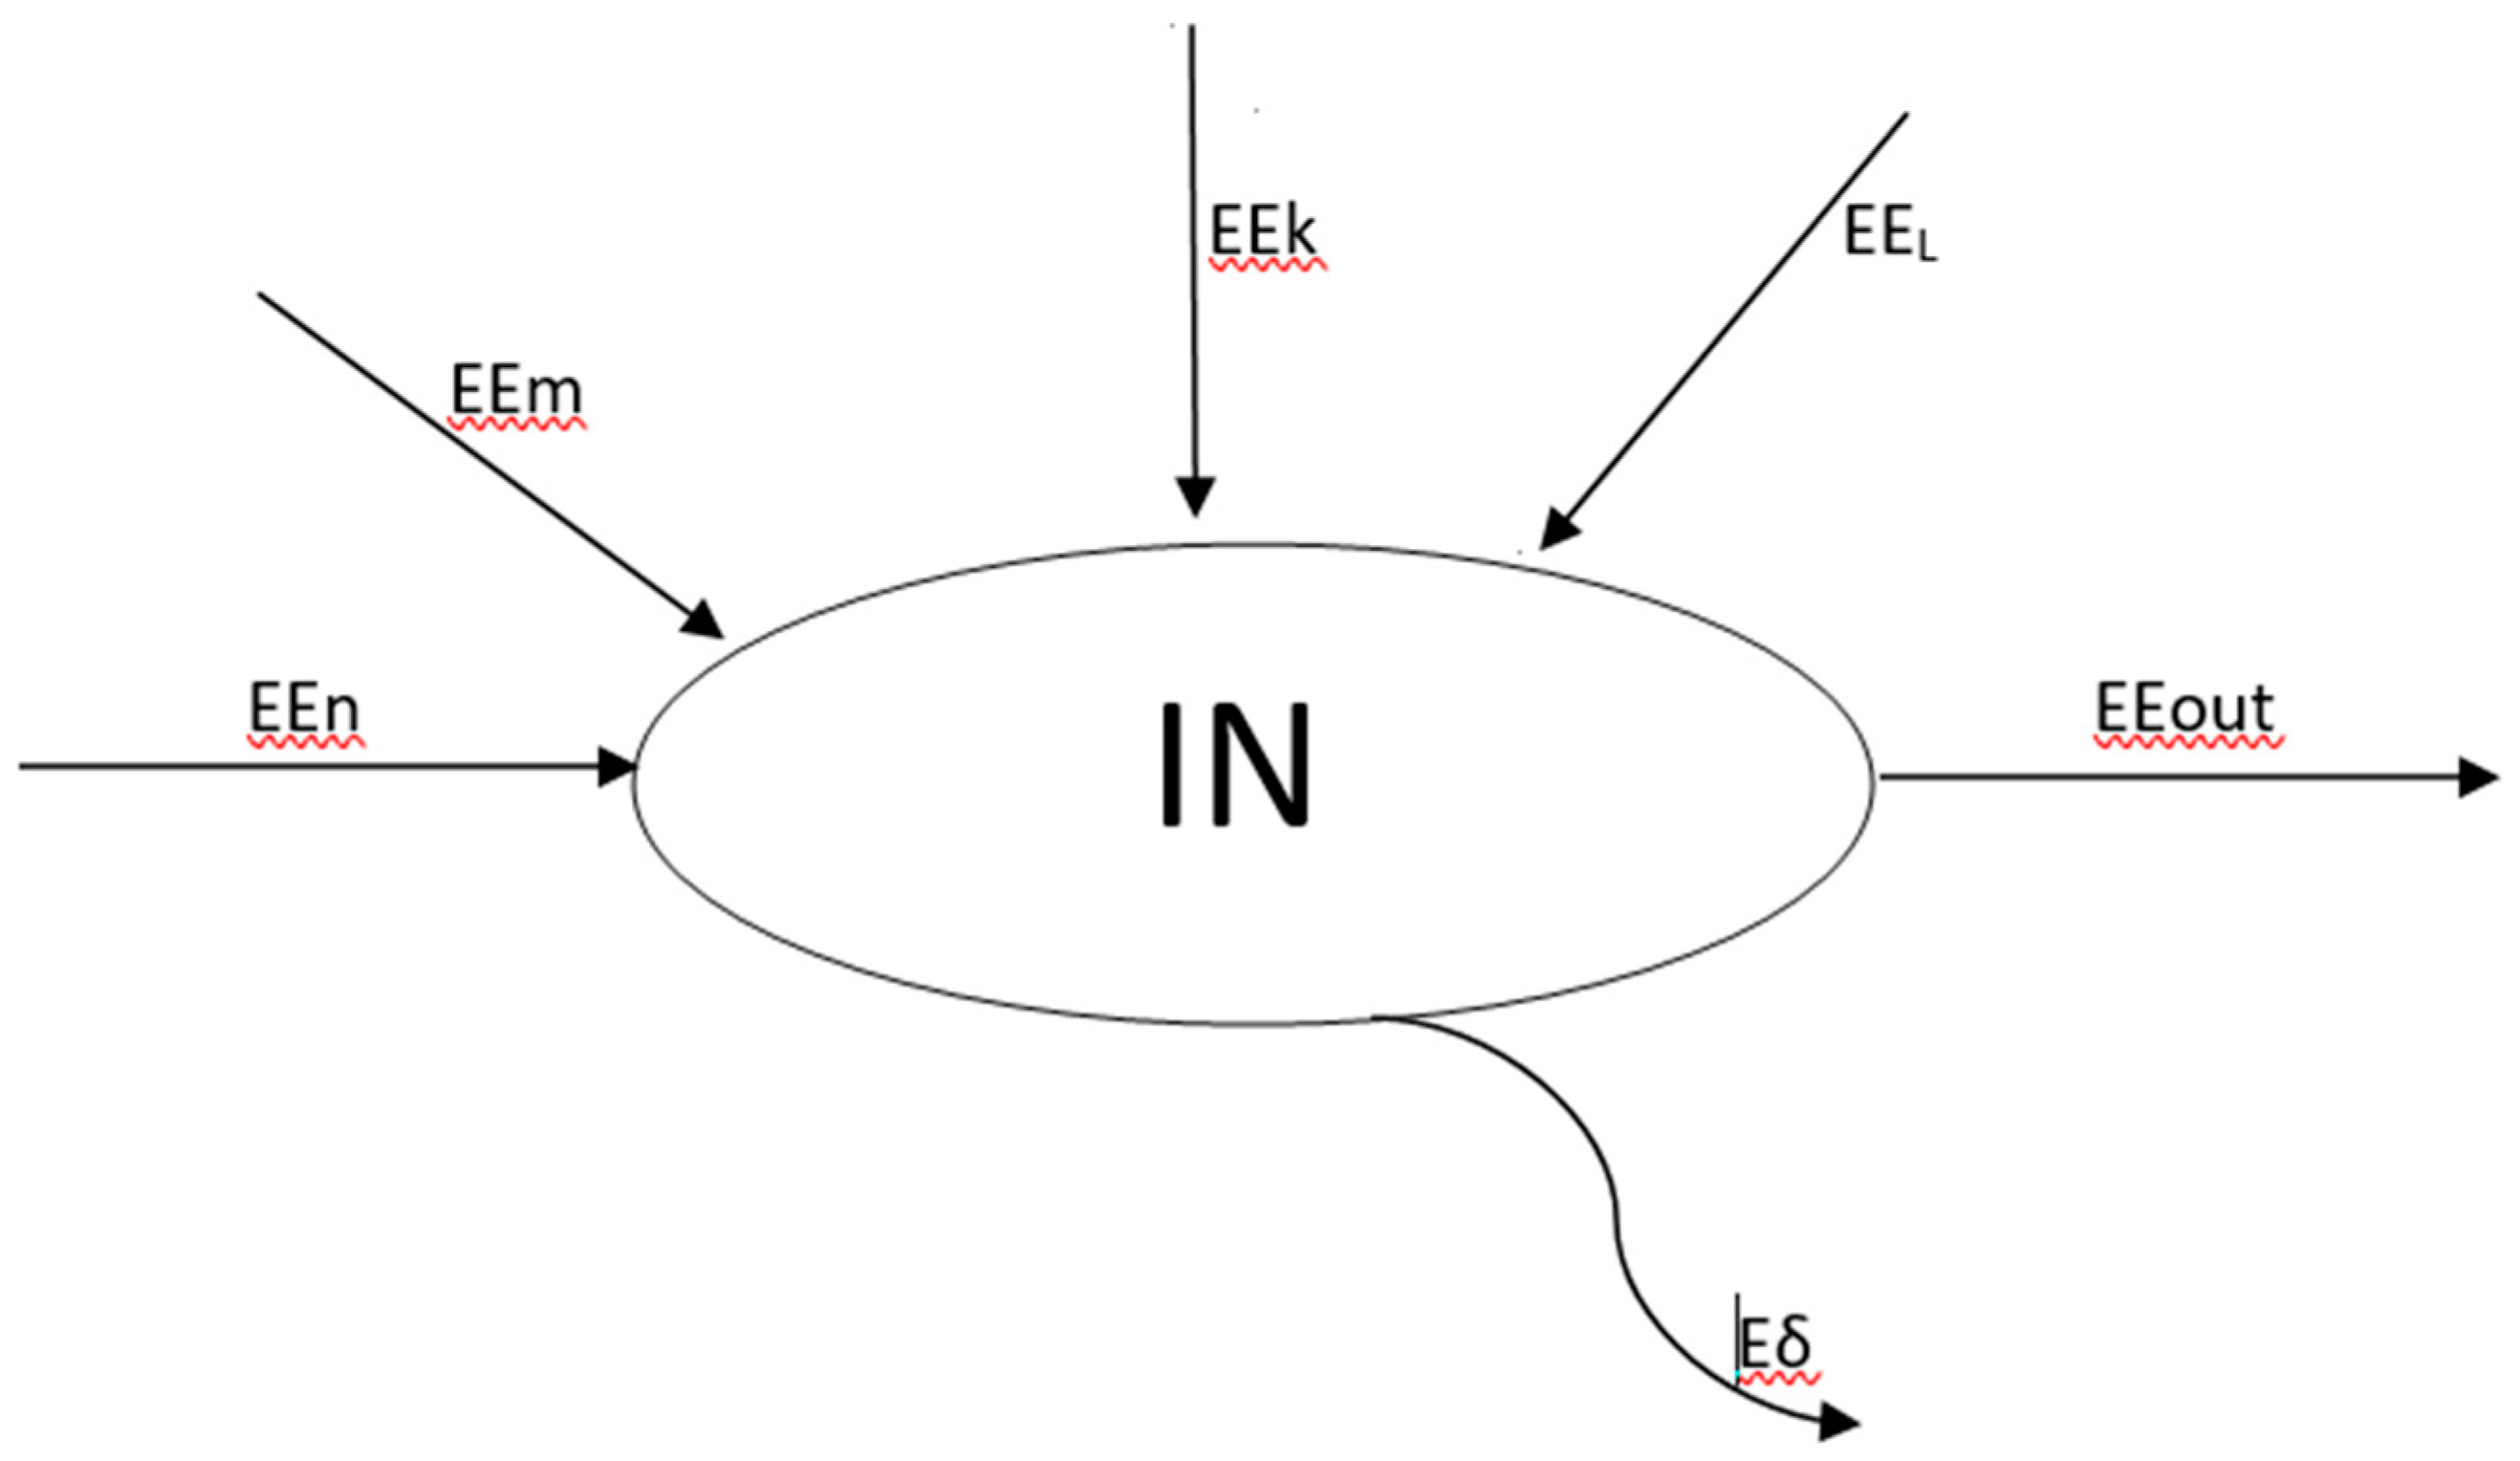
The rationale behind the computation is the following, considering the connections between the sectors as pointed out in Section 2.1. For the sake of clarity, let us examine in detail (albeit always at a schematic level, to avoid considering too many fluxes) the Industrial Sector IN (Figure 9). The sector is modeled as a black box: any exergy influx represents a physical flow of either energy or matter and has a label expressing the units of specific Extended Exergy ee (J) and its intensity m or P (kg/s or kW), so that its total contribution to the IN exergy budget is calculated as EEn = een*P or EEm = eem*m. The same is true for immaterial inflows, like capital flows (EEK = eeK*K) and labor (EEL = eeL*work hours). Since all outputs are also known, the exergy destruction is given (Equation (6) above) by the difference between the total input and the total output. The same applies to the remaining sectors: obviously, since the α and β coefficients depend on Ein and Econsumed, Do, and the labor and capital flows depend on the econometric coefficients, some iteration is necessary to reach convergence.
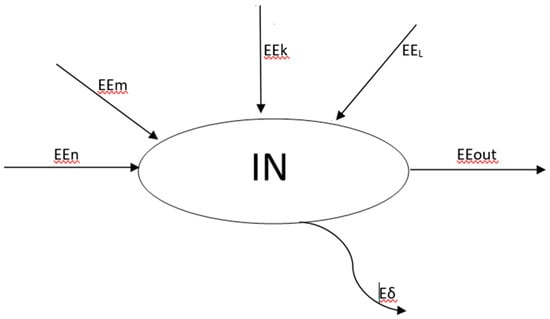
Figure 9.
Black box model applied within the context of an Extended Exergy Analysis: the example of an application to the Industrial Sector.
In more detail, we may consider that the energy content of a “stream”, be it material or immaterial, has six “production factors”: its initial CExC (material or immaterial), its labor content EEL, its capital content EEK, its “added material” content EEM, its “added energy” content EEEn and its equivalent environmental remediation exergy EEENV. This latter term is, in practical terms, difficult to calculate because it requires knowledge of the biodegradation process adopted. It will not be discussed here; interested readers are referred to [7]. It is therefore clear that the accuracy of an EE analysis is very strongly dependent on the quality (completeness, congruency) and detail (disaggregation) of the data.
In spite of the preliminary type of analysis performed here (it is not yet possible to derive from the data and/or results the values of the most popular environmental indicators; more work is needed in this respect) some interesting conclusions may be drawn from the global results:
- (a)
- The first econometric coefficient is fairly constant over the time window of observation: it is equal to 4 × 10⁻⁴ and indicates that in spite of its high living standards, Italy is an “exergy sparing” country (values of α for different countries for year 2005 as reported in [31]);
- (b)
- The second econometric coefficient also is fairly constant between 2013 and 2017: its values oscillate around 5.2. This indicates that Italy is a country dominated by financial capital (Kf/S = β − 1);
- (c)
- The Extended Exergy of labor is a measure of how many Joules is 1 work hour equivalent to: a higher eeL pertains to more energy-intensive societies. The value for Italy did not change much from 2013 to 2017, being around 70 MJ/hour; the Extended Exergy of capital is a measure of how many monetary units it takes to make up for one work hour. A higher eeK pertains to more affluent societies. The value for Italy did not change much from 2013 to 2017, being around 65 MJ/€;
- (d)
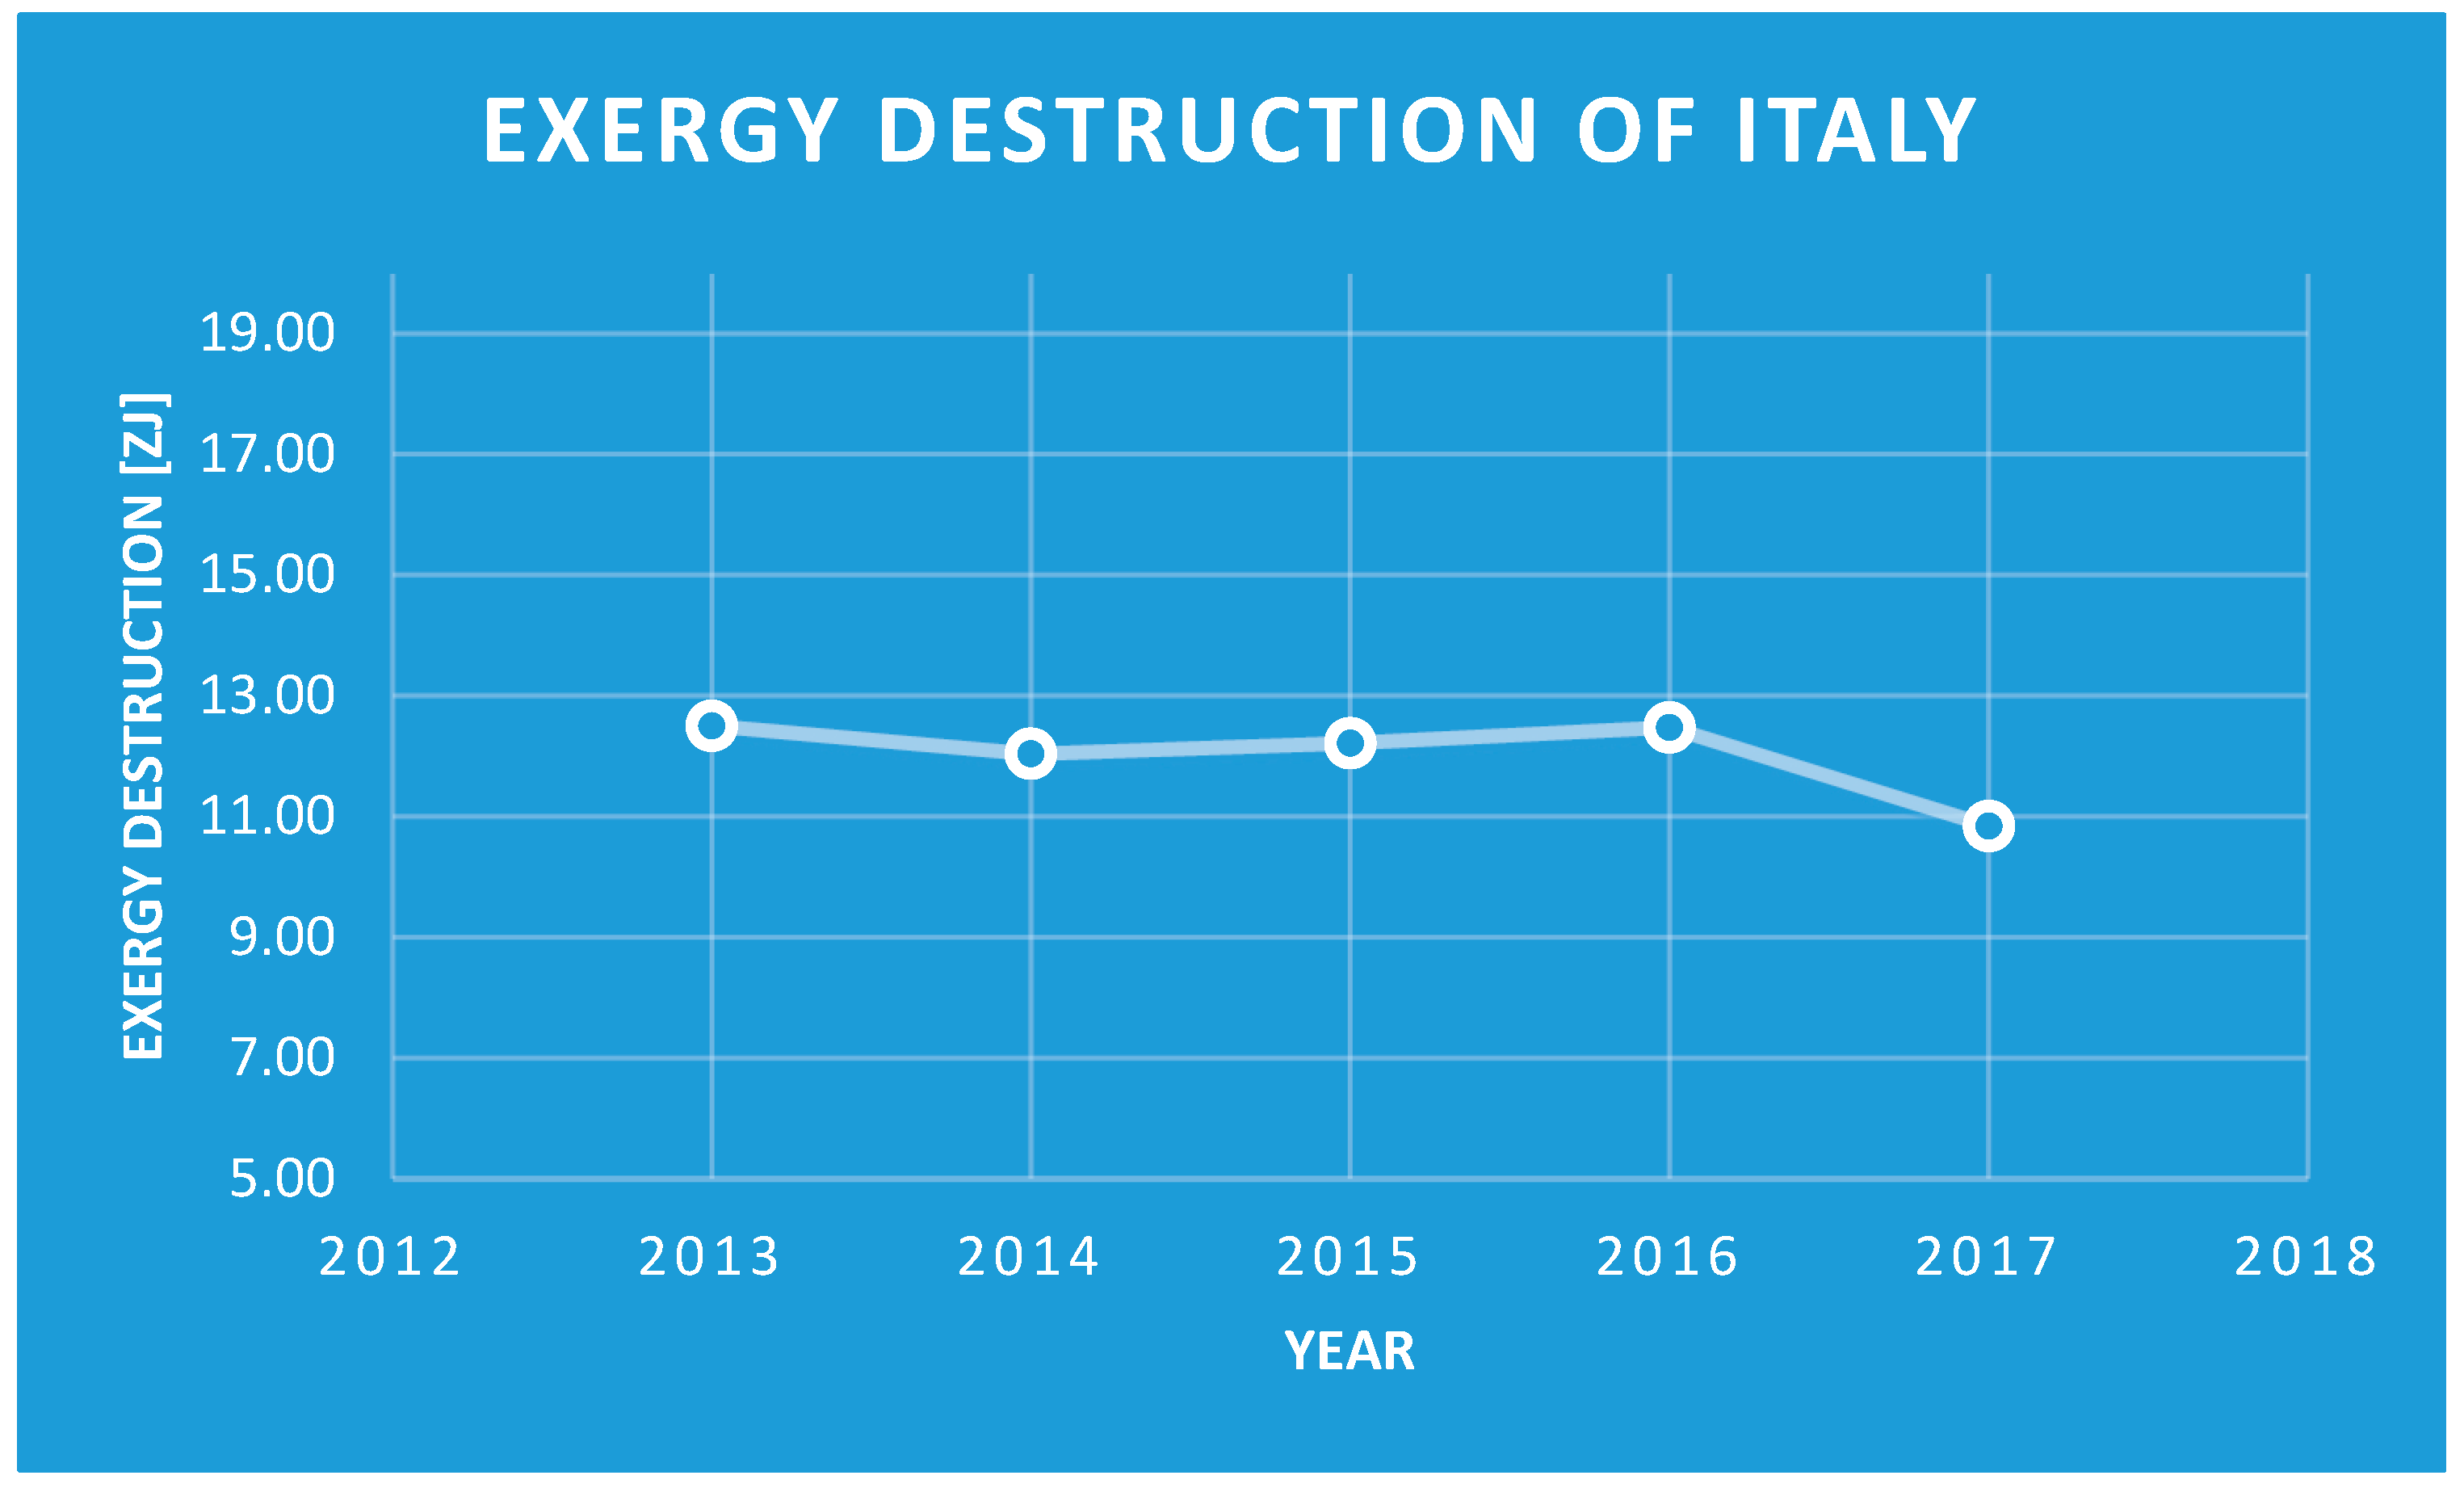
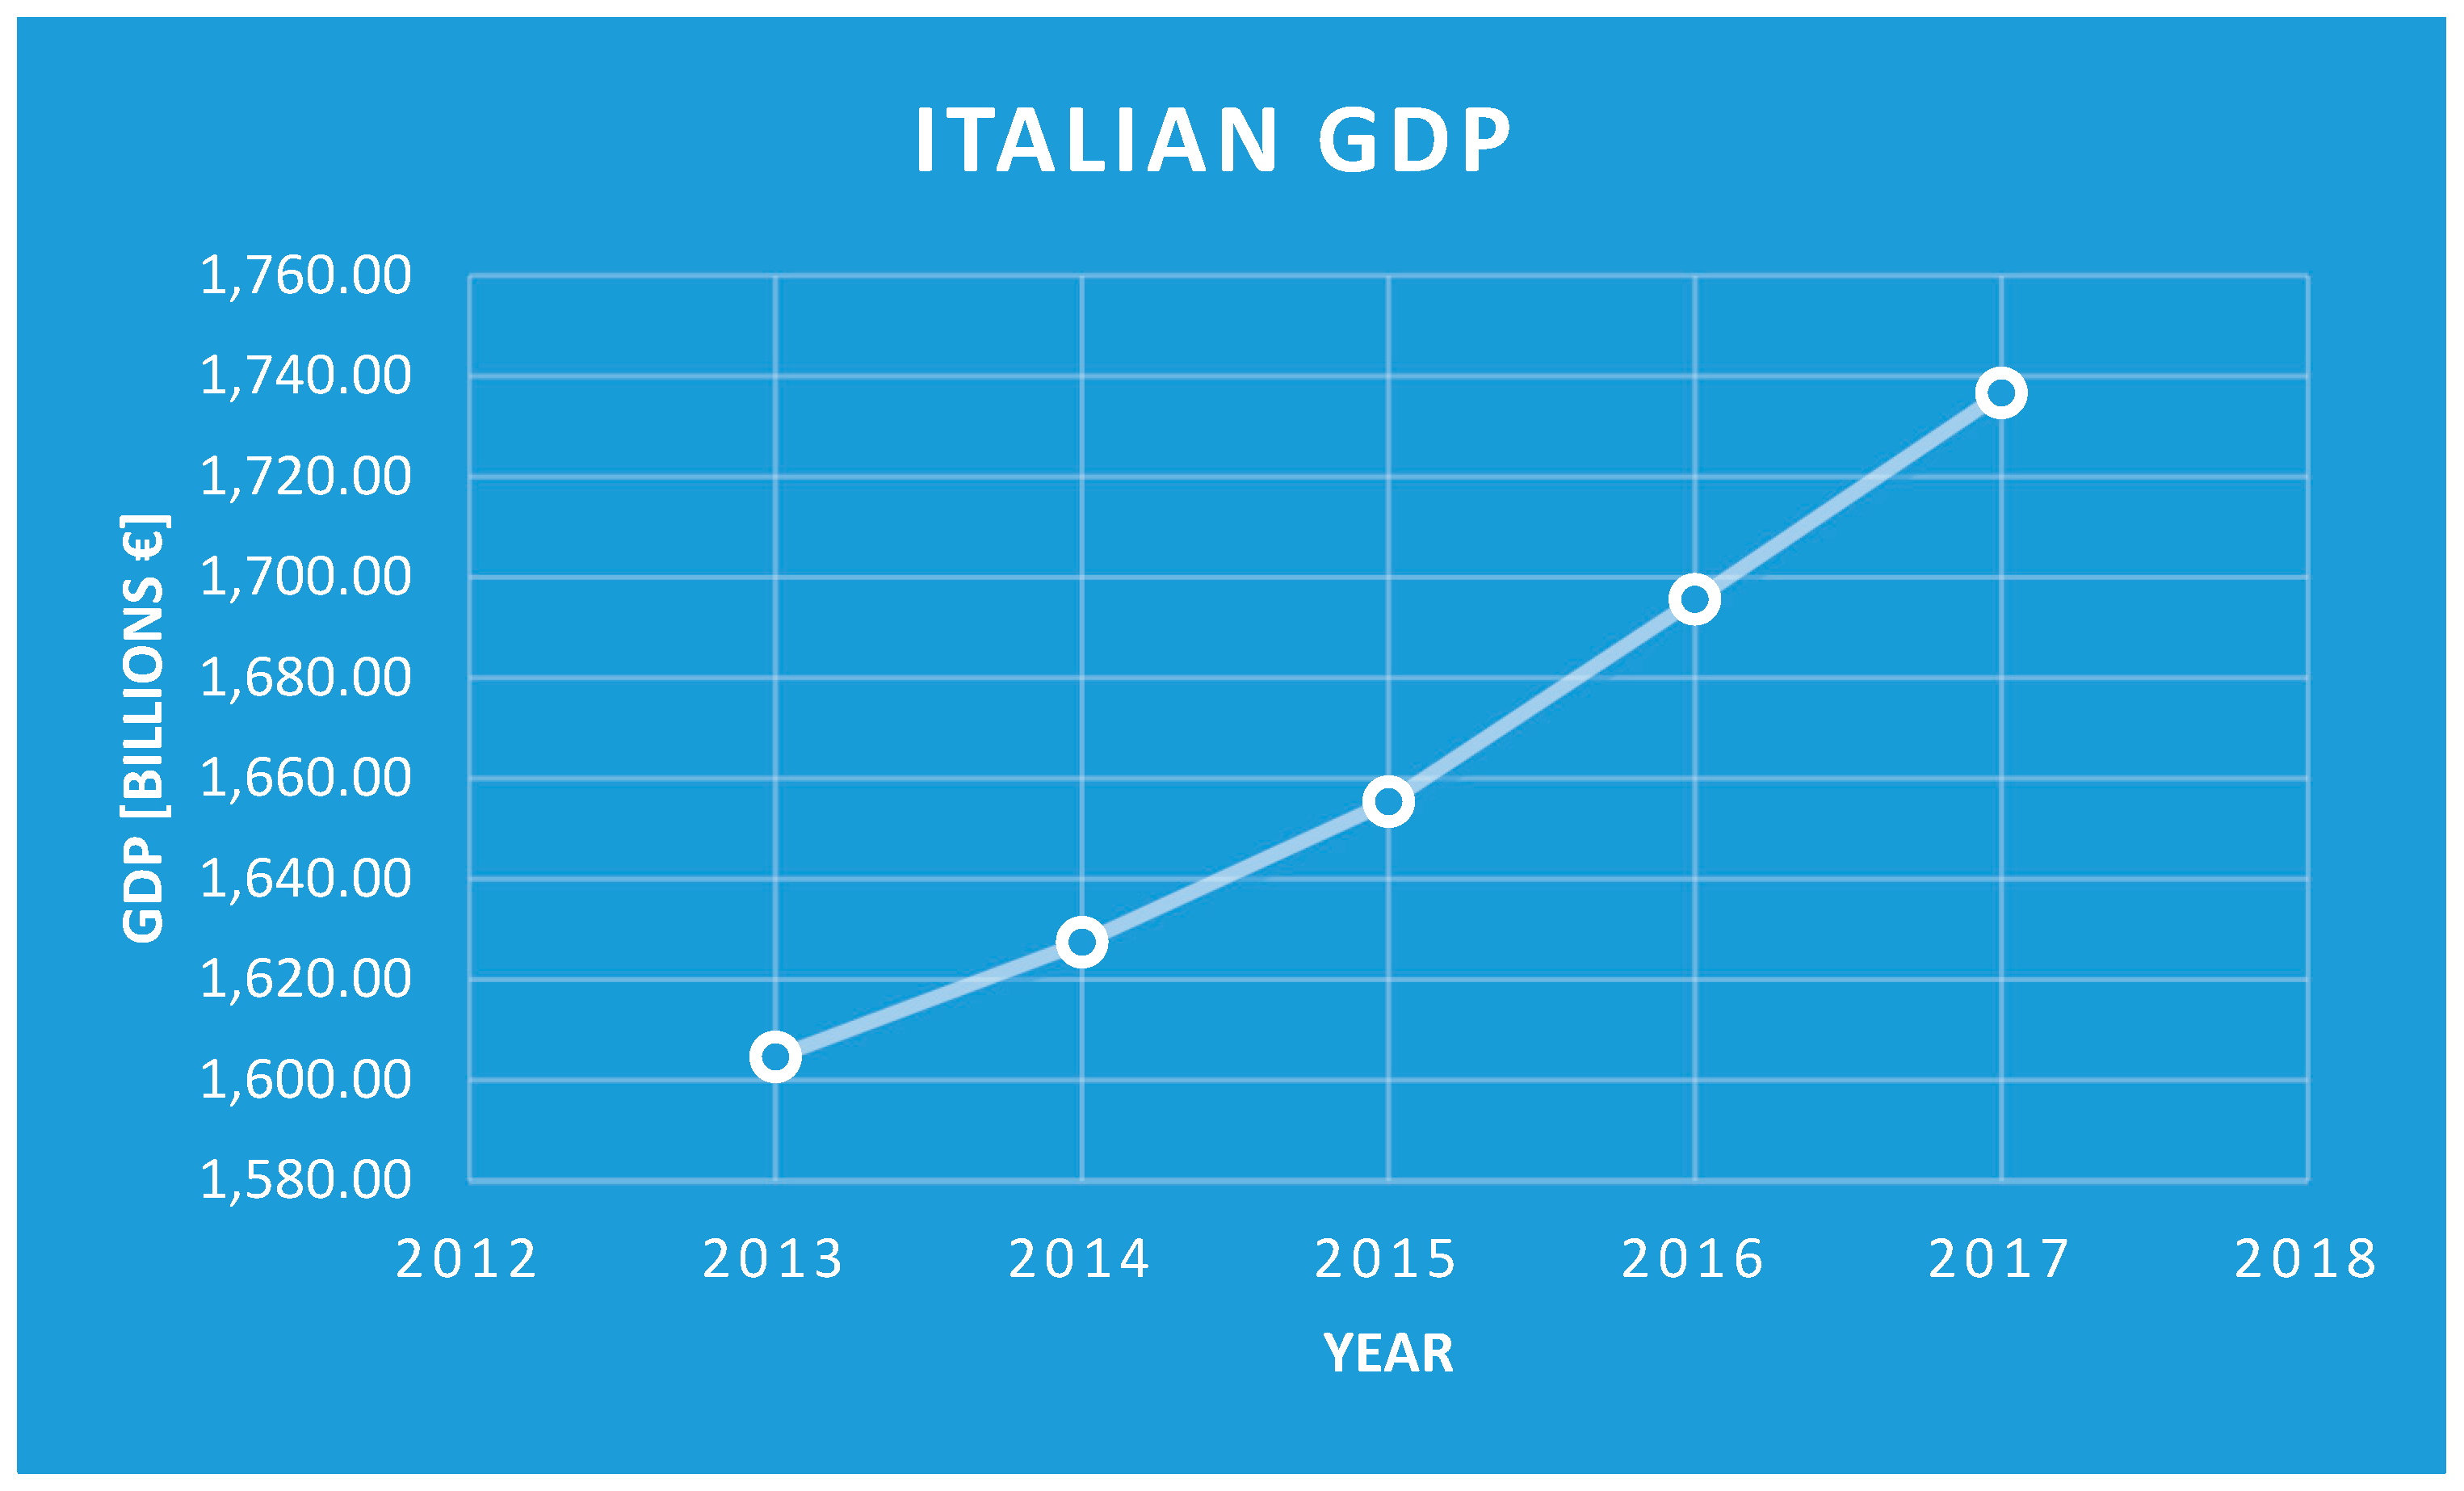
- The Eδ does not correlate with the GDP (Figure 10): the GDP curve is convex and growing, while the Eδ curve is fairly constant around 12 ZJ/year except for 2017 in which there was less destruction in respect to the other years it was compared with. This was an unexpected result worthy of further investigation.
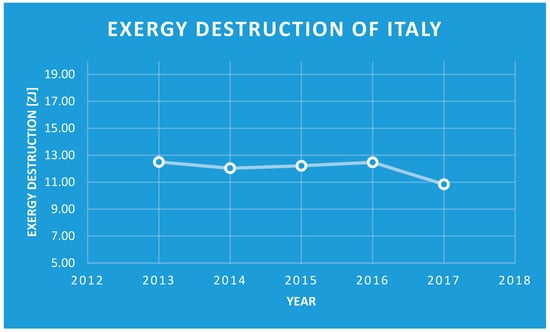 Figure 10. Exergy destruction by Italian society 2013–2017.
 - (e)
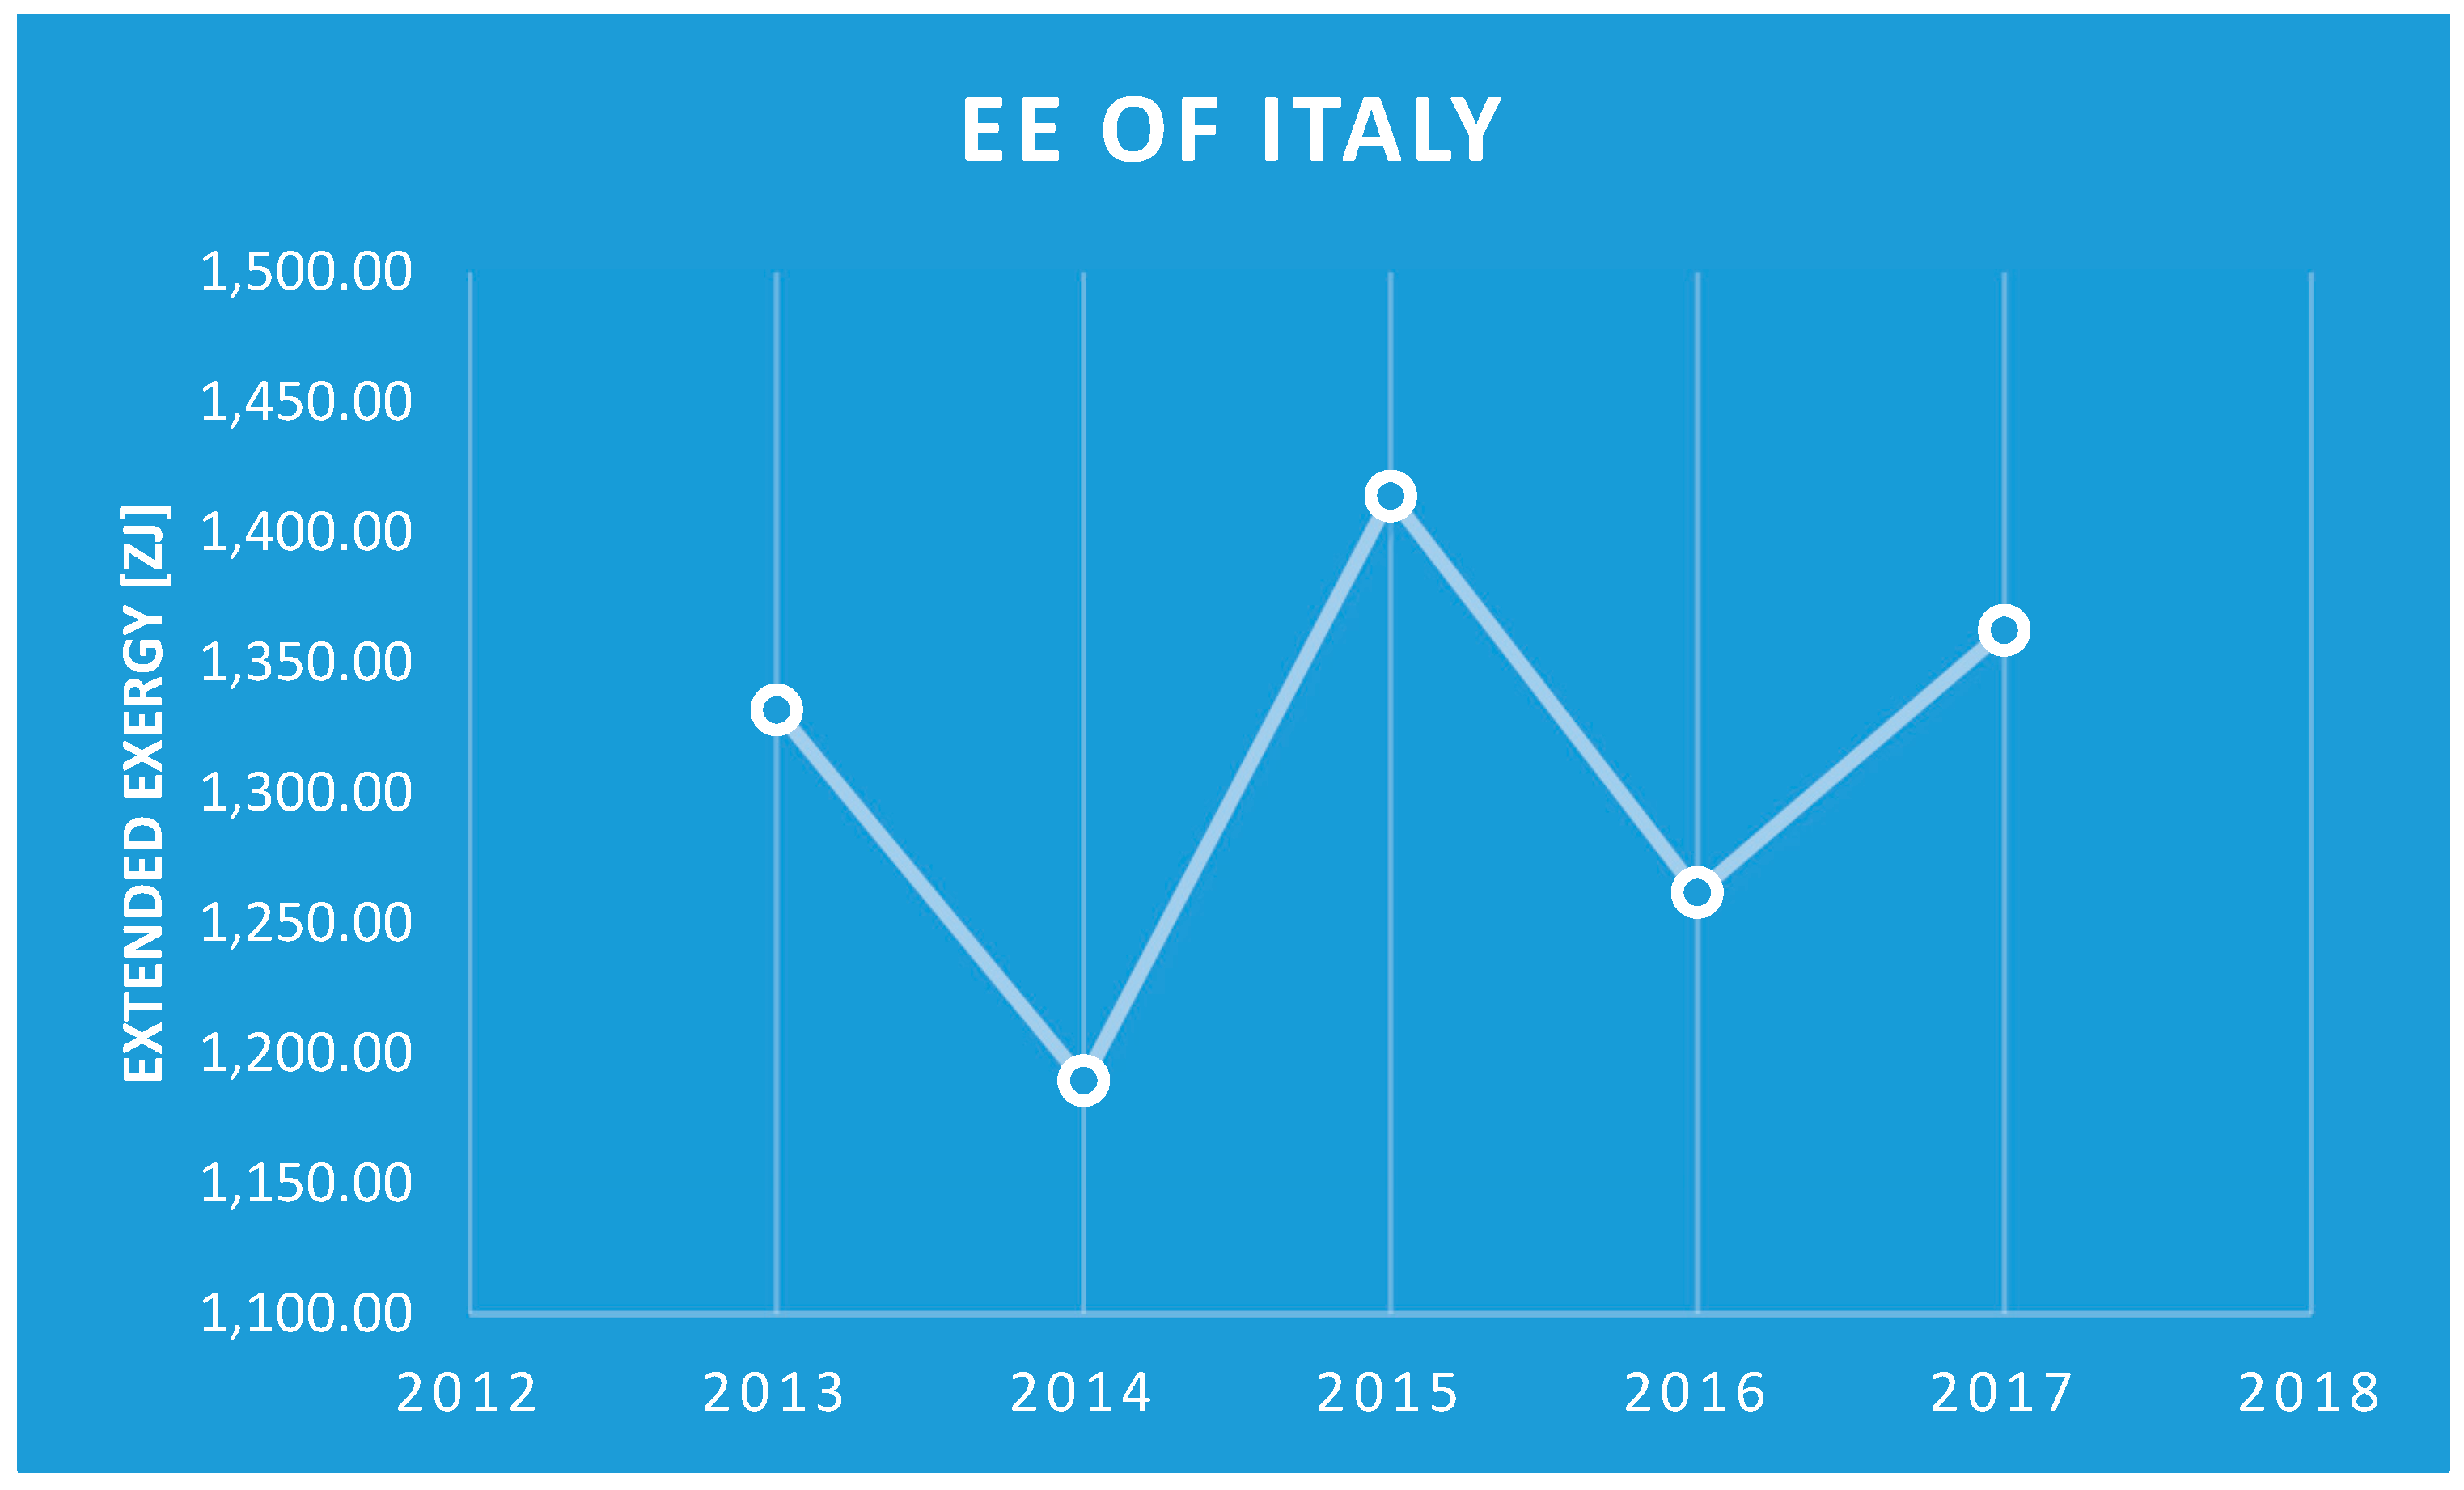
- The Extended Exergy, that is the “cost” of Italian society, is fairly constant, around a value of 1300 ZJ; it is instructive to compare this trend with that of the GDP. Historically, we associate development and wellness with a growth of GDP, so considering Figure 11, one could be led to consider that the Italian society is growing in the “right way”; the problem is that, according to the analysis, the Extended Exergy of the country reached a plateau (Figure 12); this means that the “cost” of the economic and social growth was the same within the years, witnessing the absence of enhanced rational exploitation of the available resources. As a matter of fact, this result suggests that the sustainability of the Italian society did not improve throughout the window of observation.
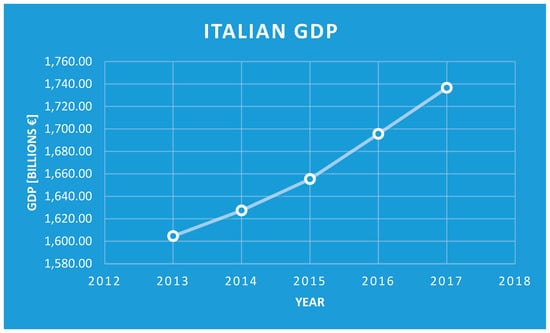 Figure 11. Gross Domestic Product of Italy 2013–2017.
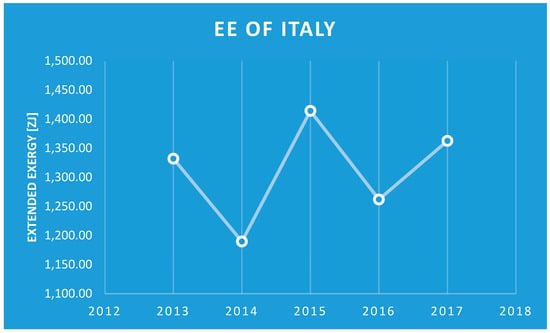 Figure 12. EEA of Italy 2013–2017.
4. Conclusions
An Extended Exergy Analysis of the Italian system was conducted over a period of five years, 2013–2017. This is, to date, the EEA based on the most disaggregated database. An innovative data validation and reconciliation procedure was implemented to assure the full congruency of the data prior to the actual analysis. The Italian society is divided in the usual seven sectors, plus the Environment and a virtual sector (“Abroad”) that accounts for the import/export of materials and energy fluxes. The two econometric coefficients a and b were calculated for each year, as well as the specific Extended Exergy of Labor eeL and of Capital, eeK. All values are consistent with previous analyses and confirm the validity of the approach. The exergy destruction in the system and the Extended Exergy are compared with the GDP along the observation window, and it is demonstrated that the two are not correlated. The study is the basis for the development of a standard comparison basis between different indicators of sustainability.
Nomenclature
| CExC | Cumulative Exergy Content |
| Cp | Specific heat, constant pressure |
| DNI | Direct Normal Irradiance |
| Exergy rate | |
| EEA | Extended Exergy Analysis |
| EEenv | Extended Exergy of environment remediation |
| . | Extended Exergy of Labor |
| Extended Exergy of Capital | |
| δ | Exergy destruction rate |
| fc | Carnot factor |
| h | Specific enthalpy |
| Ib | Solar constant |
| M2 | Money + quasi-money circulation |
| PV | Photovoltaics |
| S | Specific entropy |
| T | Temperature |
| TE | Thermo-Economics |
| Greek symbols | |
| α | First econometric factor |
| β | Second econometric factor |
| ηII | Exergy efficiency |
References
- The World Commission on Environment and Development (Brundtland Commission). Our Common Future; Oxford University Press: Oxford, UK, 1987. [Google Scholar]
- Sciubba, E. Our Exergy Footprint: A Thermodynamic Indicator for the Assessment of the Degree of Unsustainability of Energy Systems; Perspectives for Joint Research Projects, Russian Center of Science and Culture; Seminar on Autonomous Energy and Energy Efficiency: Rome, Italy, 2019. [Google Scholar]
- Empresa de Pesquisa Energetica, Ministero de Minas e Energia. Brazilian Energy Balance. 2017. Available online: https://epe.gov.br (accessed on 6 March 2020).
- Eurostat. Energy Balances. Available online: https://ec.europa.eu (accessed on 6 March 2020).
- ISTAT. Energy Balance of Italy. Available online: https://dati.istat.it (accessed on 6 March 2020).
- Rant, Z. Energy Value and Pricing. Strojniski vestnik. J. Mech. Eng. 1995, 1, 4–7. [Google Scholar]
- Rocco, M.V.; Colombo, E.; Sciubba, E. Advances in Exergy Analysis. A Novel Assessment of the Extended Exergy Accounting method. Appl. Energy 2014, 113, 1405–1420. [Google Scholar] [CrossRef]
- Wall, G. Exergy conversion in the Swedish society. Resour. Energy 1987, 9, 55–73. [Google Scholar] [CrossRef]
- Wall, G. Exergy conversion in the Japanese society. Energy 1990, 15, 435–444. [Google Scholar] [CrossRef]
- Hammond, G.P.; Stapleton, A.J. Exergy analysis of the UnitedKingdom energy system. Proc. Inst. Mech. Eng. Part A 2001, 215, 141–162. [Google Scholar] [CrossRef]
- Ertesvåg, I.S. Society exergy analysis: A comparison of different Societies. Energy 2001, 26, 253–270. [Google Scholar] [CrossRef]
- Brockway, P.E.; Barrett, J.R.; Foxon, J.T.; Steinberger, J.K. Divergence of Trend in US and UK aggregate Exergy Efficiencies 1960–2010. Environ. Sci. Technol. 2014, 48, 9874–9881. [Google Scholar] [CrossRef]
- Chen, B.; Chen, J.Q. Exergy Analysis for Resource Conversion of the Chinese Society 1993 Under the Material product System. Energy 2006, 31, 1115–1150. [Google Scholar] [CrossRef]
- Koroneos, C.J.; Nanaki, E.A. Energy and Exergy utilization Assessment of the Greek Transoprt Sector. Resour. Conserv. Recycl. 2008, 52, 700–706. [Google Scholar] [CrossRef]
- Szargut, J.; Ziębik, A.; Stanek, W. Depletion of the Unrestorable Natural Exergy Resources as a Measure of the Ecological Cost. Energy Convers. Manag. 2002, 42, 9–12, 1149–1163. [Google Scholar]
- Sciubba, E. A novel exergetic costing method for determining the optimal allocation of scarce resources. In Proc. Contemporary Problems of Thermal Engineering; Ziebek, A., Ed.; Gliwice, Poland, 1998; pp. 311–324. [Google Scholar]
- Dai, J.; Chen, B.; Sciubba, E. Extended Exergy Based Economic Accounting for the Transportation Sector in China. Renew. Sustain. Energy Rev. 2014, 32, 229–237. [Google Scholar] [CrossRef]
- Sciubba, E.; Bastianoni, S.; Tiezzi, E. Exergy and Extended Exergy accounting of very large complex systems with an application to the province of Siena, Italy. J. Environ. Manag. 2008, 86, 372–382. [Google Scholar] [CrossRef] [PubMed]
- Ertesvåg, I.S. Energy, exergy, and extended-exergy analysis of the Norwegian society 2000. Energy 2005, 30, 649–675. [Google Scholar] [CrossRef]
- Ptasinski, K.J.; Koymans, M.N.; Verspagen, H.H.G. Performance of the Dutch energy sector based on energy, exergy and Extended Exergy accounting. Energy 2006, 31, 3135–3144. [Google Scholar] [CrossRef]
- Feynman, R. The Feynman Lecture on Physics Vol. 1, Chp. 4. Available online: http://feynmanlectures.caltech.edu/I_04.html (accessed on 3 May 2020).
- Petela, R. Engineering Thermodynamics of Thermal Radiation; McGrawHill: New York, NY, USA, 2010. [Google Scholar]
- Moran, M.J.; Shapiro, H.N.; Boettner, D.D.; Bailey, M.B. Fundamentals of Engineering Thermodynamics, 8th ed.; Wiley: Hoboken, NJ, USA, 2014. [Google Scholar]
- Sciubba, E.; Wall, G. A brief commented history of exergy from the beginnings to 2004. Int. J. Thermodyn. 2007, 10, 1–26. [Google Scholar]
- Szargut, J. Exergy Method-Technical and Ecological Applications; WIT Press: Southampton, UK, 2005. [Google Scholar]
- Sayed, Y.M.E. The Thermo-Economics of Energy Conversion; Elsevier: Amsterdam, The Netherlands, 2003. [Google Scholar]
- Gaggioli, R.A.; Rodriguez, L. Second Law Efficiency of a Coal Gasification Process. Can. J. Chem. Eng. 1980, 58, 376–381. [Google Scholar]
- Szargut, J.; Morris, D.R.; Steward, F.R. Exergy Analysis of Thermal, Chemical, and Metallurgical Processes; Hemispere Pub: New York; NY, USA, 1988. [Google Scholar]
- Valero, A.; Usón, S.; Torres, C.; Valero, A. Application of Thermoeconomics to Industrial Ecology. Entropy 2010, 12, 591A–612A. [Google Scholar] [CrossRef]
- Sciubba, E. Beyond Thermoeconomics? The concept of Extended Exergy Analysis and Its Application to the Analysis and Design of Thermal Systems. Exergy Int. J. 2001, 1, 68–84. [Google Scholar] [CrossRef]
- Sciubba, E. A revised calculation of the econometric factors α- and β for the Extended Exergy Accounting method. Ecol. Mod. 2011, 222, 1060–1066. [Google Scholar] [CrossRef]
- Available online: http://globalsolaratlas.info (accessed on 1 February 2020).
- ISTAT. La Superficie dei Comuni, delle Province e delle Regioni Italiane; ISTAT: Chicago, IL, USA, 2013. [Google Scholar]
- Valero, A.; Al Valero, U.J.; Martínez, A. Physical Hydronomics: Application of the exergy analysis to the assessment of environmental costs of water bodies. The case of the inland basins of Catalonia. Energy 2009, 34, 2101–2107. [Google Scholar] [CrossRef]
- Available online:. Available online: http://bacino-adige.it (accessed on 3 March 2020).
- Available online:. Available online: http://arpat.toscana.it (accessed on 3 March 2020).
- Available online:. Available online: http://arpa.veneto.it (accessed on 3 March 2020).
- Available online:. Available online: http://autorita.bacinoserchio.it/ (accessed on 3 March 2020).
- Available online:. Available online: http://idrografico.regione.lazio.it (accessed on 3 March 2020).
- Available online:. Available online: http://webbook.nist.gov (accessed on 5 March 2020).
- Davies, J.H. Global map of solid Earth surface heat flow. Geochem. Geophys. Geosyst. 2013, 14, 4608–4622. [Google Scholar] [CrossRef]
- Available online:. Available online: http://dati.istat.it (accessed on 5 March 2020).
- TERNA. Produzione e Richiesta di Energia Elettrica in Italia dal 1883 al 2018; TERNA: Rome, Italy, 2019. [Google Scholar]
- TERNA. Consumi Energia Elettrica in Italia; TERNA: Rome, Italy, 2019. [Google Scholar]
- GSE. Energia nel Settore Trasporti 2005–2018; GSE: Rome, Italy, 2019. [Google Scholar]
- GSE. Rapporto Statistico FER 2017; GSE: Rome, Italy, 2018. [Google Scholar]
- ISTAT. 6° censimento generale dell’agricoltura-utilizzo della risorsa idrica a fini irrigui in agricoltura; ISTAT: Chicago, IL, USA, 2014. [Google Scholar]
- ISTAT. Utilizzo e Qualità della Risorsa Idrica in Italia; ISTAT: Chicago, IL, USA, 2019. [Google Scholar]
- Nolè, A.; Collalti, A.; Borghetti, M.; Chiesi, M.; Chirici, G.; Magnani, F.; Marras, S.; Maselli, F.; Sirca, C.; Spano, D.; et al. The Role of Managed Forest Ecosystems: A Modelling Based Approach, Environmental Science and Engineering; Springer: Berlin/Heidelberg, Germany, 2014. [Google Scholar] [CrossRef]
- Available online:. Available online: http://isprambiente.gov.it (accessed on 5 March 2020).
- ISPRA Il piombo nelle munizioni da caccia: Problematiche e possibili soluzioni; ISPRA: Rome, Italy, 2012.
- Sharqawy, M.H.; Zubair, S.M. On Exergy Calculations of Seawater with Applications in Desalination Systems; Int. J. Therm. Sci. 2012, 50, 187–196. [Google Scholar] [CrossRef]
Publisher’s Note: MDPI stays neutral with regard to jurisdictional claims in published maps and institutional affiliations. |
© 2020 by the authors. Licensee MDPI, Basel, Switzerland. This article is an open access article distributed under the terms and conditions of the Creative Commons Attribution (CC BY) license (https://creativecommons.org/licenses/by/4.0/).

