Abstract
Simulations of two incineration processes, with and without flue gas recirculation, have been carried out performing an exergy analysis to investigate the most critical equipment unit in terms of second-law efficiency. Flue gas from the economizer outlet is employed to partially replace secondary combustion air to reduce, at the same time, incinerator temperature and oxygen concentration. Conversely, in the proposed configuration, the recirculated flue gas flow rate is used to control incinerator temperature, while the air flow rate is used to control the oxygen content of the fumes, leaving the incinerator as close to 6% as possible—i.e., the minimum allowed for existing plants to ensure completion of the combustion reactions and according to environmental regulations—and determines the corresponding minimum flue gas flow rate. The flue gas recirculation guarantees a larger level of energy recovery (up to +3%) and, at the same time, lower investment costs for the lower flow rate of fumes actually emitted if compared to the plant configuration without flue gas recirculation. Various operating parameters were varied (incinerator’s effluent gas temperature, air flowrate and flue gas recirculation flowrate) to investigate their influence on process exergy efficiency. Exergy analysis allowed the individuation of the equipment units characterized by larger exergy destruction and demonstrated that the flue gas recirculation led to an overall process exergy efficiency increase of about 3%.
1. Introduction
The quick population growth and high raw materials consumption are leading to a substantial increase in the municipal solid waste (MSW) produced worldwide, which has a remarkable negative impact on life quality []. MSW incineration, among other possible waste treatment processes, represents a well-known technology that can also allow waste to be transformed into mechanical power, according to the waste to energy (WtE) approach []. WtE can be considered an important choice for waste management: indeed, in 2015, about 2200 waste incineration plants were operative worldwide, with a capacity of 280 Mt/d []. It has been estimated that a reduction of 10–15% of GHG (GreenHouse Gas) emissions can be reached by improving MSW management []. Despite the notable advantages of MSW incineration, some disadvantages have still reduced the overall efficiency and limited the environmental benefits of this process: by-product production (bottom and fly ashes, on which intensive research on their reuse is currently ongoing []), combustion instabilities, toxic gaseous pollutants and heavy metals emissions []. In this framework, exergy analysis may be a fundamental tool to individuate thermodynamic irreversibility and waste streams based on a second principle analysis, overcoming the drawbacks of the first principle analysis of existing and new power plants.
The present work reports the exergy analysis of a previous simulated incineration plant, integrated with steam and work production cycle but without considering the flue gas treatment system [].
2. Materials and Methods
The process was built in a PRO/II simulation environment (see Figure 1).
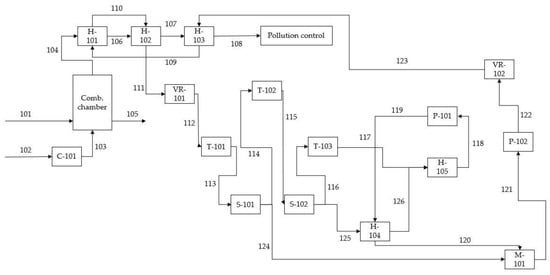
Figure 1.
Municipal solid waste (MSW) incineration plant scheme without flue gas recirculation (FGR).
The MSW (101) enters the incinerator with air compressed with a blower (C-101) up to 1.04 bar (103), then the flue gas (104) is sent to the boiler, represented by three heat exchangers (H-101 the vaporizer, H-102 the superheater and H-103 the economizer), and the produced steam is then sent to the turbines for the work generation by steam expansion. Then, the obtained condensed water is recirculated (by the pump P-102). The exhaust gas (108) is sent to the treatment units. The temperature of the flue gas and the oxygen %mol (kept > 6% on wet basis, according to current legislation []) were controlled by manipulating air inlet flowrate and flue gas recirculation. The equipment is indicated as follows: C-Compressor, P-Pump, S-Splitter, M-Mixer, H-Heat Exchanger, T-Turbine and VR-Regulator valve.
The exhaust gas treatment section aimed to reduce HCl and SO2 concentration to the EC regulation (Directive 2010/75/EU) and their modelling was limited to the pressure drop and power of the pump estimation for energy and exergy analysis. The temperature of stream 108, exhaust gas exiting from the boiler, was set equal to 200 °C based on the actual trend for energy efficiency increase. The thermal input was 22 MW (8.28 t/h of MSW), whereas the heat loss from the incinerator as radiative heat loss was 0.93 MW. More details are reported in Liuzzo et al., 2007 []. The MSW characteristics (proximate and ultimate analysis) are reported in Table 1.

Table 1.
MSW characteristics (from []).
The same overall process was simulated adopting flue gas recirculation (FGR) (see Figure 2).
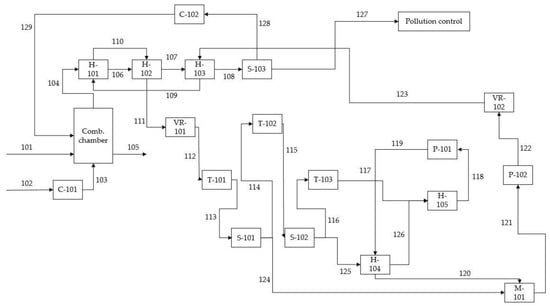
Figure 2.
MSW incineration plant scheme with FGR.
The simulations were carried out at two different temperatures of the combustion chamber—i.e., the temperature of exiting flue gas (950 °C and 1100 °C) and the operative conditions—and assumptions related to the other plant units are reported in Table 2 (ΔP [bar] represents pressure drop term).
Table 2.
Equipment characteristic parameters (from []).
As reported in Table 3, in this case, various benefits were achieved, such as larger net overall efficiency (defined as the multiplication of boiler efficiency and the efficiency of thermal energy conversion into electric energy), lower inlet air flowrate and flue gas flowrate to the stack after its treatment (i.e., lower investment and operative costs of treatment units).
Table 3.
Simulation results (from []).
For each piece of equipment and for the overall process, the physical and chemical exergy fluxes (in/out streams) were calculated using the following equations []:
where Exinph [kJ/h or kW] is the inlet/outlet physical exergy, M [kmol/h] is the molar flowrate of the considered stream, H [kJ/kmol] is the molar enthalpy of the stream at its P and T, H0 [kJ/kmol] is the molar enthalpy of the stream at P = 1 atm and T = T0 = 25 °C—i.e., the pressure and temperature of the dead state, S [kJ/K·kmol] is the entropy of the stream at its P and T and S0 [kJ/K·kmol] is the entropy of the stream at dead state conditions [], Exinch [kJ/h or kW] is the inlet/outlet chemical exergy, n is the number of chemical species, xi is the mole fraction of i species, exich (kJ/kmol) is the standard chemical exergy of i species at P = 1 atm and T0 = 25 °C taken from [,] or calculated with the procedure reported by Gharagheizi and co-workers [], R [kJ/K·kmol] is the gas constant.
In the calculations, the kinetic and potential exergy are usually neglected since their order of magnitude is lower with respect to those of chemical and physical exergy contributions; therefore, the exergy efficiency and destroyed exergy were calculated as:
where Extotprod and Extotfeed are the total exergy produced from the system and fed to the system, respectively, and Sgen [kJ/K·kmol] is the entropy generated.
3. Results
3.1. Exergy Analysis Results without FGR
Table 4.
Equipment exergy analysis results at 950 °C.
Table 5.
Cycle exergy analysis results at 950 °C.
Table 6.
Equipment exergy analysis results at 1100°C.
Table 7.
Cycle exergy analysis results at 1100 °C.
3.2. Exergy Analysis Results with FGR
Table 8.
Equipment exergy analysis results at 950 °C.
Table 9.
Cycle exergy analysis results at 950°C.
Table 10.
Equipment exergy analysis results at 1100°C.
Table 11.
Cycle exergy analysis results at 1100°C.
4. Discussion
Besides H-105, the exergy efficiency of machinery and heat exchangers was always higher than 60%, and the loss of exergy was due only to the irreversibility of the process (compression/heating, etc.). The H-105 was characterized by lower exergy efficiency because the heat transfer occurred with two mixed fluids entering the unit, streams 117 and 126, where stream 117 was characterized by a pressure of 0.081 bar and a low physical exergy with respect to that of streams 126 and outlet stream 118. Furthermore, the chemical exergy of stream 117 was one order of magnitude higher than that of stream 118. Due to the high chemical exergy of MSW in comparison with that of flue gas produced, the exergy efficiency of the combustion chamber was lower than 80%, even when FGR was adopted. FGR also led to exergy efficiency improvement, besides the well-known environmental and economic benefits. The FGR allowed an increase η of 3% at 950 °C and about 2.5% at 1100 °C. The increase in temperature in the combustion chamber also led to exergy efficiency improvement, because of the larger power produced by the three turbines with respect to the exergy feed flow, and, therefore, lower irreversibility and waste. The FGR allowed a reduction in exergy loss as waste, since an aliquot of FGR will be recirculated and will not be sent to pollution treatment units. The second configuration required an additional compressor (C-102), but the FGR adoption permitted a reduction in the power consumption of the first compressor unit because of the lower oxidant inlet flowrate and lower exergy feed flow.
Funding
This research received no external funding.
Conflicts of Interest
The authors declare no conflict of interest.
References
- Blasenbauer, D.; Huber, F.; Lederer, J.; Quina, M.J.; Blanc-Biscarat, D.; Bogush, A.; Bontempi, E.; Blondeau, J.; Chimenos, J.M.; Dahlbo, H.; et al. Legal situation and current practice of waste incineration bottom ash utilisation in Europe. Waste Manag. 2020, 102, 868–883. [Google Scholar] [CrossRef] [PubMed]
- Wu, Y.; Tao, Y.; Deng, Z.; Zhou, J.; Xu, C.; Zhang, B. A fuzzy analysis framework for waste incineration power plant comprehensive benefit evaluation from refuse classification perspective. J. Clean. Prod. 2020, 258, 120734. [Google Scholar] [CrossRef]
- Wissing, F.; Wirtz, S.; Scherer, V. Simulating municipal solid waste incineration with a DEM/CFD method—Influences of waste properties, grate and furnace design. Fuel 2017, 206, 638–656. [Google Scholar] [CrossRef]
- Scarlat, N.; Fahl, F.; Dallemand, J.F. Status and Opportunities for Energy Recovery from Municipal Solid Waste in Europe. Waste Biomass Valorization 2019, 10, 2425–2444. [Google Scholar] [CrossRef]
- Cristelo, N.; Segadães, L.; Coelho, J.; Chaves, B.; Sousa, N.R.; Lopes, M.d. Recycling municipal solid waste incineration slag and fly ash as precursors in low-range alkaline cements. Waste Manag. 2020, 104, 60–73. [Google Scholar] [CrossRef] [PubMed]
- Ding, G.; He, B.; Cao, Y.; Wang, C.; Su, L.; Duan, Z.; Song, J.; Tong, W.; Li, X. Process simulation and optimization of municipal solid waste fired power plant with oxygen/carbon dioxide combustion for near zero carbon dioxide emission. Energy Convers. Manag. 2018, 157, 157–168. [Google Scholar] [CrossRef]
- Liuzzo, G.; Verdone, N.; Bravi, M. The benefits of flue gas recirculation in waste incineration. Waste Manag. 2007, 27, 106–116. [Google Scholar] [CrossRef] [PubMed]
- Kotas, T.J. The Exergy Method of Thermal Plant Analysis; Elsevier: London, UK, 1985. [Google Scholar] [CrossRef]
- Gharagheizi, F.; Ilani-Kashkouli, P.; Hedden, R.C. Standard molar chemical exergy: A new accurate model. Energy 2018, 158, 924–935. [Google Scholar] [CrossRef]
- Morris, D.R.; Szargut, J. Standard chemical exergy of some elements and compounds on the planet earth. Energy 1986, 11, 733–755. [Google Scholar] [CrossRef]
Publisher’s Note: MDPI stays neutral with regard to jurisdictional claims in published maps and institutional affiliations. |
© 2020 by the authors. Licensee MDPI, Basel, Switzerland. This article is an open access article distributed under the terms and conditions of the Creative Commons Attribution (CC BY) license (https://creativecommons.org/licenses/by/4.0/).