1. Introduction
The power consumption of Base Transceiver Station (BTS) equipment has been and will be increasing in the future due to growth in data transfer [
1]. Heat dissipation from the BTS will be higher too, even if the efficiency of the equipment itself is continuously improving [
2]. Due to rising heat dissipation of the equipment, the cooling of indoor sites also needs to be increased. In current commercial BTS deployments only air cooling is used, meaning that the site room is either ventilated or air conditioned to keep room temperature at desired levels. Site rooms in telecommunications are not typically designed for equipment use, but are free spaces in attics, basements, etc., where air flow distribution is not optimized. Impacts of air flow distribution to cooling energy consumption have been studied in data centers and significant savings were achieved [
3]. Therefore, air cooling efficiency in BTS site is poor and site level energy consumption is growing even higher.
An alternative solution proposed is liquid cooling, where BTS is liquid-cooled and heat from the BTS is transferred directly outside the site room for dissipation or reuse. This would basically minimize the cooling need for the site room and provide energy savings for the communication service providers (CSPs). The liquid cooling solution is a closed loop circulation using direct contact cold plates, which replace the heat sinks and fans in air-cooled BTS.
The purpose of this paper is to describe the results and findings of the world’s first commercial liquid-cooled BTS and to prove that cooling energy can be reduced and even reused. Liquid cooling for BTS is earlier demonstrated in a test system using an artificial BTS load [
4].
Measurements conducted for a test site in Helsinki, Finland, are described in the latter part of the article. Results showed that liquid cooling facilitates a significant energy saving potential for the CSPs, and heat from the BTS can be used for heating the building.
2. Materials and Methods
A key performance indicator (KPI) of the cooling is the coefficient of performance (COP), which is the ratio between the heat dissipation and the power used for cooling. In this study, the COP for air cooling and liquid cooling were calculated based on the measurements of a live BTS site in Helsinki, Finland, between 29 May 2018, and 26 July 2018, for the air cooling and 7 January 2019, to 23 February 2019 for the liquid cooling.
2.1. BTS Equipment
BTS equipment for air-cooled measurements was legacy equipment installed more than ten years ago. The system had 20 cooling fans each consuming 10 W, so the total power consumption of the fans was 200 W. The power consumption of the equipment fans was not possible to measure during the operation of the live BTS, but the value had been measured in a laboratory earlier, and matched the power consumption in the vendor data sheets [
5].
For liquid cooling, modern BTS units with higher efficiency were used and then modified to liquid cooling from the production version of the air-cooled units. In this modification, the heat sink part of the BTS module was replaced by a custom-made cold plate that provided the same contact to the printed circuit board (PCB) and other components. Fans from the units were removed, because the vast majority of the heat is transferred to a cold plate. Each unit was equipped with dripless liquid disconnects for easy installation and maintenance. In
Figure 1, (a) an air-cooled BTS unit and (b) a liquid-cooled BTS unit are depicted.
There were eight BTS units in total, both radios and digital processing units, in the liquid cooling setup. Additionally, there was an AC rectifier feeding the DC power to BTS units. The rectifier was liquid-cooled, and it was modified in the same way as the BTS modules by the rectifier vendor, using the existing air-cooled module. Power consumption of the digital processing unit is converted 100% to heat, but for the radio unit part of the power is radiated from the antennas and it must be deducted from the heat dissipation. Heat dissipation of the BTS can be calculated as
where Q is heat dissipation, P is the total power consumption of the BTS, and P
RF is the radiated radio frequency (RF) power to the antenna.
RF power was not measured, but estimated to be 480 W based on the used configuration: it was the same for both cooling systems.
2.2. Site Room Cooling
Original air cooling of the site was arranged by one site room fan that pushed fresh air into the room and fresh air was exhausted from the vents. Fan control was based on a site room temperature sensor that turned the fan on or off based on the site room temperature.
The liquid cooling system on this site was built using typical heating, ventilation and air conditioning (HVAC) components. BTS units were firstly connected to a manifold in a parallel arrangement. Two pumps in parallel were used to circulate liquid in the loop—pumps were dimensioned to have full redundancy in the case of one of them failing. Heat from the BTS was transferred to the heat exchanger (HEX) located outside of the site room in the building air ventilation channel. The HEX could be by-passed by the temperature controlled 3-way valve if the returning liquid temperature from the HEX was too low. Part of the heat was transferred to the thermostat-controlled room radiator, which would keep the room temperature high enough during the wintertime. A schematic of the site cooling is presented in
Figure 2.
The liquid used in the setup was 40% ethylene glycol water mixture to avoid corrosion and provide adequate antifreeze properties.
2.3. Monitoring
In the air cooling setup, the total energy consumption of the site was measured. This power consumption included the BTS and rectifier as well as the site room cooling fan. The energy consumption of the site room fan was not measured separately, and thus it was assumed to run continuously. This is not true for the colder days, but for the sake of consistency the assumption was made. Hence, its energy consumption could be calculated for the duration of the test session using the measured 244 W full speed power consumption. Site room external temperature was measured manually once a day.
For liquid cooling, the daily energy consumption of the BTS and the site room cooling fan were monitored. Pumps were set to run at a constant speed, and they consumed 45 W power [
6]. Site room external and internal temperatures were monitored for the test session.
2.4. KPI Calculation
Measured parameters were used to define different parameters to describe the effectiveness of the cooling. For both systems, COP was calculated as
For air cooling, cooling power was the sum of the equipment fans and site cooling fans. For liquid cooling, the cooling power consumption was sum of the pump and site room fan.
The dimensionless COP used for comparison eliminated the difference of the BTS types in the two cooling methods. The measurements were conducted at different times of the year due to the schedule of network installations, but external temperature difference was not too high and the temperature range was around 10 °C.
The second important KPI calculation was the annual energy consumption of the site cooling, which was calculated using the measured average COP of the cooling system for a typical BTS site. Annual energy consumption was calculated as
3. Results
3.1. Air Cooling Measurements
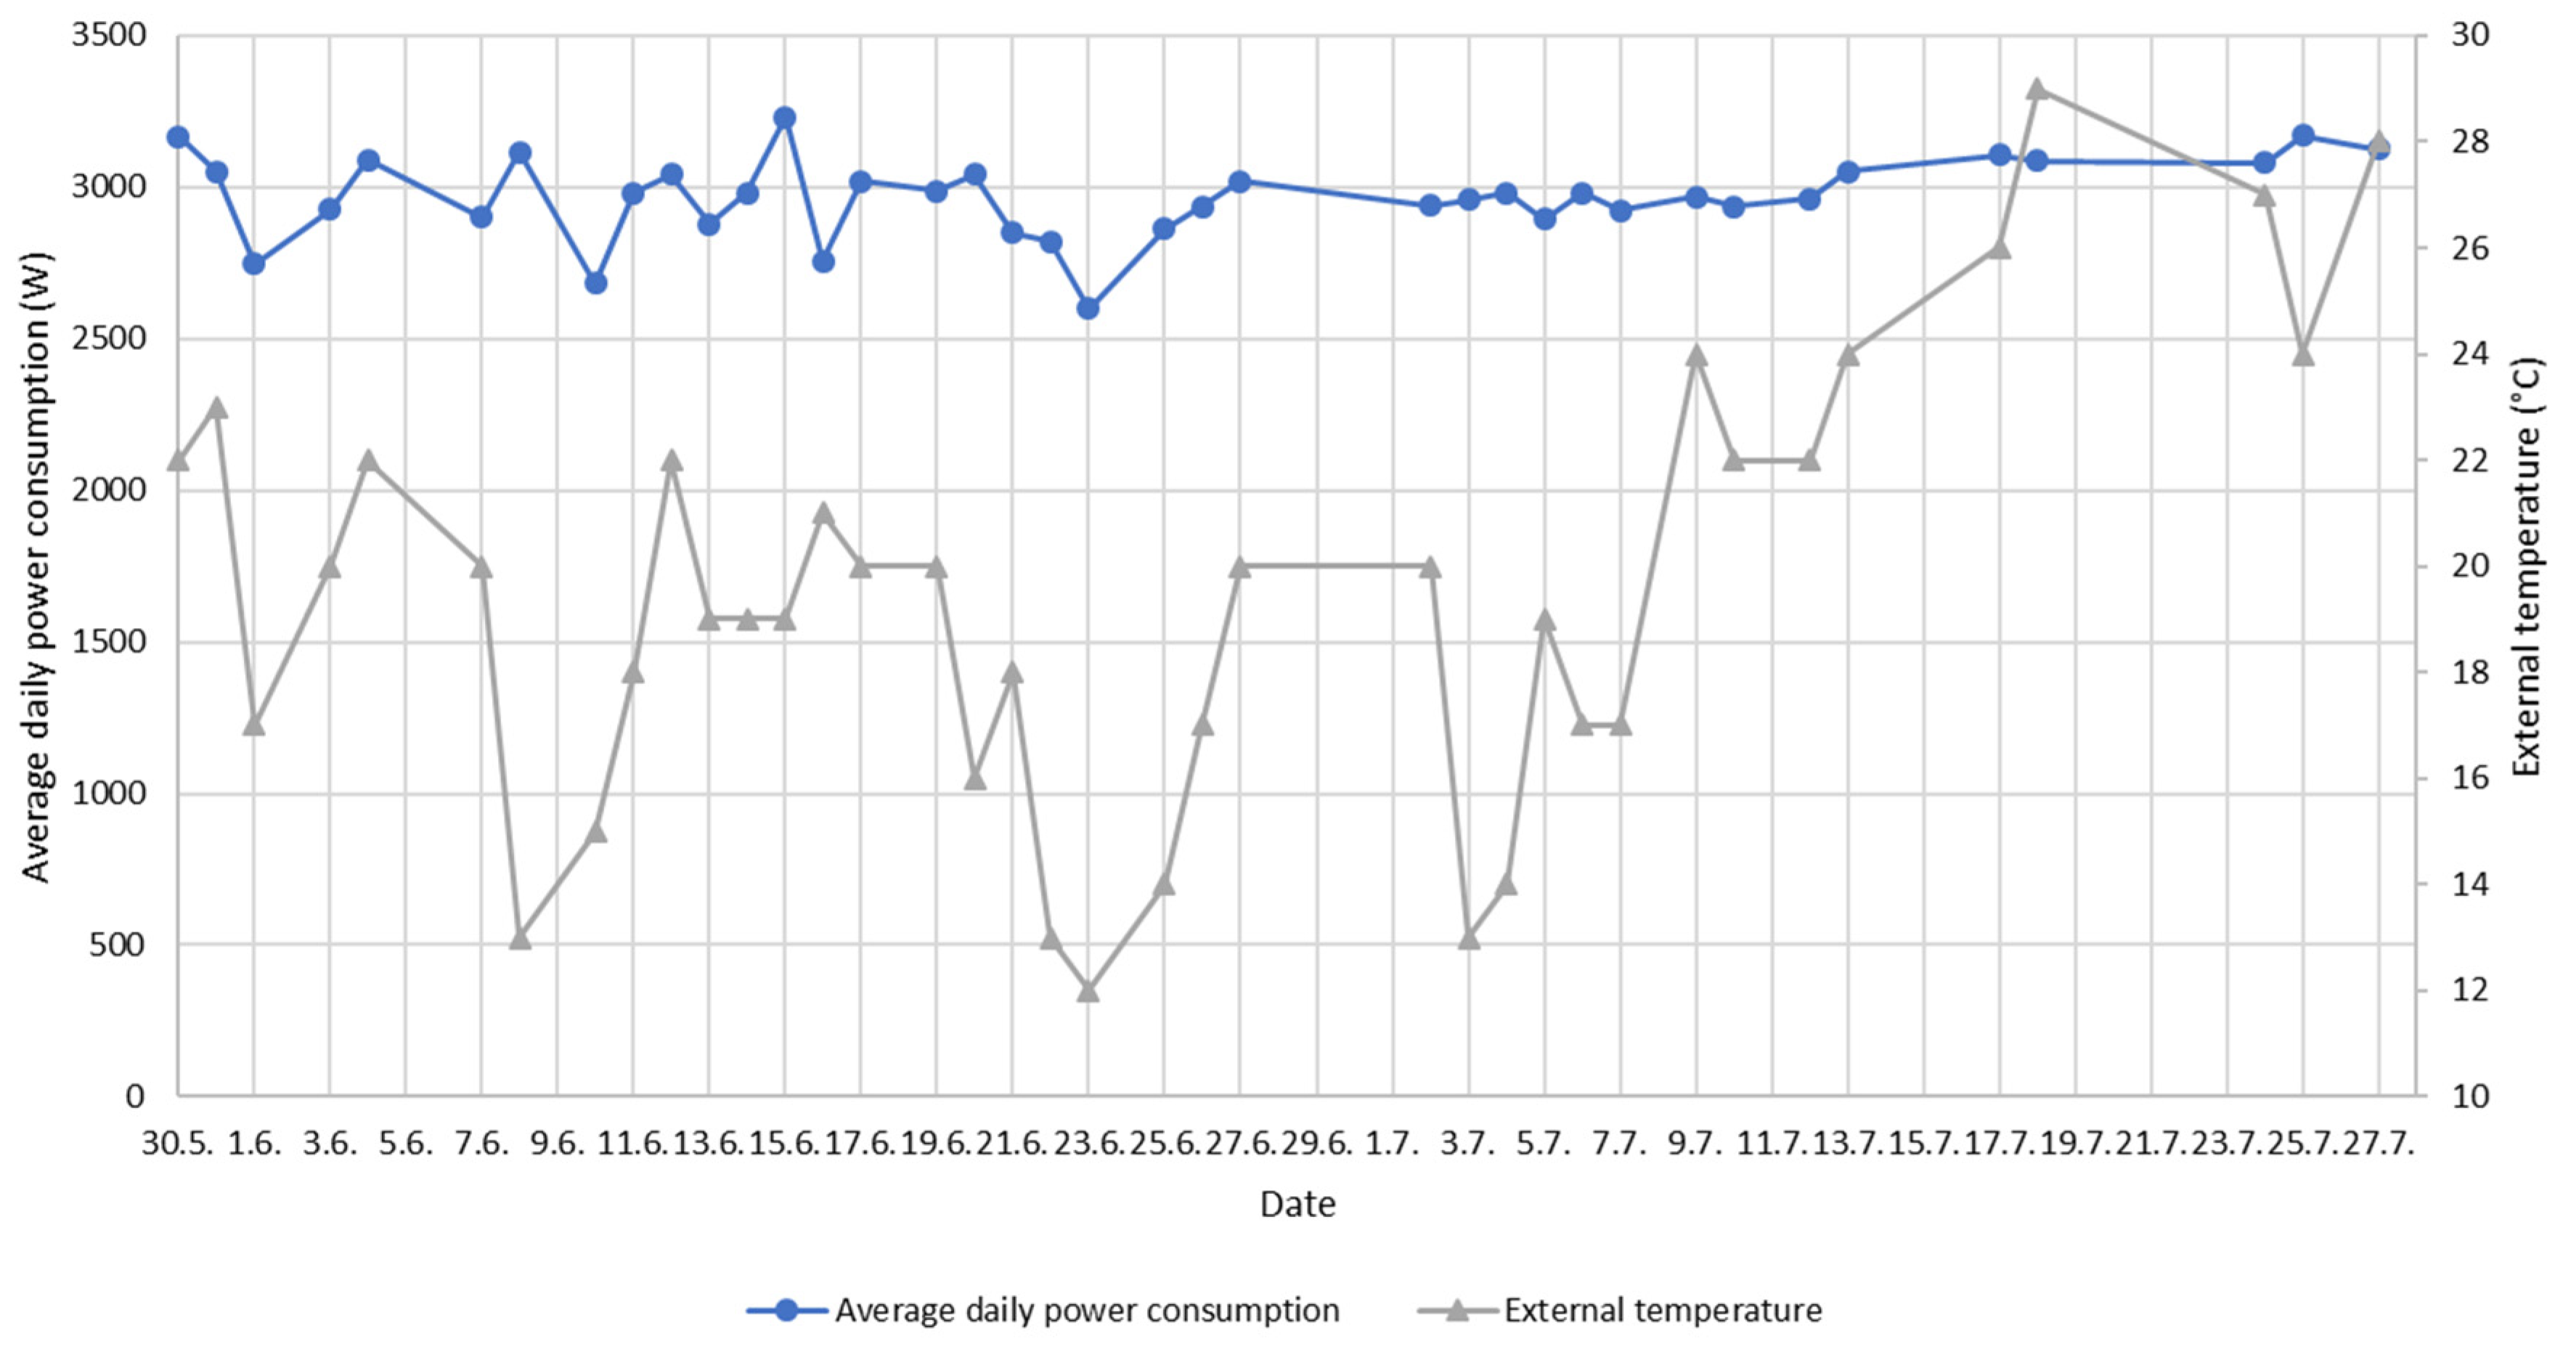
Average daily power consumption dissipation and external temperature for the air cooling system are presented in
Figure 3, for the 59 day measurement session between 29 May 2018, and 26 July 2018.
In
Figure 3, it appears that there is no correlation between the power consumption and the external temperature, but the minimum points occurred on the days with the lowest external temperature.
Individual COP points with a trendline for air cooling are presented in
Figure 4 as a function of external temperature.
Based on trend line presented in
Figure 4, the external temperature had an impact on the COP, especially for external temperatures below 25 °C.
3.2. Liquid Cooling Measurements
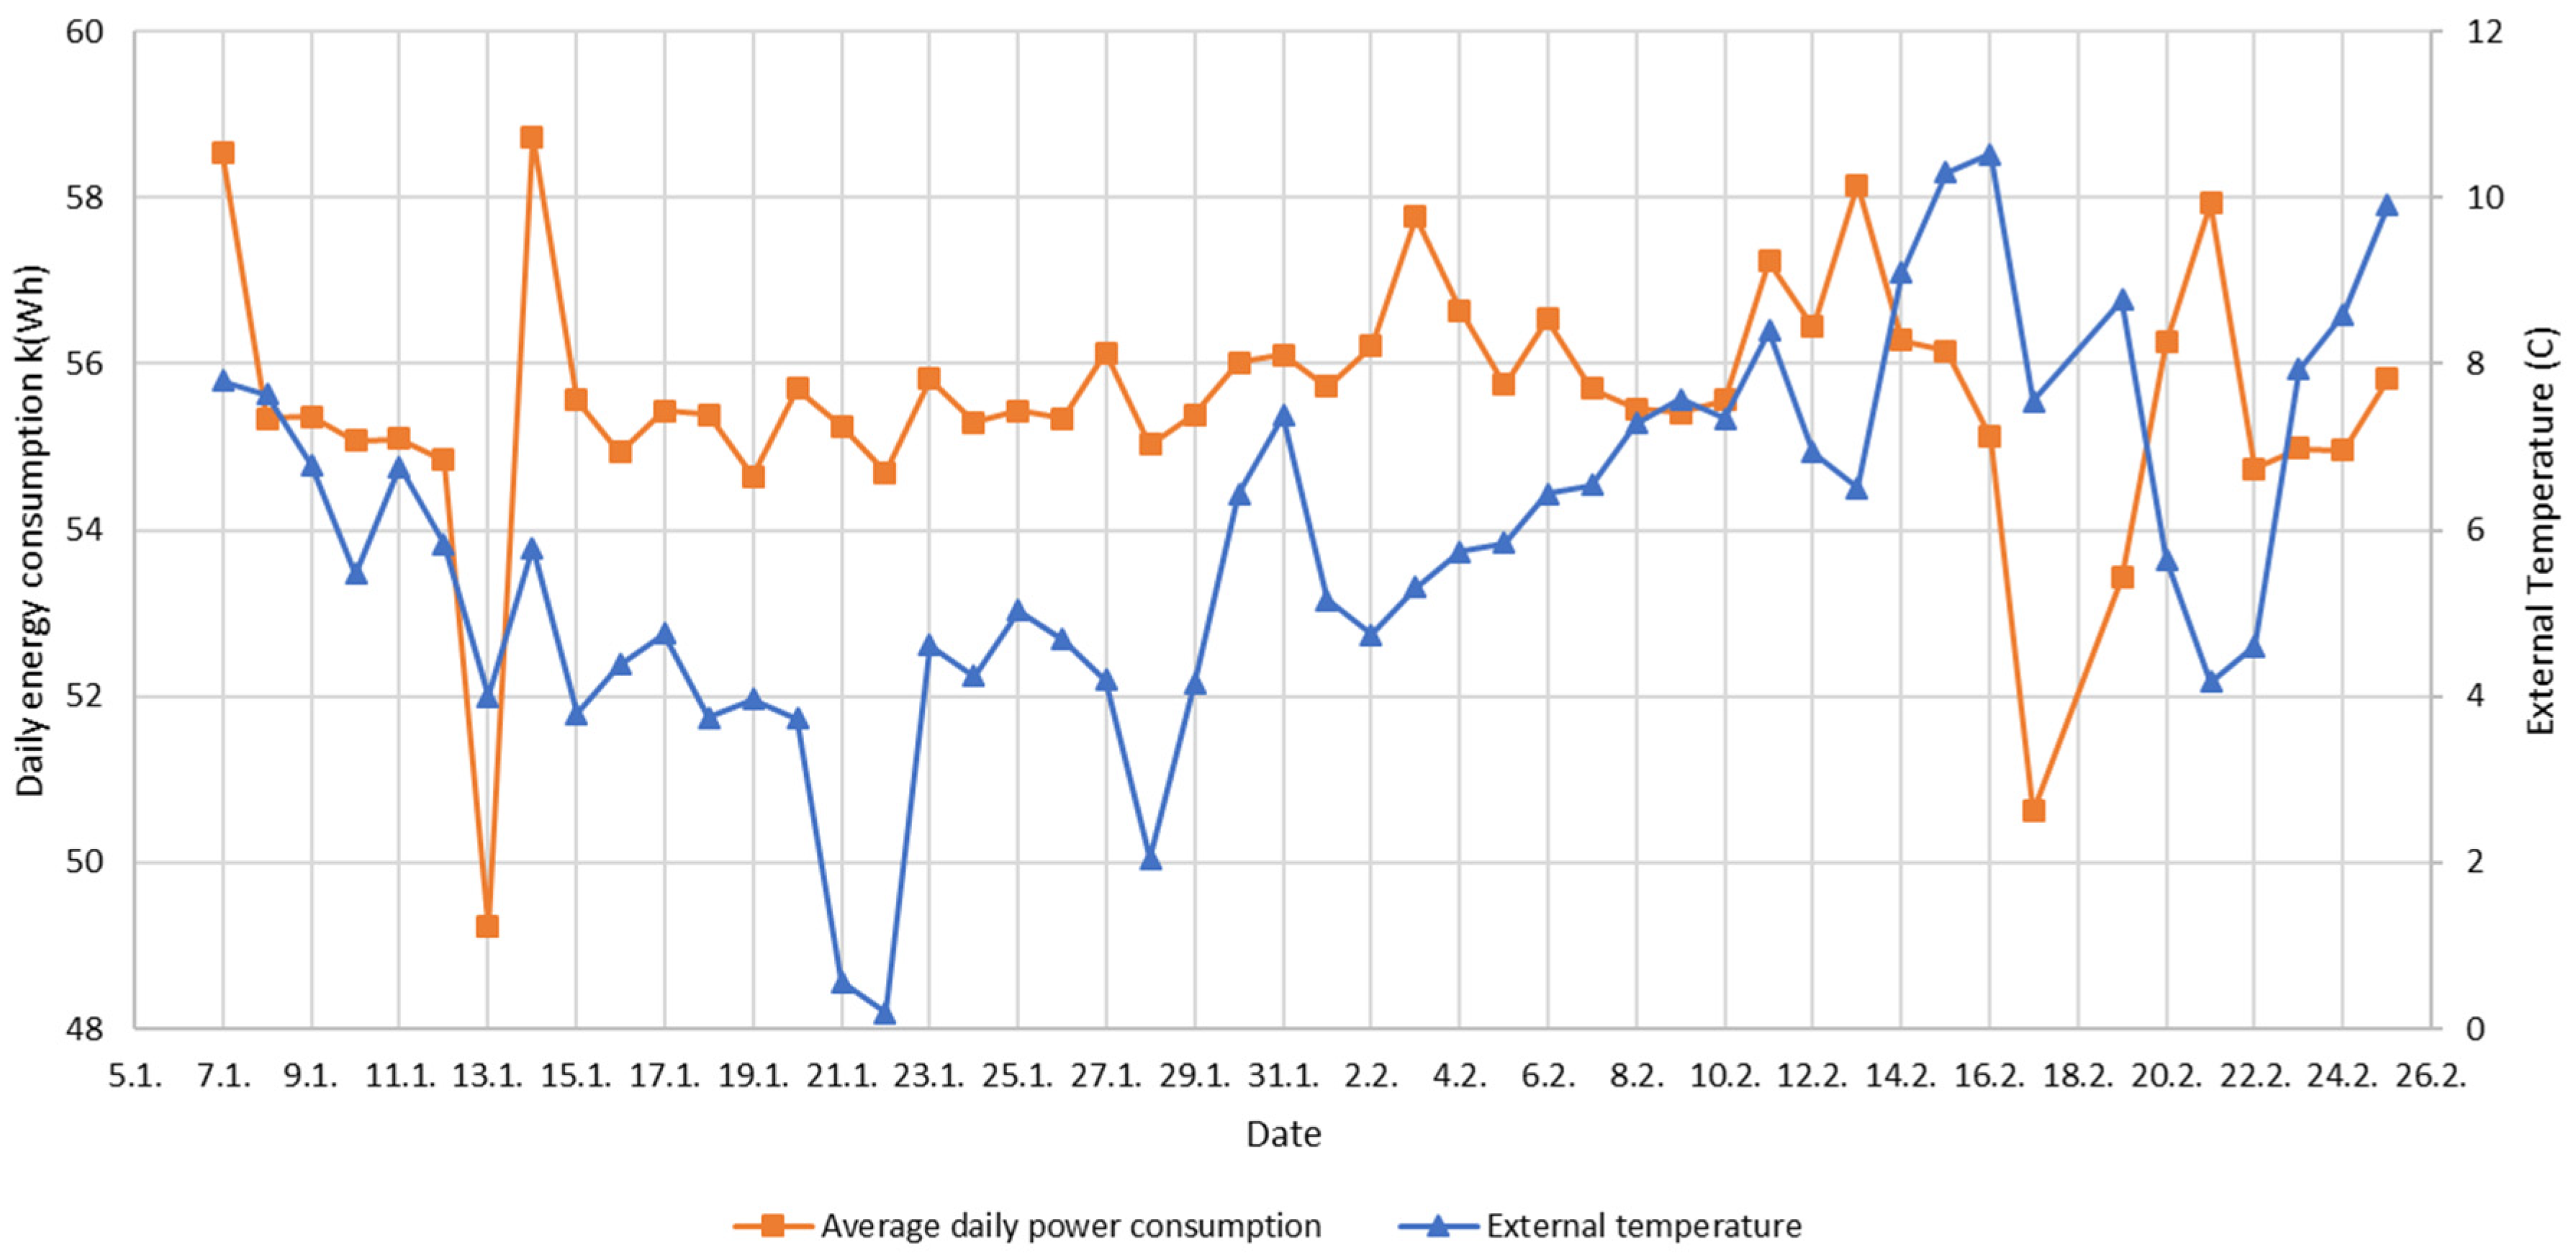
Daily energy consumption of the BTS and site room fans with external temperature are presented in
Figure 5.
There is no clear trend in
Figure 5 between the power consumption and external temperature, which was expected due to low power consumption for the cooling.
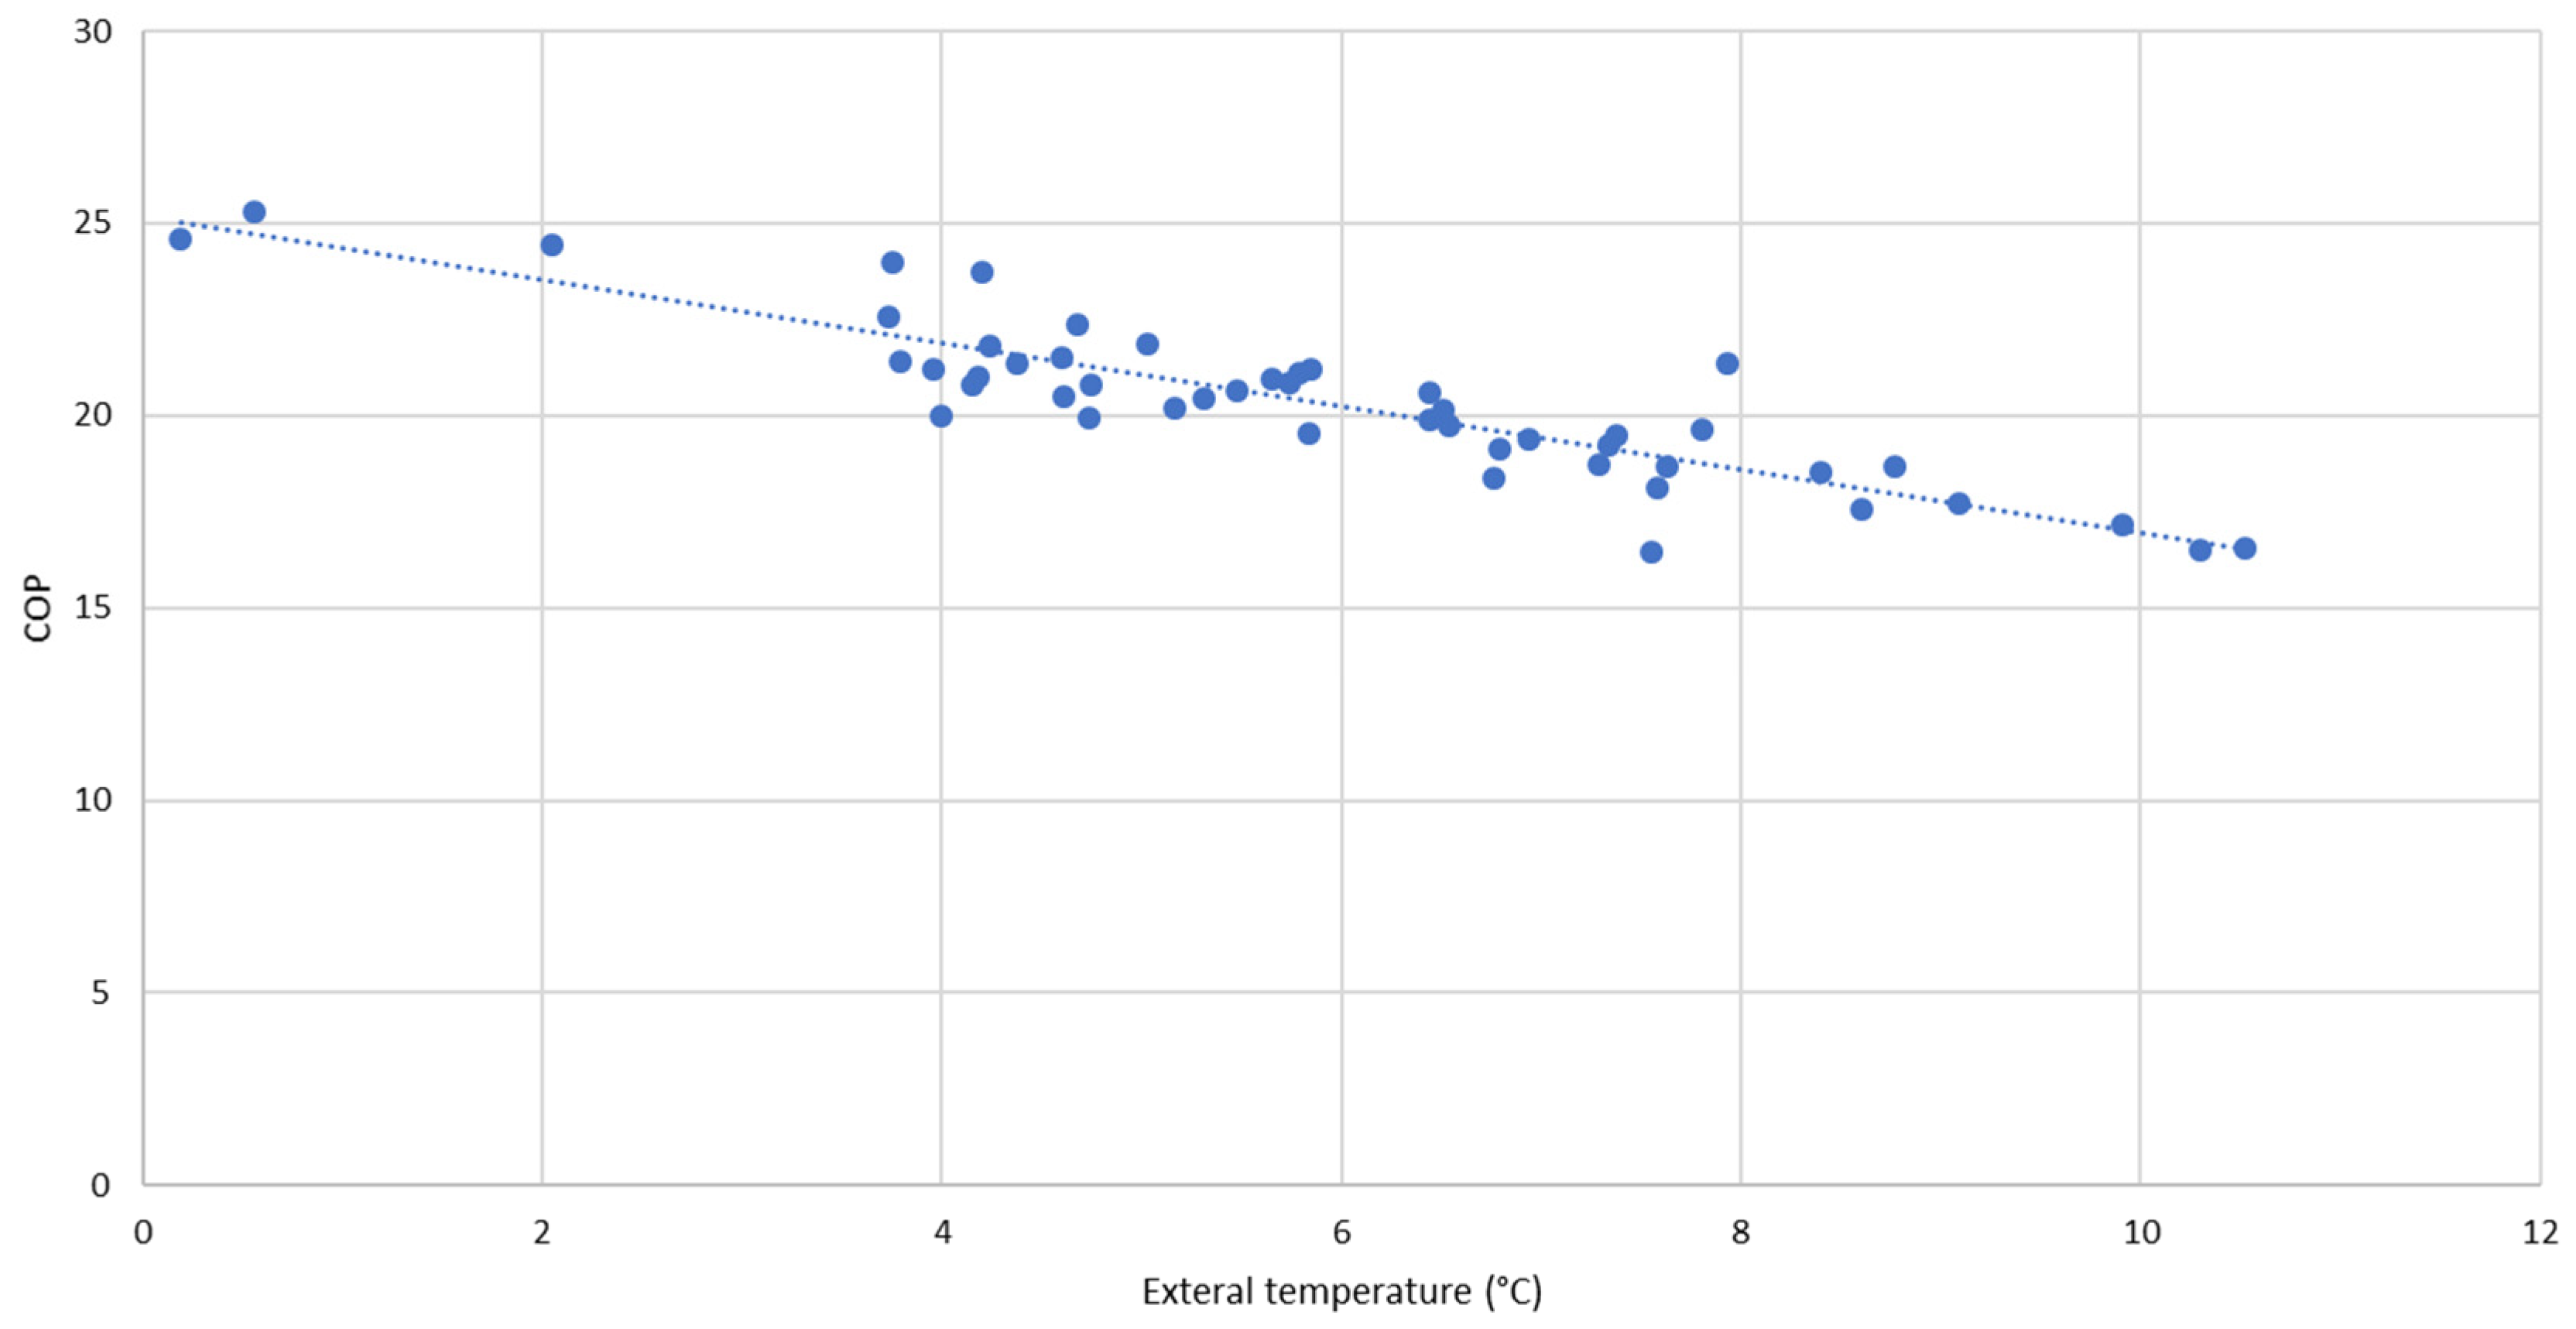
In
Figure 6, the relationship between the calculated daily COP points and external temperature is presented.
In the trendline presented in
Figure 6, the correlation between the COP and external temperature is visible and matches the expectations.
The annual energy consumption of cooling for a BTS consuming 2.3 kW is estimated in
Table 1 for air and liquid cooling systems using the average COP value.
Using the cooling energy consumptions from
Table 1, the energy saving of liquid cooling is 75% compared to air cooling for the same BTS load.
4. Discussion
The energy efficiency of liquid cooling was proven to be better than that of air cooling. COP in same external temperature was three times higher for the liquid cooling than air cooling. This level of energy saving and the reduction in CO
2 emissions plays a significant role when scaled to the entire network level, with thousands of BTS sites per CSP. A calculated cooling energy saving of 75% represents 10% total energy savings at the site level. In addition to savings, 76% of the consumed energy on site was turned to heat that can be utilized, which can reduce the total net energy consumption on the site by 79%. For comparison, this amount of reusable energy, 15940 kWh, provides annual heating energy to living spaces of 245 m
3 to 354 m
3 in block houses, based on a heat index in the Helsinki area in Finland [
7].
Site arrangements, together with monitoring limitations on the live BTS site, caused some challenges that did not allow for the full potential of the liquid cooling. The heat exchanger concept was not optimal, because the airflow through the heat exchanger was not continuous but driven by the room internal temperature. Secondly, the site room fan setting was not changed for liquid cooling, and thus it operated more than needed. Finally, pumps were operated with a constant speed, although they could have been controlled to lower power from time to time depending on the BTS and site room temperature.
For the air cooling measurements, the assumption that the site room fan ran continuously was wrong; calculated COP showed an increasing trend for increasing external temperature, opposite to what was expected. However, it also appeared that COP flattened out to level five on higher ambience, which represented continuous fan operation. Thus, the initial assumption did not have a major impact on the final results.
5. Conclusions
Significant savings in energy consumption were achieved in the world’s first commercial liquid-cooled BTS, resulting in a 75% reduction in cooling energy need, which represents a 10% saving in total energy consumption at the site level.
In future studies, the control of liquid cooling will be designed more precisely with a focus on further energy savings. Secondly, there is a plan to utilize the wasted energy for the heating of the building or utility water locally. This would multiply the savings, due to energy saved in cooling and the utilization of the dissipated BTS heat.
Author Contributions
Conceptualization, J.H., T.V. and O.S.; methodology, J.H.; formal analysis, J.H.; investigation, J.H., T.V. and O.S.; writing—original draft preparation, J.H.; writing—review and editing, J.H., O.S., T.V. and E.P.; visualization, J.H.; supervision, E.P. and O.S.; project administration, O.S. All authors have read and agreed to the published version of the manuscript.
Funding
This research received no external funding, but it has been conducted as a normal business relationship between the Elisa Oyj and Nokia Oyj.
Acknowledgments
We want to thank Franz Card for his contribution to instrumentation and collecting of the data from the site.
Conflicts of Interest
The authors declare no conflict of interest.
References
- Gati, A.; Martinez-Lopez, S.; En-Najjary, T. Impact of traffic growth on energy consumption of LTE networks between 2010 and 2020. In Proceedings of the 2014 IEEE Wireless Communications and Networking Conference Workshops (WCNCW), Istanbul, Turkey, 6–9 April 2014; pp. 150–154. [Google Scholar] [CrossRef]
- Chan, C.A.; Gygax, A.F.; Leckie, C.; Wong, E.; Nirmalathas, A.; Hinton, K. Telecommunications energy and greenhouse gas emissions management for future network growth. Appl. Energy 2016, 166, 174–185. [Google Scholar] [CrossRef]
- Zhang, X.; Lindberg, T.; Svensson, K.; Vyatkin, V. Power Consumption Modeling of Data Center IT Room with Distributed Air Flow. Int. J. Model. Optim. 2016, 6, 33–38. [Google Scholar] [CrossRef]
- Nortershauser, D.; Le Masson, S.; Volkov, T.; Galkin, T.; Amper, O.; Huttunen, J. Experimental liquid cooled base station. In Proceedings of the 2016 IEEE International Telecommunications Energy Conference (INTELEC), Austin, TX, USA, 23–27 October 2016; pp. 1–7. [Google Scholar] [CrossRef]
- EBMPapst, Axial Compact Fans. Available online: https://www.ebmpapst.com/en/products/compact-fans/axial-compact-fans/axial_compact_fans_detail.php?pID=54020 (accessed on 26 May 2020).
- Grundfos, Alpha 2 Electronically Controlled Circulator Pump. Available online: https://product-selection.grundfos.com/catalogue.product%20families.q%26h%20alpha2.html?custid=GMA1&familycode=ALPHA2&flow=0&head=0&lang=ENU&time=1548415886112&qcid=502070746 (accessed on 26 May 2020).
- Lämmitysenergiankulutus. Available online: https://www.motiva.fi/koti_ja_asuminen/taloyhtiot/energiaeksperttitoiminta/tietoa_energian-_ja_vedenkulutuksesta/lammitysenergiankulutus (accessed on 27 May 2020).
| Publisher’s Note: MDPI stays neutral with regard to jurisdictional claims in published maps and institutional affiliations. |
© 2020 by the authors. Licensee MDPI, Basel, Switzerland. This article is an open access article distributed under the terms and conditions of the Creative Commons Attribution (CC BY) license (https://creativecommons.org/licenses/by/4.0/).


