Analysis of Three Small-Scale Photovoltaic Systems Based on Simulation and Measurement Data †


Abstract
:1. Introduction
2. Materials
- PV1—photovoltaic installation with a rated peak power of 3 kWp; the PV generator is located on the roof of a building. It consists of 12 modules arranged in two rows and optimally mounted, i.e., the object facing south (azimuth 180°), the tilt angle is 38°. The modules are connected to the SMA SUNNY BOY 3000 HF inverter with a maximum power of 3.15 kWp DC;
- PV2a—photovoltaic installation with a rated peak power of 1.5 kWp. It is located on the south-eastern facade of the building. It consists of six modules. Their azimuth is 160°, the tilt angle is 90°. The modules are connected to the GoodWe NS-1500 inverter with a maximum power of 1.8 kWp DC.
- PV2b—photovoltaic installation with a peak power rating of 1.5 kWp, which, like the PV2a installation, consists of 6 modules connected to the GoodWe NS-1500 inverter with a maximum power of 1.8 kWp DC. However, its location is different, as the PV generator is mounted on the south-west facade of the building. The azimuth is 250°, the tilt angle is 90°.
3. Methods
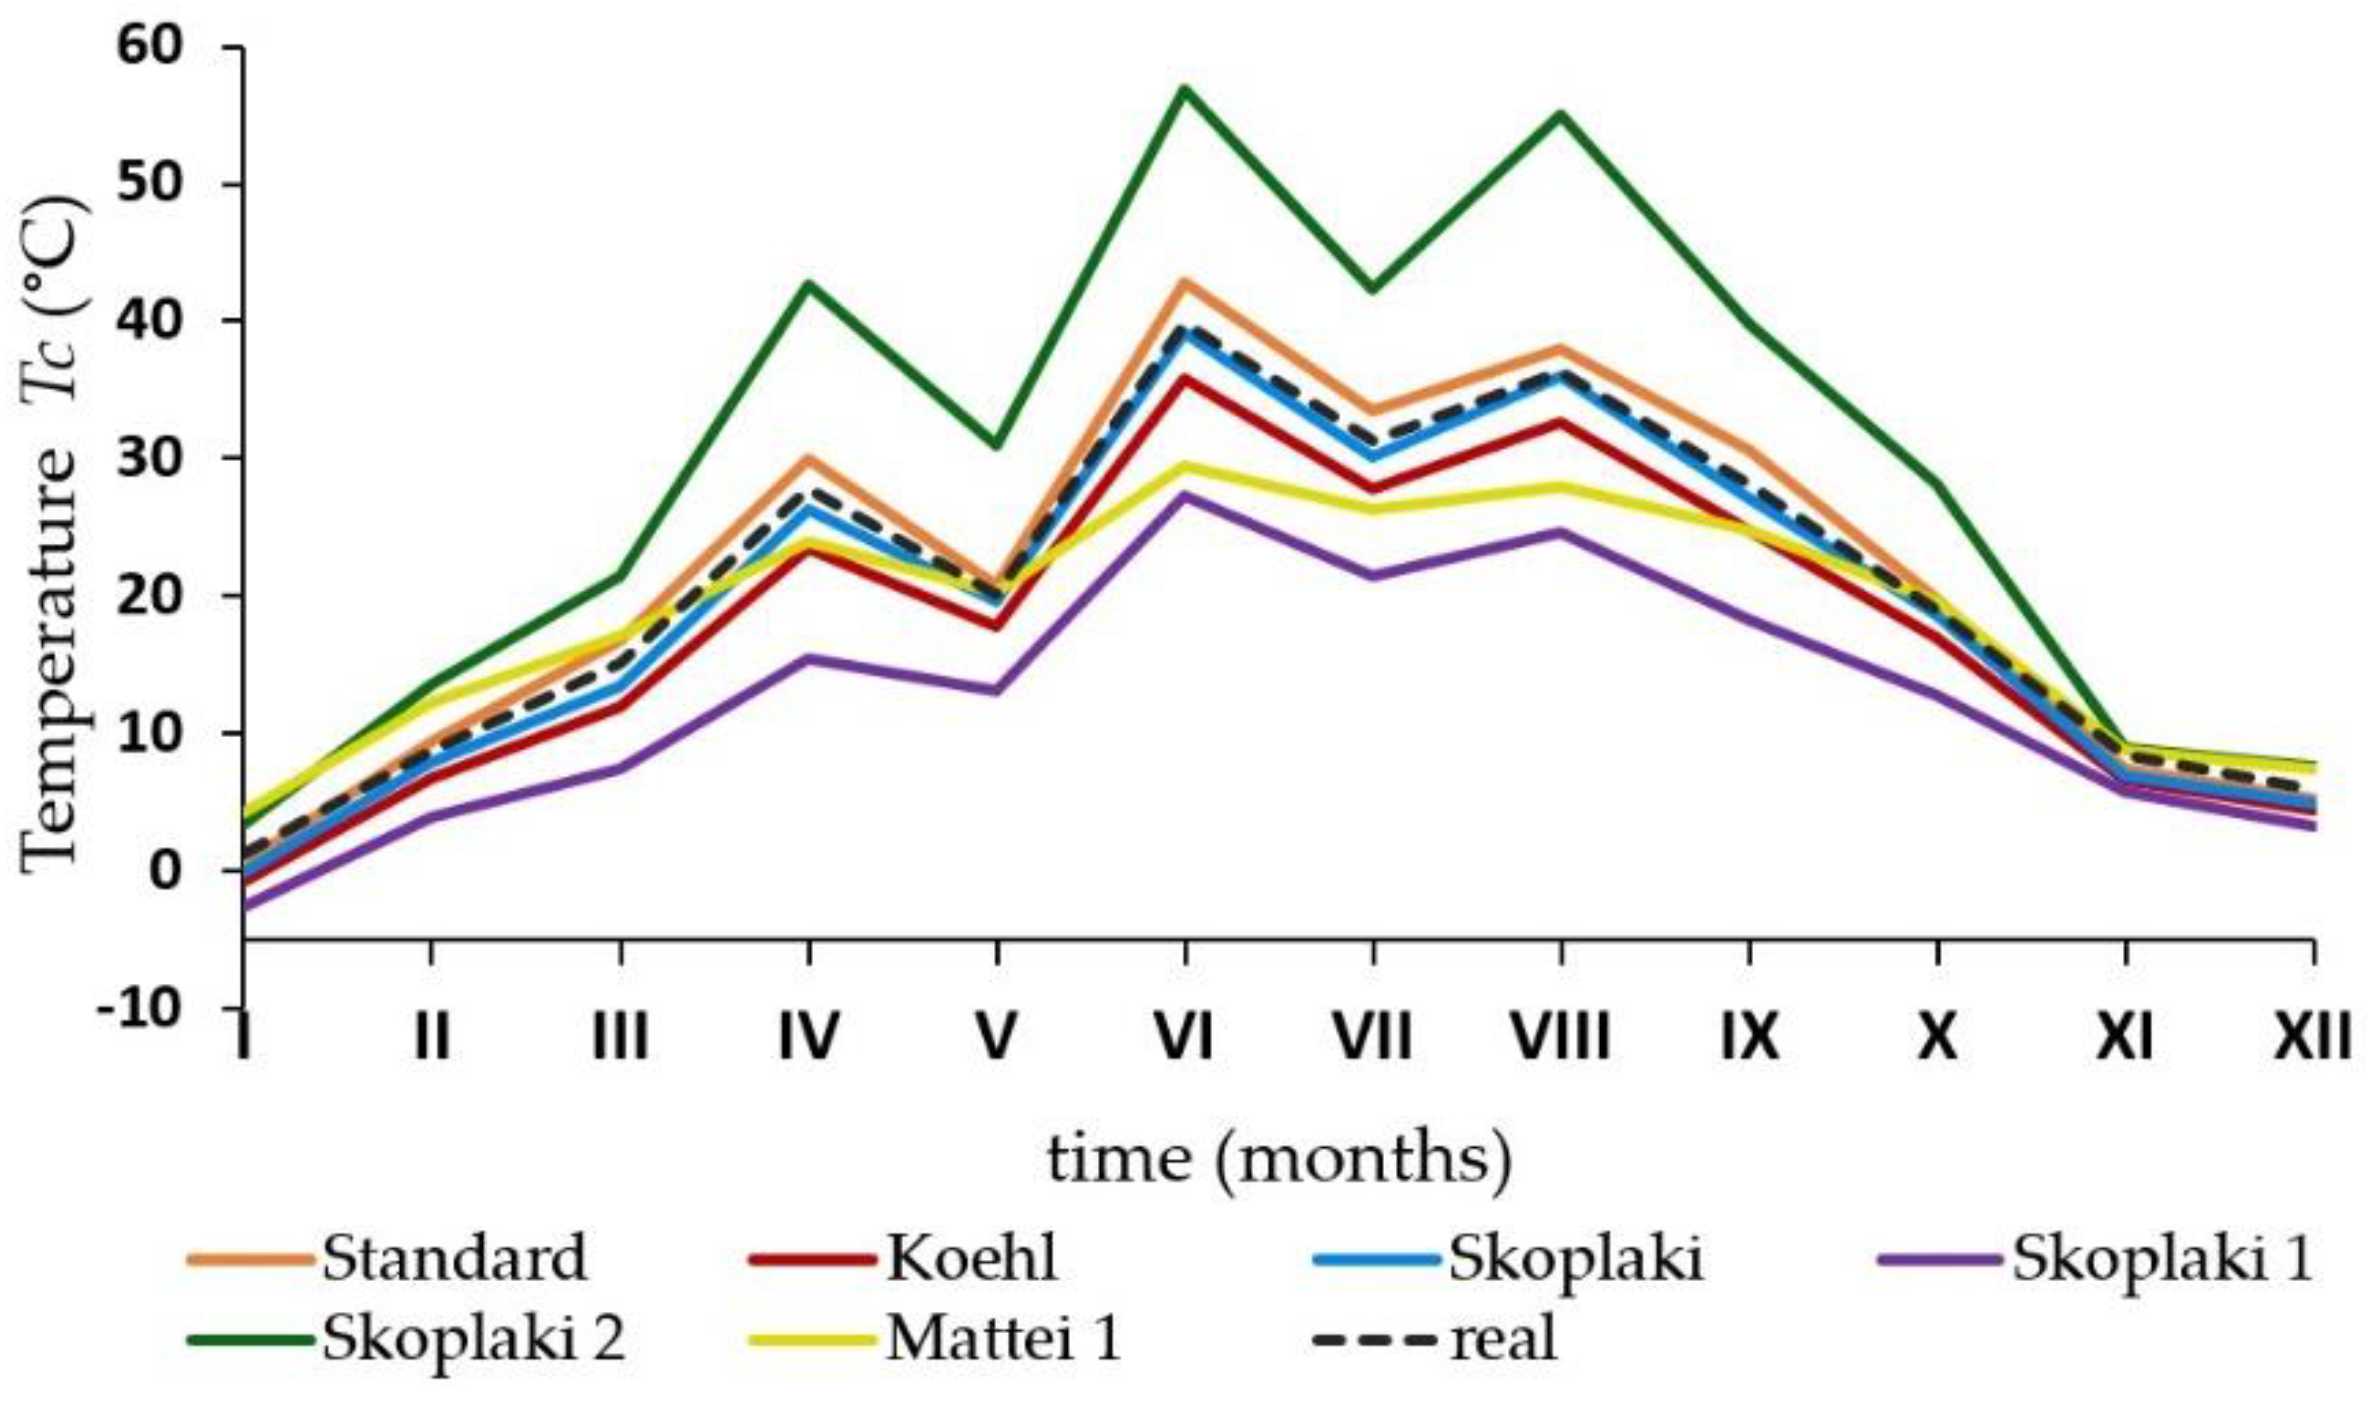
- King model—developed at Sandia National Laboratory [11], taking into account the coefficients associated with the thermal radiation of the module and its cooling by wind measured at a height of 10 m;
- Skoplaki models—two formulas for estimating the module operating temperature [12]. In addition to the atmospheric conditions, the first model (called as Skoplaki) includes various types of solar panel systems assembly, while the second model (Skoplaki 1, Skoplaki 2, Skoplaki 3) contains specific solar cell properties, such as efficiency, temperature power factor as well as transmission and absorption coefficients. The following wind parameters are used: wind speed at a height of 10 m (Skoplaki 1); the local wind speed close to the PV module (Skoplaki, Skoplaki 2); wind speed in directions that are perpendicular and parallel to the module’s surface (Skoplaki 3).
- Faiman model—it contains coefficients, proposed by Koehl, describing the effect of the radiation on the module temperature and the effect of cooling by the wind [13];
- Mattei models—two formulas depending on the method of determining the heat exchange coefficient. Wind speed measured close to the module is a parameter [7].
4. Results
5. Conclusions
Author Contributions
Funding
Conflicts of Interest
References
- Markvart, T. Solar Electricity, 2nd ed.; Wiley: Chichester, UK, 2000. [Google Scholar]
- Petrone, G.; Ramos-Paja, C.A.; Spagnuolo, G. Photovoltaic Sources Modeling; Wiley-IEEE Press: Chichester, UK, 2017. [Google Scholar]
- Xiao, W. Photovoltaic Power System: Modeling, Design, and Control; Wiley: Chichester, UK, 2017. [Google Scholar]
- Gokmen, N.; Hu, W.H.; Hou, P.; Chen, Z.; Sera, D.; Spataru, S. Investigation of wind speed cooling effect on PV panels in windy locations. Renew. Energy 2016, 90, 283–290. [Google Scholar] [CrossRef]
- Nkurikiyimfura, I.; Safari, B.; Nshingabigwi, E. A Simulink Model of Photovoltaic Modules under Varying Environmental Conditions. IOP Conf. Ser. Earth Environ. Sci. 2018, 159, 012024. [Google Scholar] [CrossRef]
- Perovic, B.; Klimenta, D.; Jevtic, M.; Milovanovic, M.A. Transient Thermal Model for Flat-Plate Photovoltaic Systems and Its Experimental Validation. Elektron. Elektrotechnika 2019, 25, 40–46. [Google Scholar] [CrossRef]
- Schwingshackl, C.; Petitta, M.; Wagner, J.E.; Belluardo, G.; Moser, D.; Castelli, M.; Zebisch, M.; Tetzlaff, A. Wind Effect on PV Module Temperature: Analysis of Different Techniques for an Accurate Estimation. Energy Procedia 2013, 40, 77–86. [Google Scholar] [CrossRef]
- Veldhuis, A.J.; Nobre, A.; Reindl, T.; Ruther, R.; Reinders, A.H.M.E. The influence of wind on the temperature of PV modules in tropical environments, evaluated on an hourly basis. In Proceedings of the 39th IEEE Photovoltaic Specialists Conference (PVSC), Tampa, FL, USA, 16–21 June 2013; pp. 824–829. [Google Scholar]
- Frydrychowicz-Jastrzebska, G.; Bugala, A. Modeling the distribution of solar radiation on a two-axis tracking plane for photovoltaic conversion. Energies 2015, 8, 1025–1041. [Google Scholar] [CrossRef]
- Ruiz, G.R.; Bandera, C.F. Validation of Calibrated Energy Models: Common Errors. Energies 2017, 10, 1587. [Google Scholar] [CrossRef]
- King, D.L.; Boyson, W.E.; Kratochvill, J.A. Photovoltaic Array Performance Model, Sandia National Laboratories. Available online: https://prod-ng.sandia.gov/techlib-noauth/access-control.cgi/2004/043535.pdf (accessed on 1 August 2004).
- Skoplaki, E.; Boudouvis, A.G.; Palyvos, J.A. A simple correlation for the operating temperature of photovoltaic modules of arbitrary mounting. Sol. Energy Mater. Sol. Cells 2008, 92, 1393–1402. [Google Scholar] [CrossRef]
- Koehl, M.; Heck, M.; Wiesmeier, S.; Wirth, J. Modeling of the nominal operating cell temperature based on outdoor weathering. Sol. Energy Mater. Sol. Cells 2011, 95, 1638–1646. [Google Scholar] [CrossRef]
- Sohani, A.; Sayyaadi, H. Providing an accurate method for obtaining the efficiency of a photovoltaic solar module. Renew. Energy 2020, 156, 395–406. [Google Scholar] [CrossRef]


| NRMSE (%) | NMBE (%) | k | NRMSE (%) | NMBE (%) | k | NRMSE (%) | NMBE (%) | k | |
|---|---|---|---|---|---|---|---|---|---|
| Standard | 8.27 | 5.31 | 1.00 | 20.16 | −19.53 | 1.00 | 10.24 | −8.05 | 1.00 |
| Skoplaki | 5.29 | −4.87 | 1.00 | 7.95 | 1.92 | 1.00 | 16.93 | 10.49 | 0.99 |
| Skoplaki 1 | 41.33 | −37.62 | 0.99 | 50.70 | −47.32 | 0.98 | 33.12 | 32.18 | 0.99 |
| Skoplaki 2 | 53.39 | 44.96 | 0.99 | 12.07 | 6.06 | 0.99 | 20.60 | 14.03 | 0.99 |
| Faiman (Koehl) | 14.53 | −13.82 | 1.00 | 33.65 | −31.93 | 1.00 | 19.35 | −18.83 | 1.00 |
| Mattei 1 | 22.72 | −7.92 | 0.98 | 42.98 | −33.49 | 0.98 | 40.48 | −30.07 | 0.95 |
Publisher’s Note: MDPI stays neutral with regard to jurisdictional claims in published maps and institutional affiliations. |
© 2020 by the authors. Licensee MDPI, Basel, Switzerland. This article is an open access article distributed under the terms and conditions of the Creative Commons Attribution (CC BY) license (https://creativecommons.org/licenses/by/4.0/).
Share and Cite
Idzkowski, A.; Karasowska, K.; Walendziuk, W. Analysis of Three Small-Scale Photovoltaic Systems Based on Simulation and Measurement Data. Proceedings 2020, 51, 19. https://doi.org/10.3390/proceedings2020051019
Idzkowski A, Karasowska K, Walendziuk W. Analysis of Three Small-Scale Photovoltaic Systems Based on Simulation and Measurement Data. Proceedings. 2020; 51(1):19. https://doi.org/10.3390/proceedings2020051019
Chicago/Turabian StyleIdzkowski, Adam, Karolina Karasowska, and Wojciech Walendziuk. 2020. "Analysis of Three Small-Scale Photovoltaic Systems Based on Simulation and Measurement Data" Proceedings 51, no. 1: 19. https://doi.org/10.3390/proceedings2020051019
APA StyleIdzkowski, A., Karasowska, K., & Walendziuk, W. (2020). Analysis of Three Small-Scale Photovoltaic Systems Based on Simulation and Measurement Data. Proceedings, 51(1), 19. https://doi.org/10.3390/proceedings2020051019