1. Introduction
As its published by World Health Organization (
WHO) of the 56.9 million deaths worldwide in 2016, light more than a half (54%) were due to the top 10 causes. Ischemic heart disease and stroke are the world’s biggest killers, accounting for a combined 15.2 million deaths in 2016. These diseases have remained the leading causes of death globally in the last 15 years [
1].
The American Heart Association explains that some arrhythmias are so brief (for example, a temporary pause or premature beat) that the overall heart rate or rhythm is not affected at clinical level. However, if arrhythmias last longer, they may cause the heart rate to be too slow or too fast or the heart rhythm to be erratic—so the heart pumps less effectively [
2].
The most important clinical significance of arrhythmias is related to an association with sudden cardiac death (Goldstein et al.; Recommended General Bibliography p. xvii; 1994) [
3]. It is also important to remember that arrhythmias (especially atrial fibrillation) may frequently lead to embolisms, including cerebral emboli, often with severe consequences. Furthermore, it must be remembered that sometimes fast arrhythmias may trigger or worsen a heart failure.
For the analysis of certain time series coming from biomedical signals, such as an electrocardiogram (
ECG) [
4,
5,
6], there is a need to characterize the degree of organization or complexity of it. For this reason, the theory of information and the analysis of dynamics of the systems under study provide a way to obtain relevant results.
In order to analyze these time series, the first step is the computation of the
PDF. For this, Bandt and Pompe [
7] introduced a simple and robust symbolic method that takes into account the time causality connected with the dynamics of the system. Without any kind of assumption of the dynamics originating the signal, the permutation method proposed by Bandt and Pompe for the computation of the probability distribution function allows them to compute the entropy. Adding to the last, the complexity, computed from the Jensen–Shannon information divergence, constitutes the system’s behavior localization in an Entropy–Complexity plane [
8,
9,
10,
11,
12,
13,
14].
As is mentioned in Olivares et al. [
15], the concept of entropy has many interpretations arising from a wide diversity of scientific and technological fields. Among these associations is disorder, with the volume of state space, and with a lack of information too. There are various definitions according to ways of computing this important magnitude to study the dynamics of the systems, and one of the most frequent that could be considered of foundational definition is the denominated Shannon entropy [
16], which can be interpreted as a measure of uncertainty. Shannon entropy can be considered as one of the most representative examples of information quantifiers.
Let an associated continuous Probability Distribution Function (
PDF) be noted by
ρ(x) with
x ∈ Ω ⊂ R, a continuous variable measured, and
; then its associated
Shannon Entropy S[ρ] is defined by [
17] as:
This concept allows for a global measure of the information contained in the time series; it has a low degree of sensitivity to strong changes in the distribution originating from a small-sized region of the set Ω.
For a time series
X(
t)≡{
xt; t = 1, …,
M}, a set of
M measures of the observable
X and the associated
PDF, given by
P = {
pi; i = 1, …,
N}, with
, and
N as the number of possible states of the system under study, the
Shannon entropy [
17] is defined in (2).
Equation (2) constitutes a function of the probability P = {pi; i = 1, …, N}, which is equal to zero when the outcomes of a certain experiment denoted by the index k associated with probabilities pk ≈ 1 will occur. Therefore, the known dynamics developed by the dynamical system under study are complete. If the knowledge of the system dynamics is minimal, all the states of the system can occur with equal probability; thus, this probability can be modeled by a uniform distribution Pe = {pi = 1/N; ∀i = 1, …, N}.
It is useful to define the so-called normalized Shannon entropy, denoted as
H[P], the expression of which is (3):
Another information quantifier applied in this work was the
Statistical Complexity Measure (
SCM) which is a global informational quantifier. All the computations made in the present work were done with the definitions introduced in [
18] and improved by [
19]. For a discrete probability distribution function
P = {
pi; i = 1, …,
N}, associated with a time series, this functional
C[P] is given by (4).
where
H denotes the amount of “disorder” given by the normalized Shannon entropy (3) and
QJ is called “disequilibrium”, defined in terms of the Jensen–Shannon divergence, given by (5).
and
Q0 denotes the normalization condition for the disequilibrium which corresponds to the inverse of the maximum possible value of Jensen–Shannon divergence, that is
.
The C[P] quantifies the existence of correlational structures giving a measure of the complexity of a time series. In cases of, in perfect order or total randomness, a signal coming of a dynamical system, the value of the C[P] is identically null that means the signal possesses no structure. Between these two extreme instances, a large range of possible stages of physical structure may be realized using a dynamical system. These stages should be reflected in the features of the obtained PDF and quantified by a no-null C[P].
The global character of the
SCM is due to the fact that its value does not change with different orderings computed by the
PDF. Therefore, the
C[P] quantifies the disorder, but also the degree of correlational structures. Given that the statistical complexity does not only quantify randomness but also the degree of correlation between structures; consequently, it is not a trivial function of entropy—in the sense that, for a given value of
H, there is a range of possible values for
C between a minimum value
Cmin and a maximum value
Cmax [
20].
Once evaluated, the Shannon’s entropy and the statistical complexity, the results can be displayed in the HxC plane (global quantifier) with the objective to discriminate between the ECG coming from an arrhythmic diagnosed patient and that from a patient with normal sinus rhythms.
In general terms, these characterization methods have shown to be efficient in distinguishing between stochastic nature and deterministic chaos in different groups of time series, because it displays typical and specific features associated with its dynamics’ nature [
21].
2. Results and Discussion
The groups of time series analyzed in this work were obtained from the PhysioNet [
22] platform (managed by members of the Computational Physiology Laboratory of the M.I.T., Massachusetts Institute of Technology), which are available at
https://physionet.org/.
As is shown in the
Table 1, the registry of patients with normal sinus rhythms is made up of eighteen
ECG recordings registered at the Beth Israel Deaconess Medical Center. On the other hand, the registry of patients with cardiac arrhythmias is made up of forty-seven
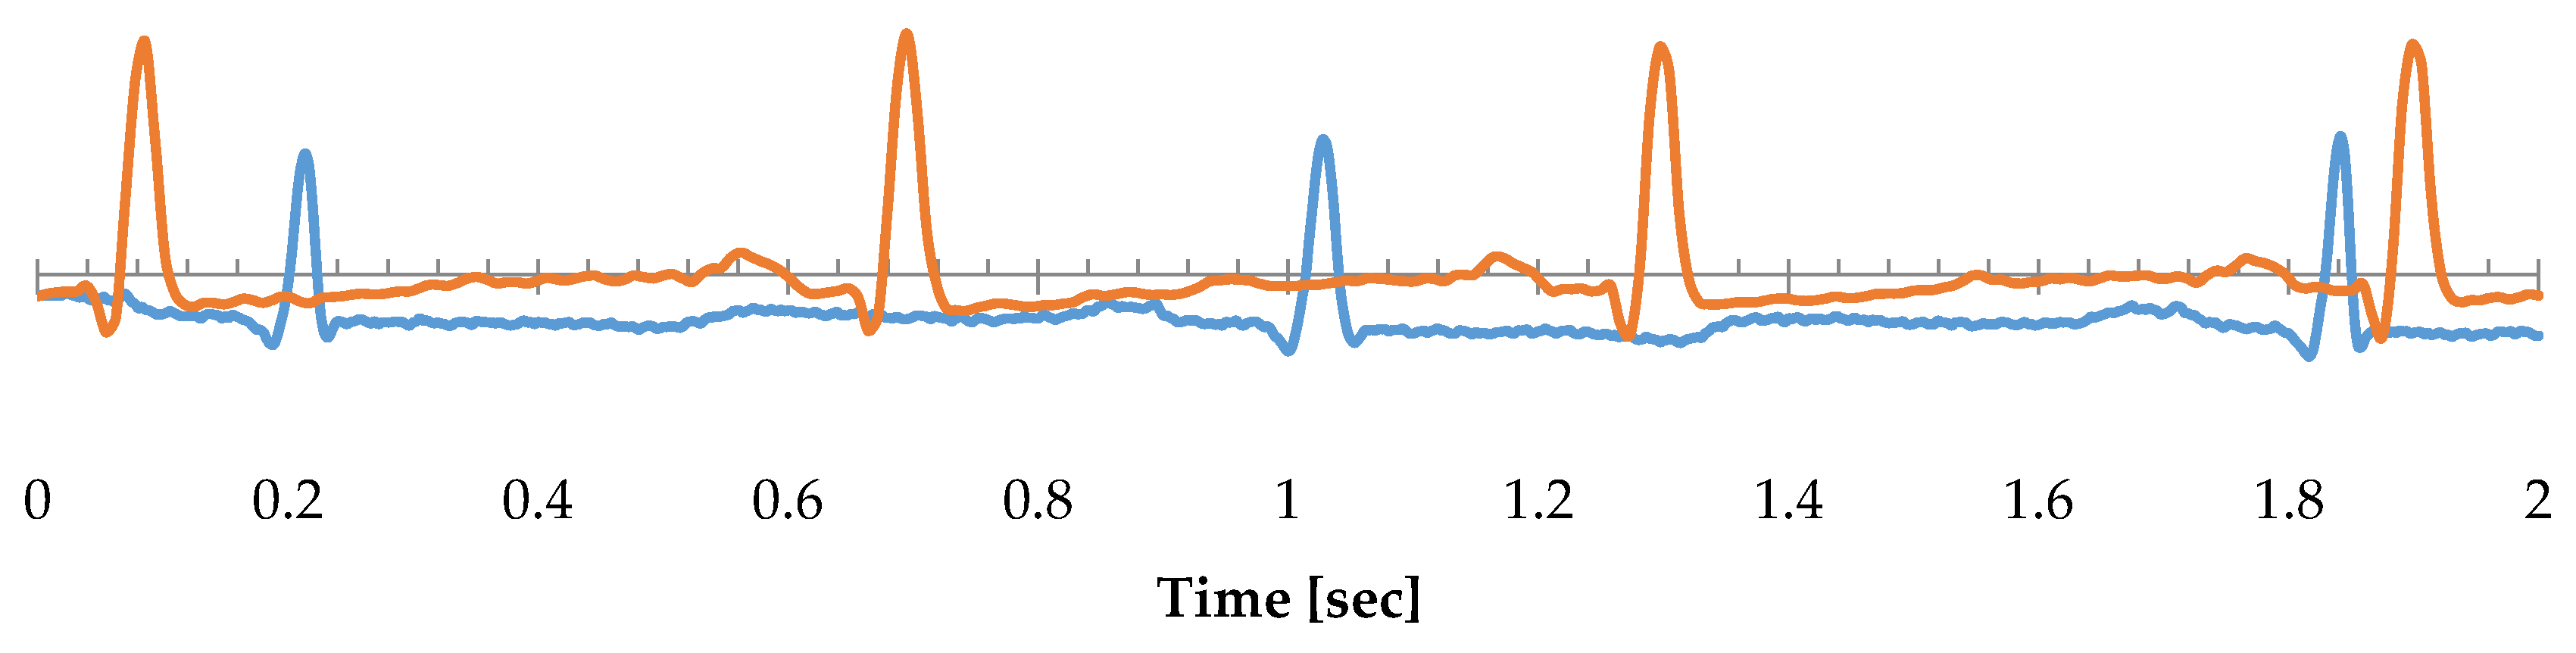
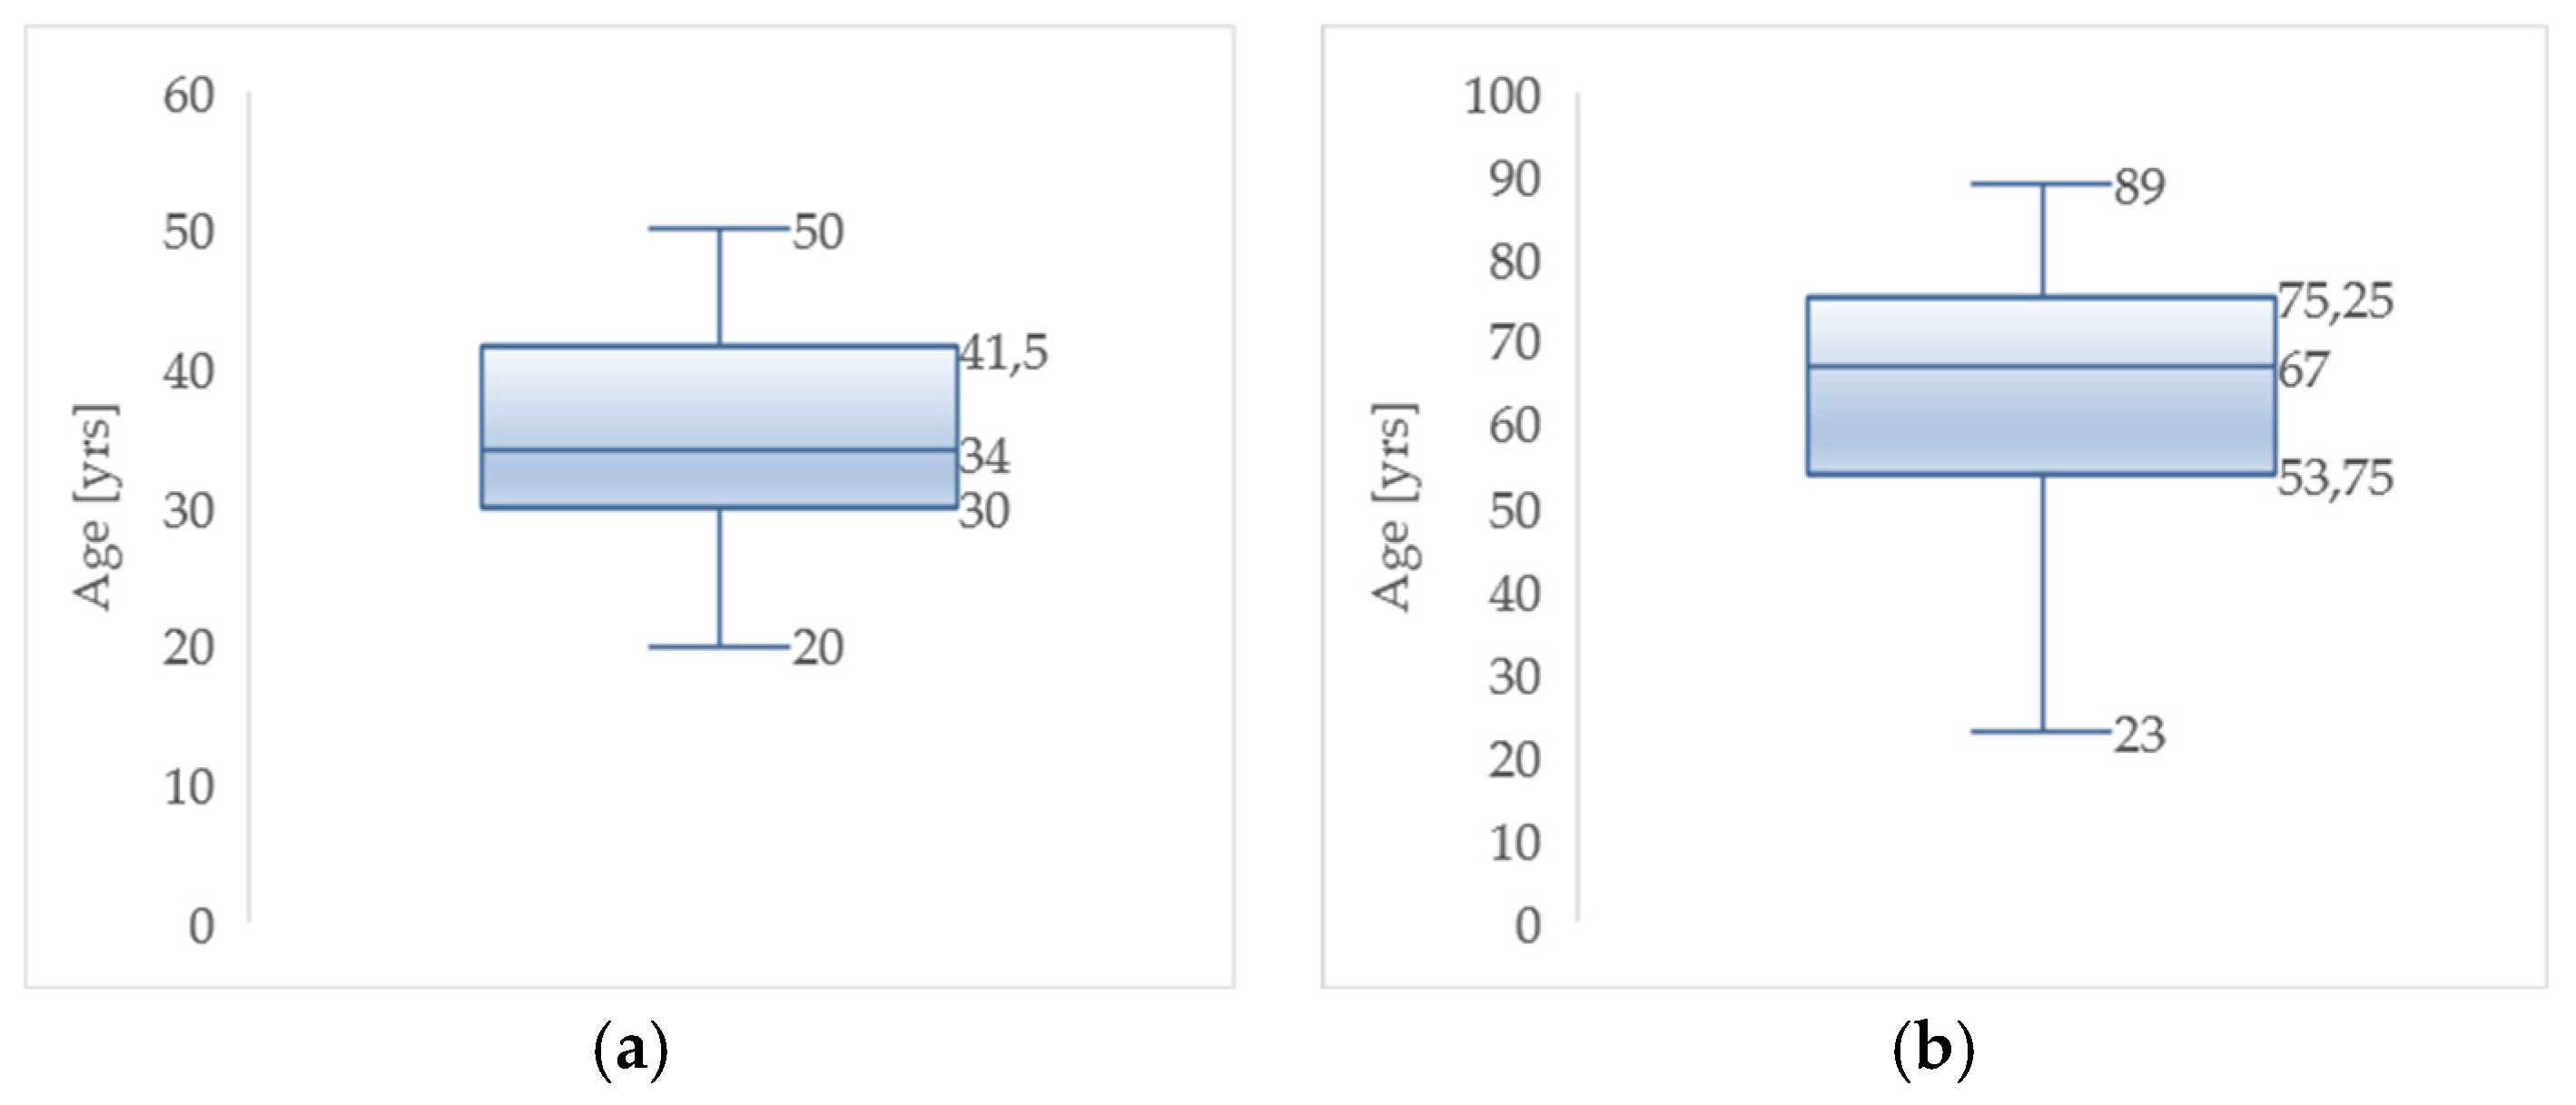
ECG recordings, where twenty-five of them were taking Digoxin, a medication that is used to treat heart failure and certain types of irregular heartbeat, such as chronic atrial fibrillation. Likewise, an example of a normal sinus rhythm and a cardiac arrhythmia recording are represented in
Figure 1, and the age distribution of each group of patients is shown in
Figure 2.
Several computational codes were developed to evaluate the values of statistical complexity C and the normalized Shannon entropy H for each of the time series. Mean values of each pair of those calculations were represented in the HxC plane; where the statistical complexity was represented on Y-axis, and the normalized Shannon entropy was represented on the X-axis.
Table 2,
Table 3,
Table 4,
Table 5,
Table 6 and
Table 7 are the summary of different comparisons of mean values, standard deviation, and the mean error of statistical complexity and the normalized Shannon entropy of the records under analysis.
3. Conclusions
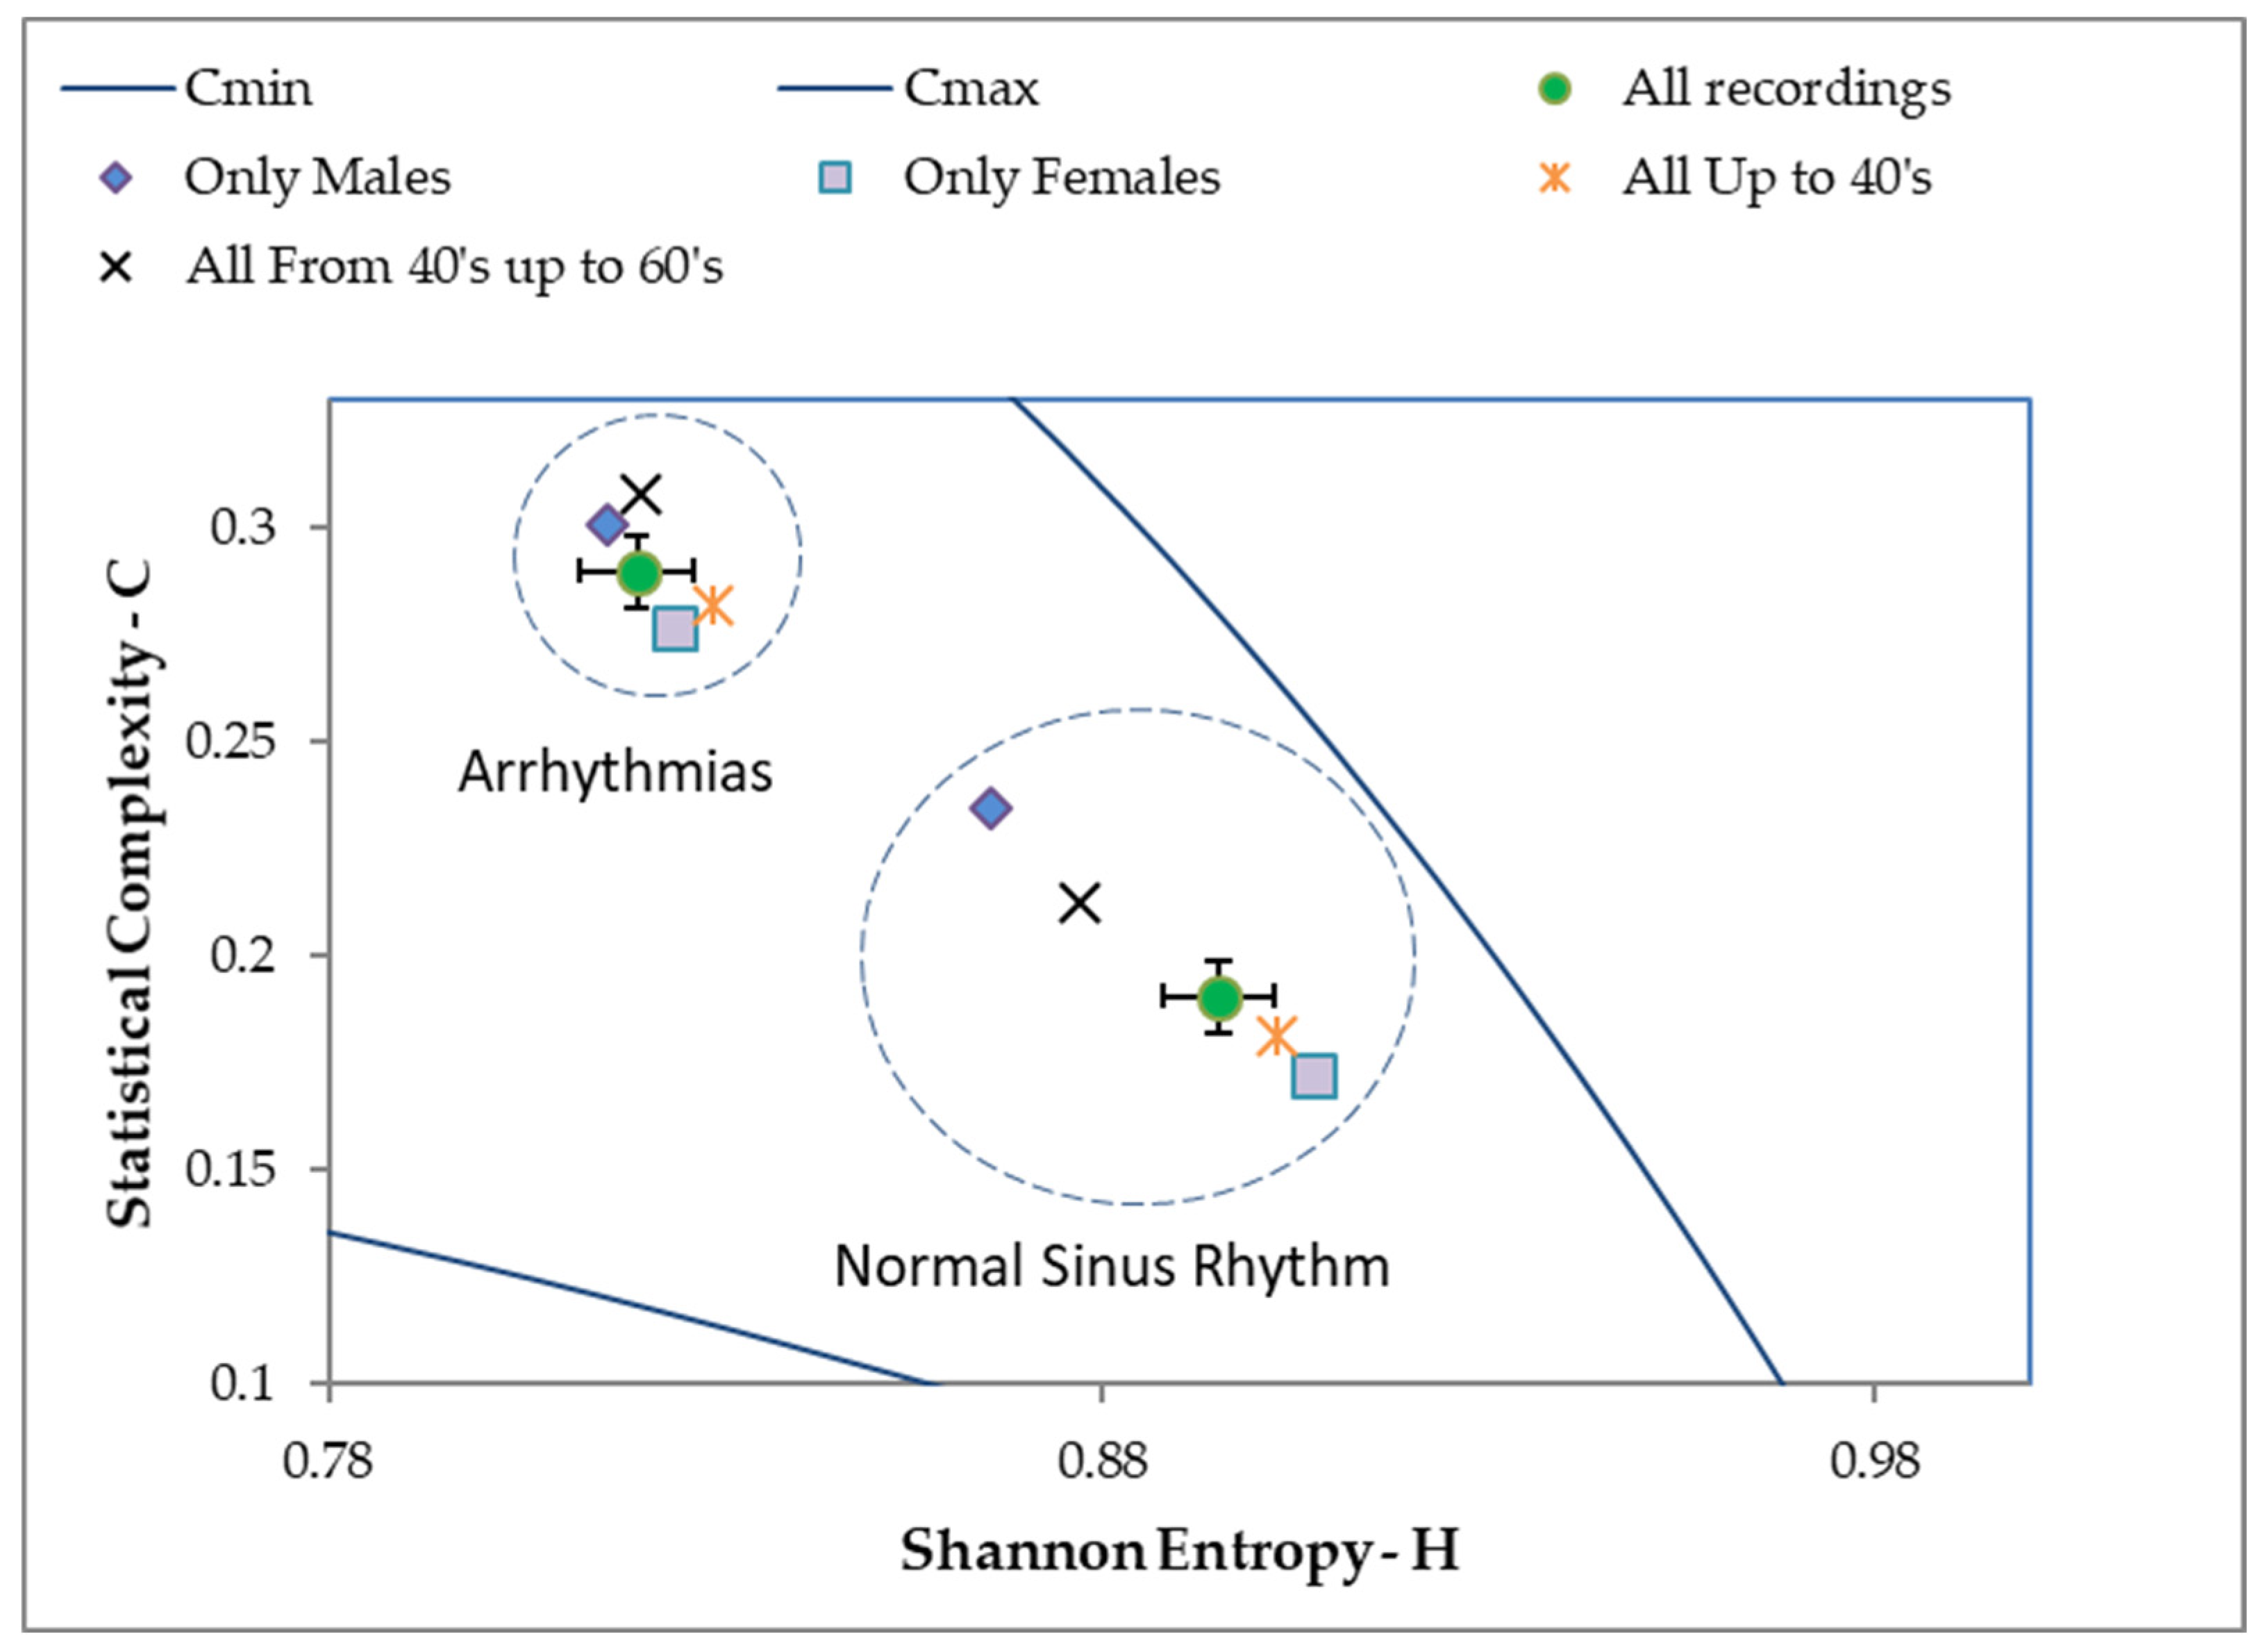
As is shown in
Figure 4, the average values of statistical complexity obtained for the group of patients with arrhythmias were higher than those of the normal heart rate group. On the other hand, the average values of normalized Shannon Entropy for the group of patients with arrhythmias were smaller than those of the normal heart rate group. The combination of the above characteristics allowed us to discriminate the mean values of both groups of patients in the
HxC plane. The difference between the two groups of interest was analyzed through multivariate statistical tests (Royston and Hotelling tests for samples of different sizes and with binormal distribution [
23]). See
Table 8 and
Table 9.
According to values shown in
Table 8, both groups of interest have a binormal distribution.
From the values obtained from previous multivariate statistical tests, the hypothesis that the mean values of both groups of interest in the HxC plane are different was accepted.
This shows that the signals from patients with normal
ECGs have less statistical complexity in their waveform, measured from the divergence of the information of Jensen–Shannon and higher entropy values. This result confirms, as shown in the literature [
24], that a normal
ECG would be closer to the regions of the entropy complexity plane that usually brings together the dynamic systems called dissipative (by decreasing their n-dimensional volume in the phase space), and that they comprise the systems that develop deterministic chaos (characteristic of the control system of a healthy heart), while an
ECG from a patient with arrhythmia is located in a region of the
HxC plane that characterizes the so-called k-noise [
21] and fractional Brownian motion. This last result indicates that cardiac arrhythmia could occur due to the loss of non-linear control (with the development of deterministic chaos behavior) in the heart, giving way to more disorderly (random) dynamics—typical of the pathology.
As seen in
Table 7, referring to the use of Digoxin, the mean values for complexity and entropy are quite similar, which could be interpreted as showing that the information contained in the time series of the
ECG does not allow the rejection of hypotheses of different means between the interest groups necessary to study the possible impact of the medication effects.
With the results obtained, an objective interpretation of cardiac pathology can be made from the informational measures (complexity and entropy) when they are used together, forming what has been agreed to be called the HxC plane—explaining part of the disease process in itself.
The representation in the HxC plane is a very useful method for the analysis of signals from the ECG of patients with this kind of pathology, providing an efficient way to make a statistical and deterministic analysis. Finally, the proposed methodology has a remarkable conceptual simplicity and shows a promising efficacy in the detection of cardiovascular pathologies.


