Proceeding Paper

The Potential of L-Band UAVSAR Data for the Extraction of Mangrove Land Cover Using Entropy and Anisotropy Based Classification †

1
Photogrammetry and Remote Sensing Department, Indian Institute of Remote Sensing, 4, Kalidas Road, Dehradun 248001, India
2
Geoscience Department, Indian Institute of Remote Sensing, 4-Kalidas Road, Dehradun 248001, India
*
Author to whom correspondence should be addressed.
Presented at the 5th International Electronic Conference on Entropy and Its Applications, 18–30 November 2019; Available online: https://ecea-5.sciforum.net/.
Proceedings 2020, 46(1), 21; https://doi.org/10.3390/ecea-5-06673
Published: 17 November 2019

Abstract

:
Mangrove forests serve as an ecosystem stabilizer since they play an important role in providing habitats for many terrestrial and aquatic species along with a huge capability of carbon sequestration and absorbing greenhouse gases. The process of conversion of carbon dioxide into biomass is very rapid in mangrove forests. Mangroves play a crucial role in protecting the human settlement and arresting shoreline erosion by reducing wave height to a great extent, as they form a natural barricade against high sea tides and windstorms. In most cases, human settlement in the vicinity of mangrove forests has affected the eco-system of the forest and placed them under environmental pressure. Since, a continuous mapping, monitoring, and preservation of coastal mangroves may help in climate resilience, a mangrove land cover extraction method using remotely sensed L-band full-pol UAVSAR data (acquired on 25 February 2016) based on Entropy (H) and Anisotropy (A) concepts has therefore been proposed in this study. The k-Mean clustering has been applied to the subsetted (1-Entropy) * (Anisotropy) image generated by PolSARpro_v5.0 software’s H/A/Alpha Decomposition. The mangrove land cover of the study area was extracted to be 116.07 Km2 using k-Mean clustering and validated with the mangrove land cover area provided by Global Mangrove Watch (GMW) data.

1. Introduction

Tropical forests are of great importance in terms of balancing the eco-system by storing carbon content in the form of bio-mass, thereby regulating water and climate change. Mangrove forests serve as an ecosystem stabilizer, since they play an important role in providing habitats for many terrestrial and aquatic species, along with a huge capability of carbon sequestration and absorbing greenhouse gases [1,2]. The process of conversion of carbon dioxide into biomass is very rapid in mangrove forests [3]. Mangroves play a crucial role in protecting the human settlement and arresting shoreline erosion by reducing wave height to a great extent, as they form a natural barricade against high sea tides and windstorms [4]. In most cases, human settlement in the vicinity of mangrove forests has affected the eco-system of the forest and placed them under environmental pressure [5]. Because of the need for continuous mapping, monitoring, and preservation of the coastal mangroves, several mapping and bio-mass estimation remote sensing techniques such as polarimetric synthetic aperture radar (SAR) interferometry (Pol-InSAR), tomographic SAR (TomoSAR), Lidar full waveforms, and small-footprint Lidar (SFL) have been tried along with the help of manual ground survey data. Distribution of mangrove types, the extent of the mangrove land cover, and the rate and cause of mangrove land cover change are some milestones to know more about the ecology of the forest and to execute the better plan for the preservation and promotion of the mangroves [6,7].
Space-borne or air-borne side-looking SAR offers remotely-sensed high-resolution imagery data by utilizing the flight path of the moving platform established on a satellite or aircraft. SAR has been used as a powerful tool in various applications such as Climate Change, Environmental hazards, Resource Management, Sustainable Development, and Disaster monitoring/management. The 3-D information of the illuminated ground target can also be recovered from the SAR data collected over a 2-D aperture radar. SAR is one of the leading advanced imaging systems [8], which is used for mankind in the field of air-borne and space-borne remote sensing. Quad-polarimetric SAR data provides better information than the single band SAR data about the scattering behavior of the targets, since it contains datasets from four different polarization bands namely VV, VH (V: vertical, H: horizontal), HH, and HV. The effective discrimination of the ground targets can be done on the basis of their scattering mechanism with the help of coherent and incoherent polarimetric decomposition algorithms. Military (e.g., target recognition/classification, ship detection) [9,10], forestry (e.g., tree height estimation, forest monitoring, and classification) [11,12], agriculture (e.g., soil moisture extraction and crop classification,) [13], topographic applications (DEM generation and validation) [14,15], and oceanography (e.g., wind field and surface currents retrieval) [16], are the areas where advanced SAR techniques are an important tool.
Field surveys of the mangrove forests are difficult due to the complex structure of trees [17]. The presence of dangerous wildlife and the density of the mangrove forest make access to the mid-forest beyond the directly connected waterways difficult. Researchers are more focused on using remote sensing techniques for the mapping and monitoring of mangrove forests. A mangrove land cover extraction method using remotely sensed L-band full-pol UAVSAR data (acquired on 25 February 2016) based on entropy (H) and anisotropy (A) concepts has been proposed in this study.

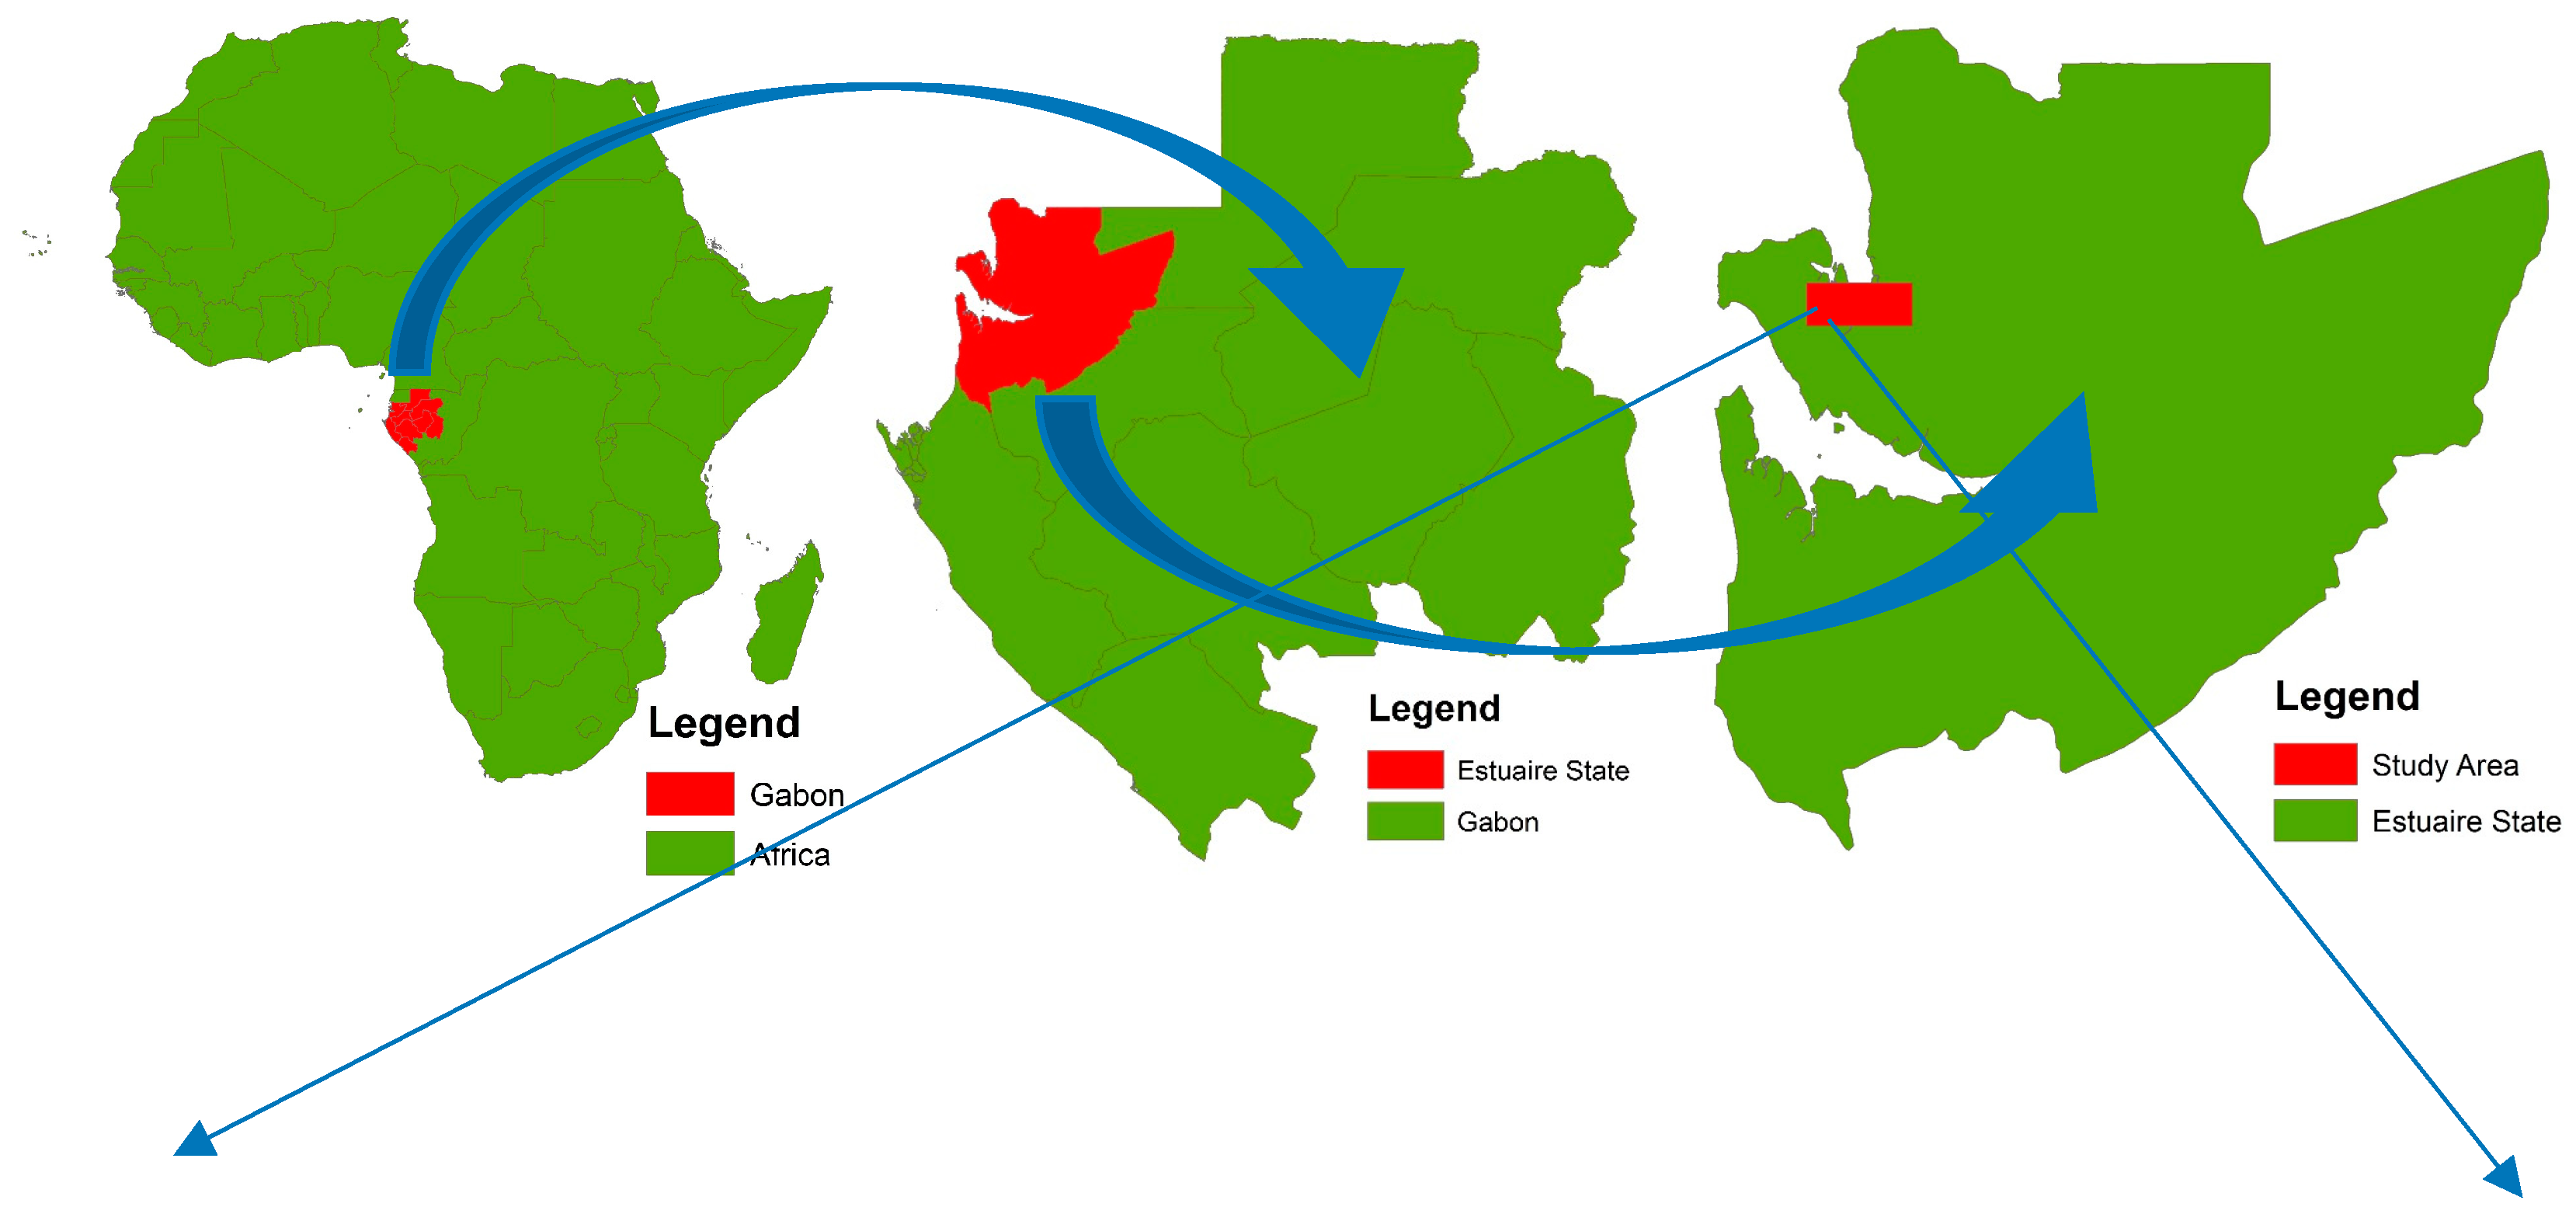
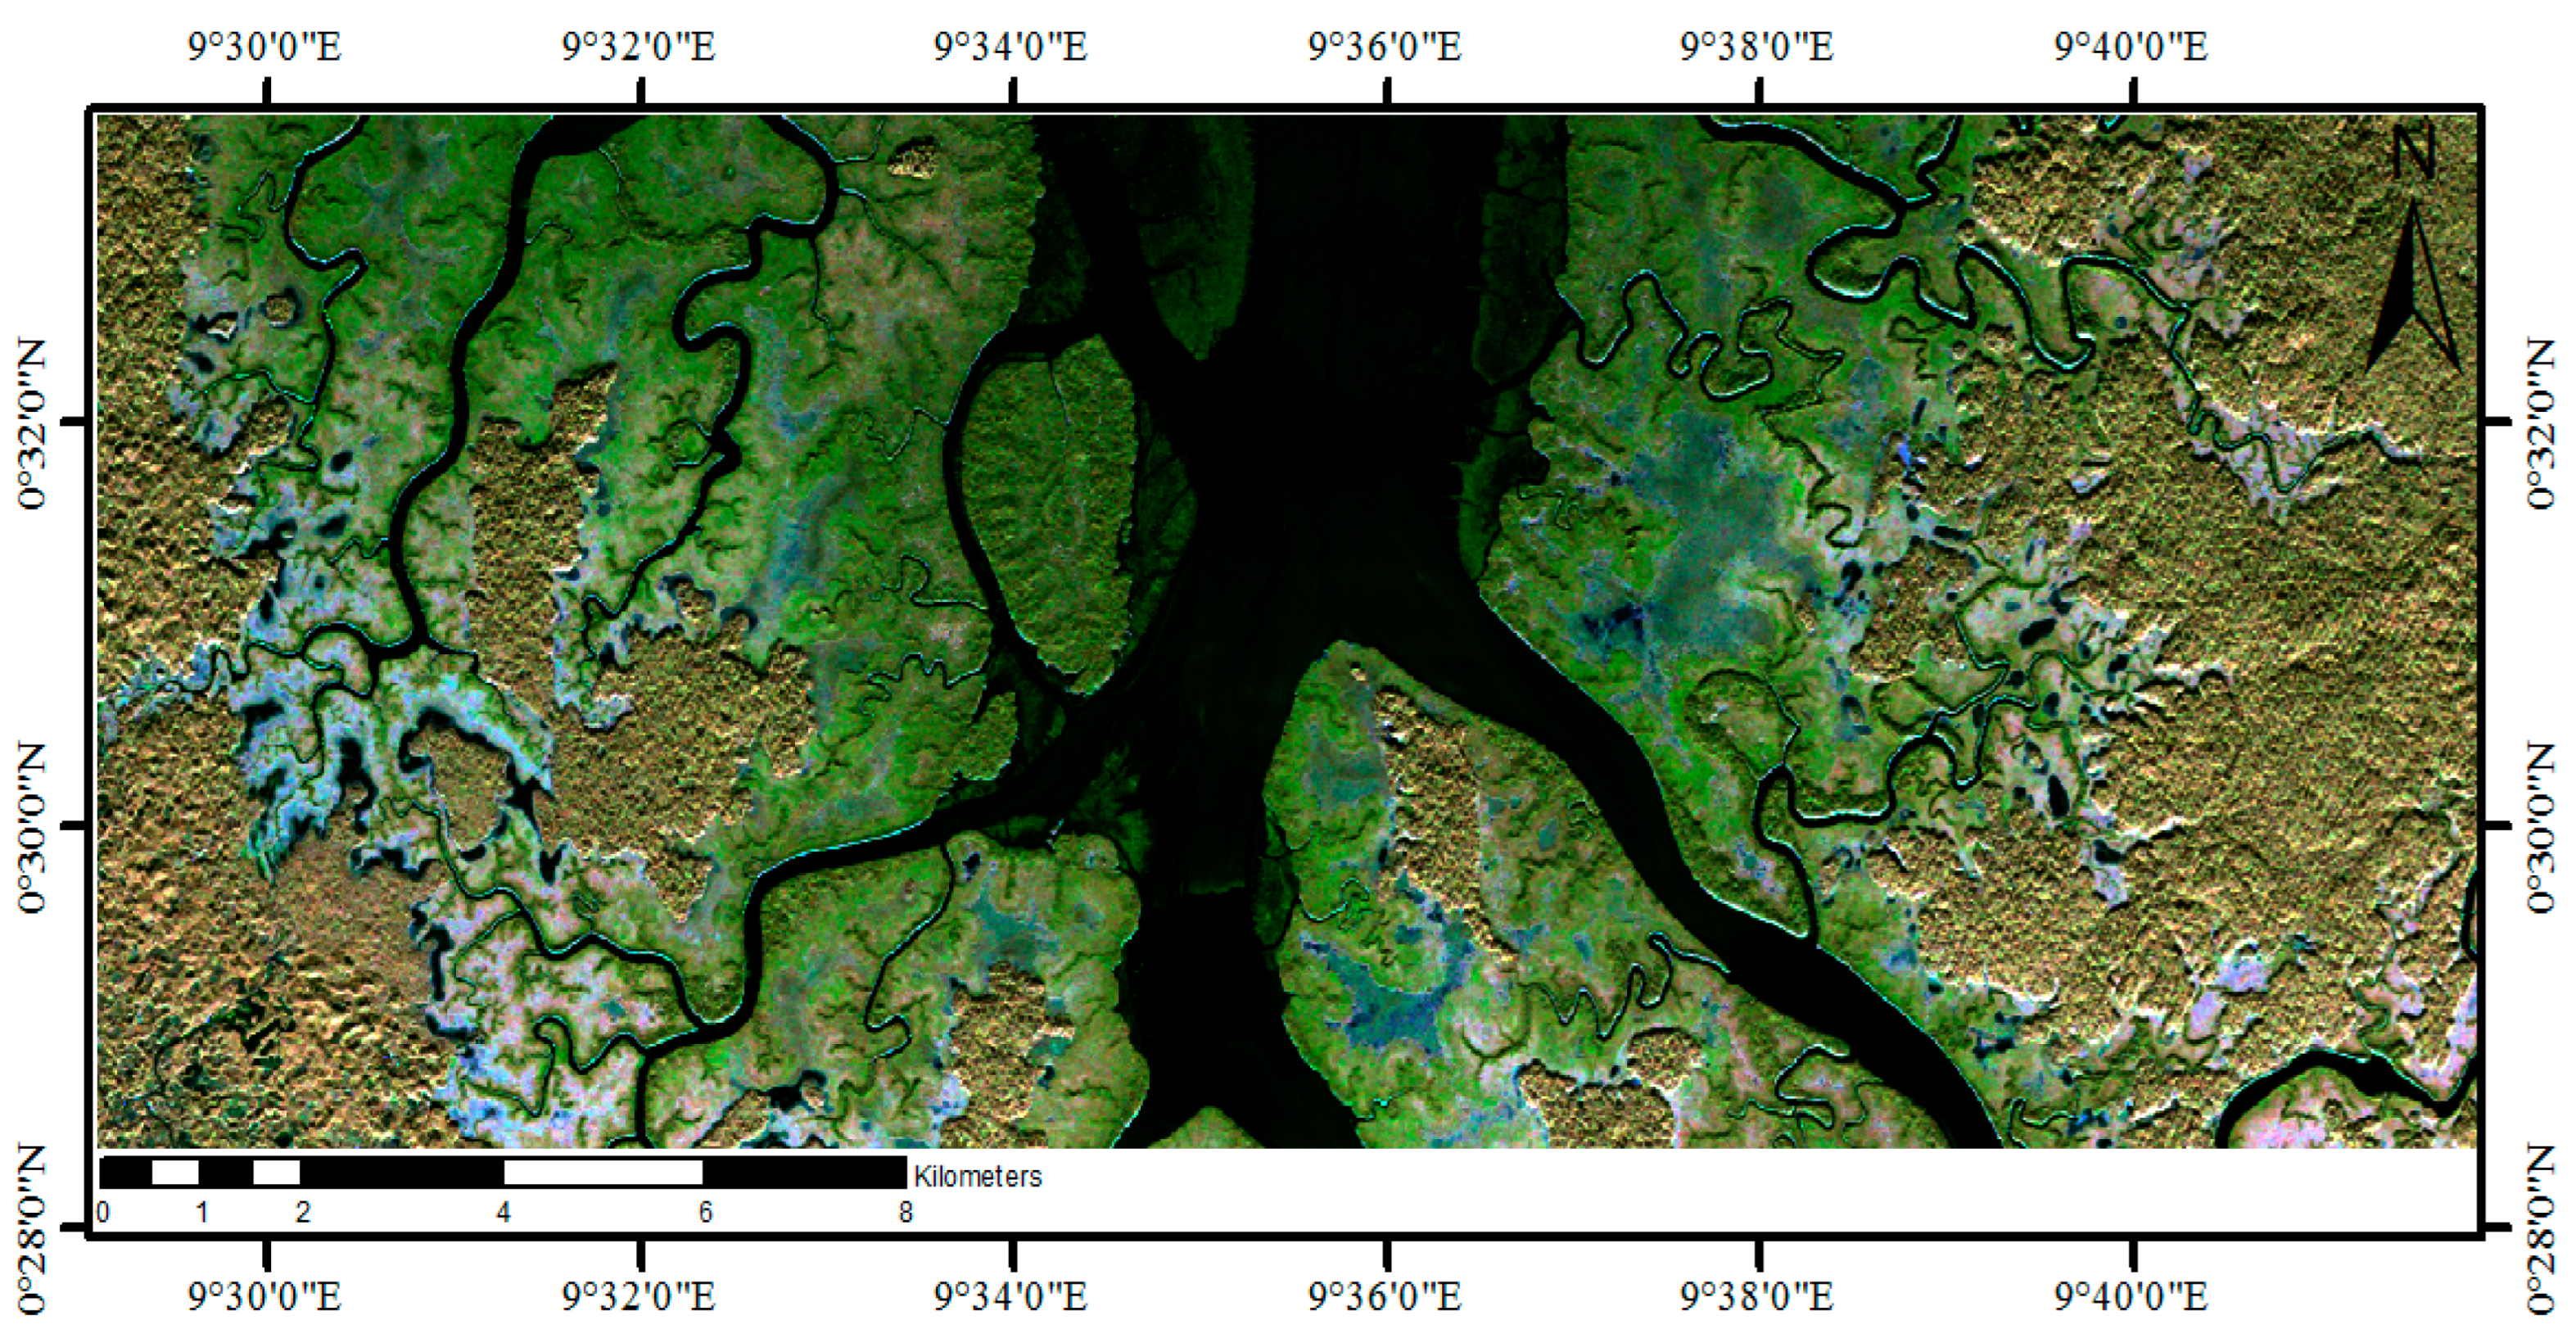
2. Study Area and Data Sources

The study area shown in Figure 1 is a part of the legally conserved coastal forest in Komo-Mondah Department, northwest Gabon. The Mondah mangrove forest comprises of a rich ecosystem in the form of complex structures of trees and a wide variety of wildlife. This forest plays an important role in stabilizing the climate and is of great interest for inclusion in climate change policies. The forest is under huge environmental pressure due to the proximity of Libreville city. Urban expansion is a growing threat to the integrity of formerly forest protected areas and is resulting in their downgrading, downsizing, or degazetting [18].
The quad-pol georeferenced UAVSAR image acquired over Mondah, Gabon, Africa under the “AfriSAR” mission has been used for the extraction of mangrove land cover area. The data specification is given in Table 1. Collection of field measurements and radar data of the mangrove forests in Gabon, West Africa was done through the AfriSAR airborne campaign. The mission was a collaborated effort by NASA, the European Space Agency (ESA), and the Gabonese Space Agency. The mangrove shapefile data provided by GMW is used for the accuracy assessment of the extracted mangrove land cover. The GMW was initiated by Japan Aerospace Exploration Agency (JAXA) Kyoto & Carbon (K & C) with the aim to generate reliable 25 m spatial resolution maps. Mangrove land cover mapping (under GMW campaign) is done using Japanese L-band SAR data due to its global reach and better performance for mapping mangrove forests because of its larger wavelength [19].

3. Methodology

The extraction of mangrove land cover for the study area has been achieved by performing k-Mean clustering on H\A\Alpha decomposed SAR image. A combination of Entropy (H) and Anisotropy (A), “ ( 1     H )   *   A ” is used for the mangrove cover extraction. Several other combinations of Entropy and Anisotropy such as “ ( 1     H )   *   ( 1     A ) ”, “ H   *   ( 1     A ) ” were also analyzed to search for a better option of mangrove land cover extraction, but the study of mangrove land cover extraction using “ ( 1     H )   *   A ” image is included in this manuscript.

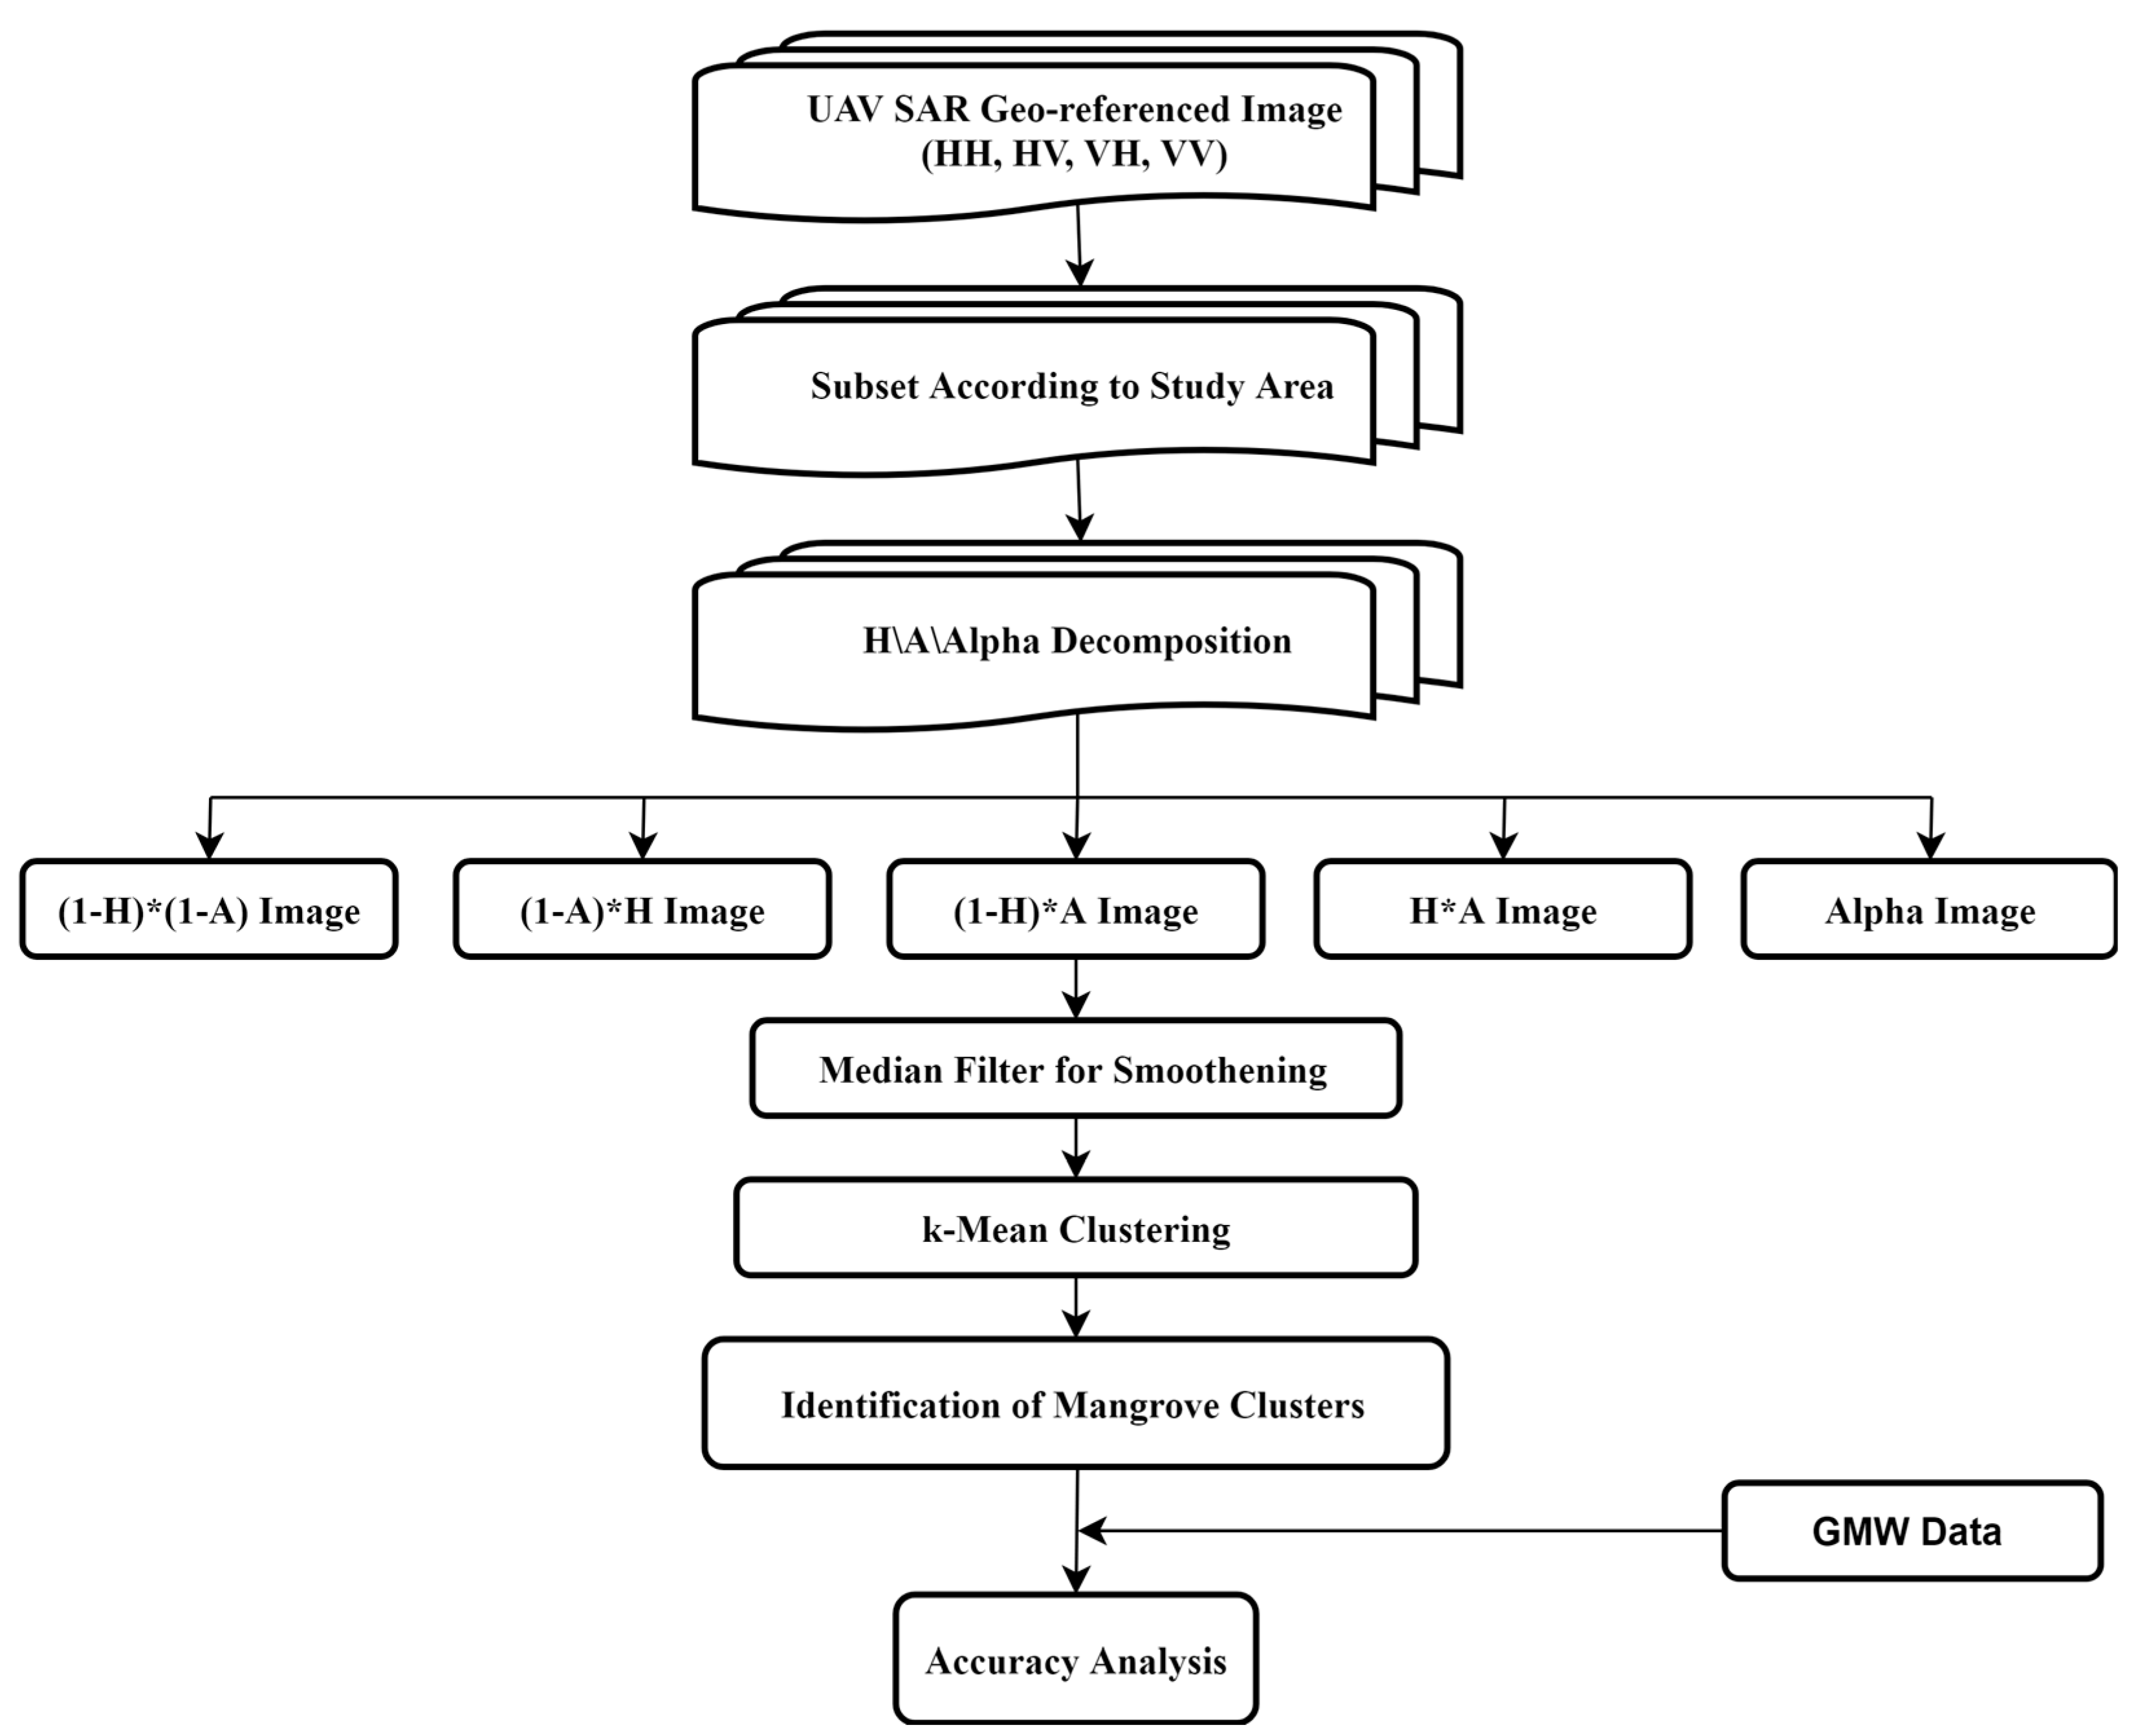
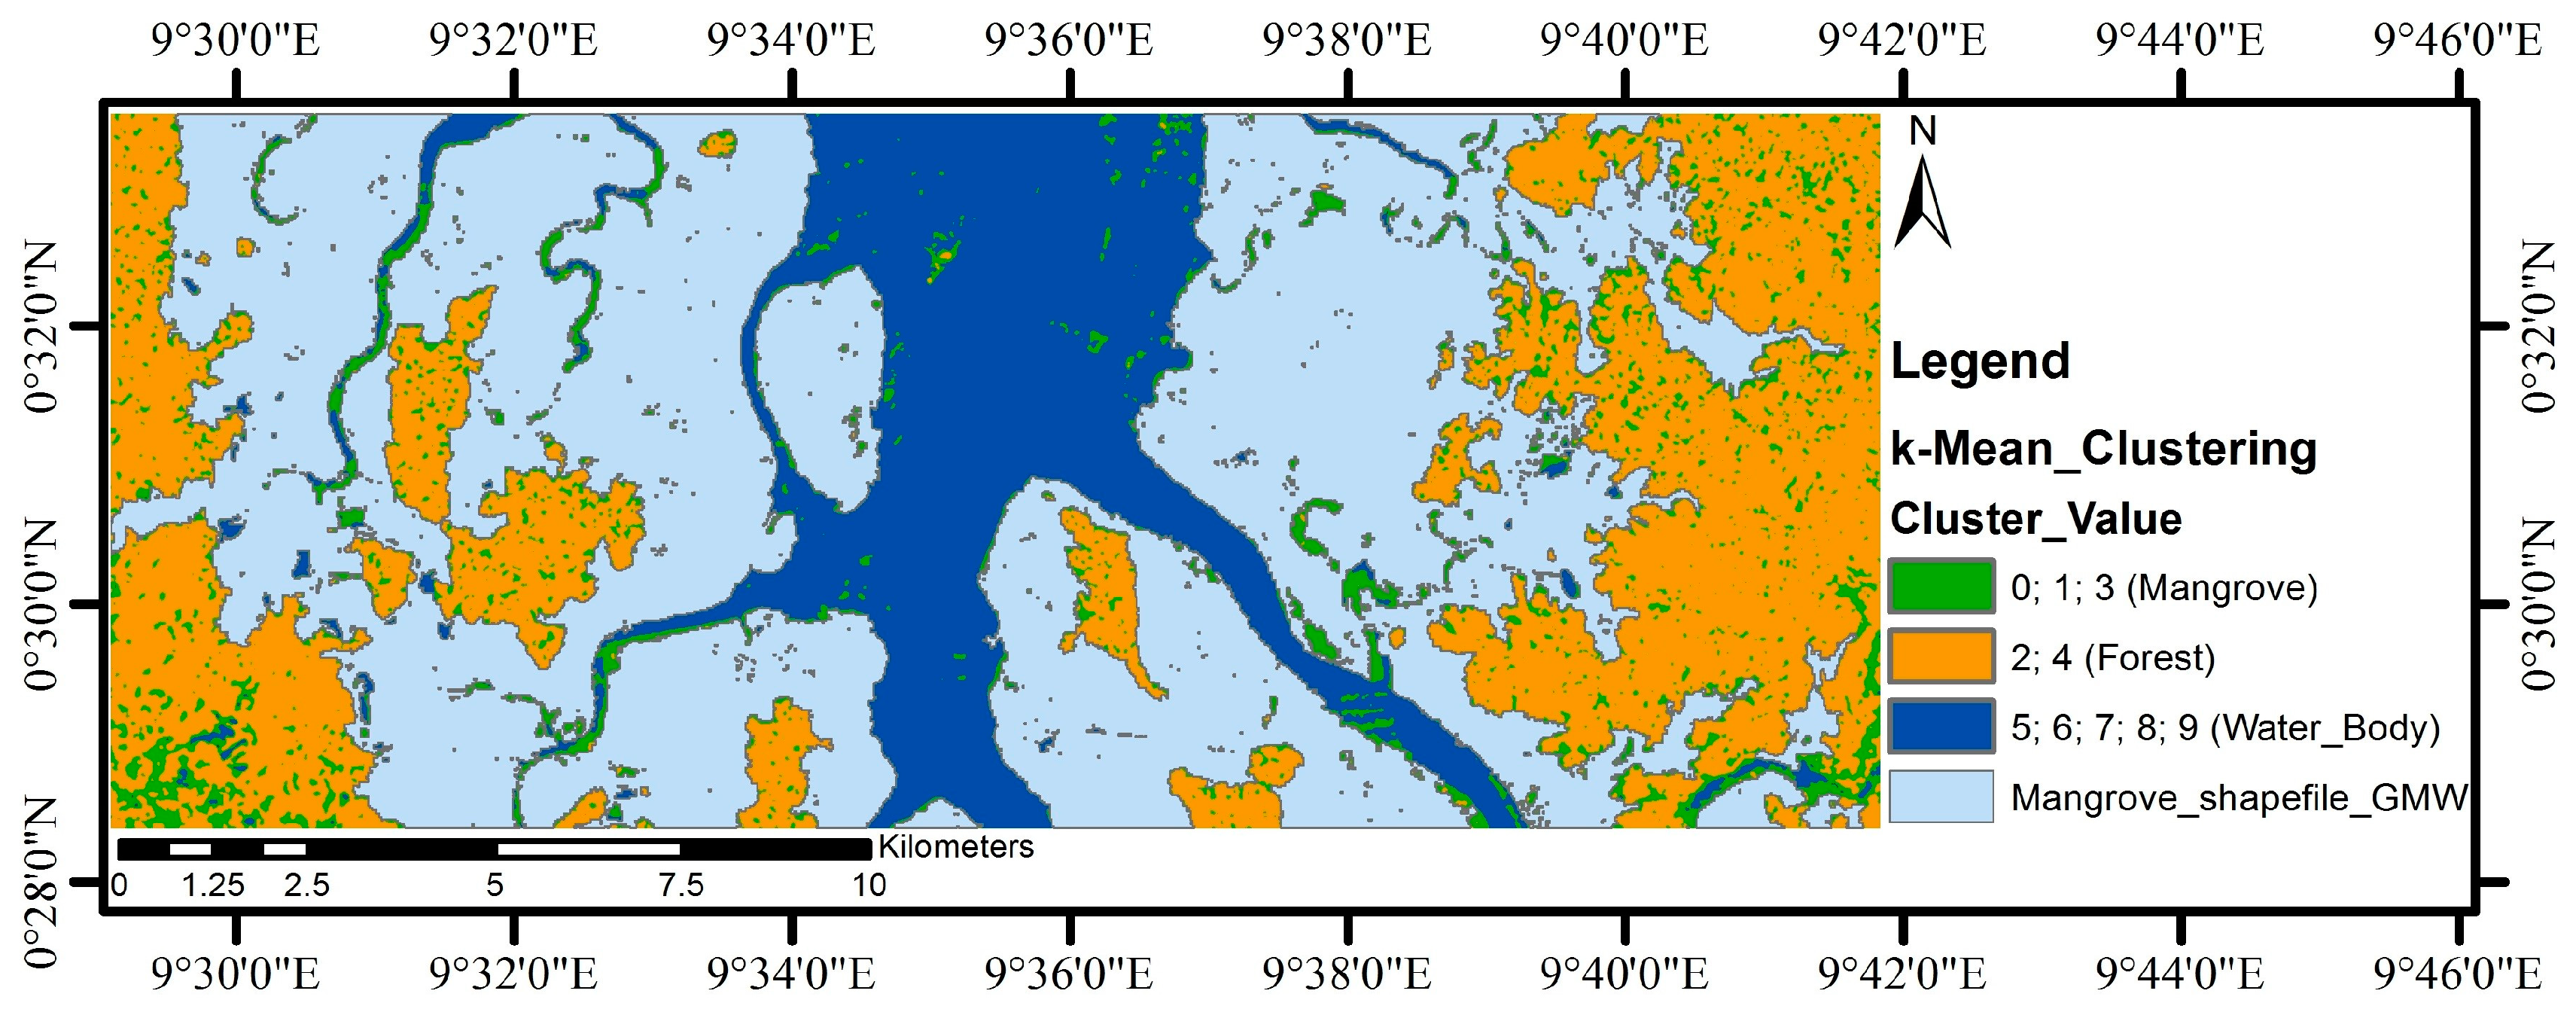
3.1. The H/A/Alpha Method

For a quad pol SAR system, the received RADAR signal is encoded in the form of a 2 × 2 scattering matrix (S) as shown in Equation (1).
S = [ S H H S H V S V H S V V ]
The coherency matrix [T3] (shown in Equation (2)) derived from the scattering matrix is the first usable product for performing the incoherent and Eigenvalue/Eigenvector based decompositions for physical information interpretation from the SAR data.
T 3 = [ | S H H + S V V | 2 ( S H H + S V V ) ( S H H S V V ) * 2 ( S H H + S V V ) S H V * ( S H H S V V ) ( S H H + S V V ) * | S H H S V V | 2 2 ( S H H S V V ) S H V * 2 S H V ( S H H + S V V ) * 2 S H V ( S H H S V V ) * 4 | S H V | 2 ]
H/A/Alpha polarization decomposition is based on Eigenvalue/ Eigenvector decomposition of the coherency matrix [20]. The diagonalization of the [T3] matrix (shown in Equation (3)) gives three different Eigenvalues (λ1, λ2, and λ3).
[ T 3 ] = [ U 3 ] [ λ 1 0 0 0 λ 2 0 0 0 λ 3 ] [ U 3 ] *
where
[ U 3 ] = [ cos α 1 cos α 2 cos α 3 sin α 1 cos β 1 e i δ 1 sin α 2 cos β 2 e i δ 2 sin α 3 cos β 3 e i δ 3 sin α 1 cos β 1 e i γ 1 sin α 2 cos β 1 e i γ 2 sin α 3 cos β 3 e i γ 3 ] .
Entropy (H) is calculated using Eigenvalues as shown in Equations (5) and (6), which is a function representing the noise in the system due to depolarization or the probability of effective scattering.
H = i = 1 3 p i log 3 p i  
where 0     H     1 and
p i = λ i q = 1 3 λ q .
Isotropically pure land surfaces represent the value of H tending to 0 and are responsible for effective scattering in this case. When H = 0, only one Eigenvalue of coherency matrix [T3] is non-zero with rank 1 (λ2 = λ3 = 0). The value of H approaching 1 represents that the random scattering is in play and for H = 1, all the three coherency matrix Eigenvalues are equal and non-zero. For most natural objects, H lies between 0 and 1 [21]. As it increases from 0 to 1, the system approaches from simple scattering to completely random scattering.
Anisotropy (A) is the second significant parameter used in this study and its value is defined as the value related to the normalization of the second and third Eigenvalues (λ2 and λ3) of the 3 × 3 coherency matrix [T3] [22]. A is given by
A = p 2 p 3 p 2 + p 3 = λ 2   λ 3 λ 2 +   λ 3   .
The range of A is from 0 to 1 and can be considered as the complement of H. When H > 0.7, A can also be viewed as a source of dissimilarity between the second and third Eigenvalues of the coherency matrix, and represent the comparative importance of the second and third Eigenvalues. When H < 0.7, both the Eigenvalues (second and third) are critically affected by noise [23]. Therefore, A also denotes the noise level. As H increases, the use of H alone is insufficient for the recognition of ground targets. Therefore, A can then contribute to the identification of the object type [24]. A may be used to discriminate scattering targets when A reaches a maximum. Usually, when A is higher, only the second scattering process contributes, while both scattering processes equally contribute when A is lower. Therefore, because of the invariant nature of the Eigenvalues of the U matrix, a grouping of both A and H greatly helps in resolving polarization scattering problems. Different combinations of A and H may be used for better discrimination of different ground targets. The four such combinations are given as:
S = { ( 1 H ) * ( 1 A ) H * ( 1 A ) A * ( 1 H ) A * H .
In the context of this study, the combination A * ( 1 H ) has been used for the extraction of mangrove land cover. The methodology followed in the study is shown in Figure 2 of Section 3.2.

3.2. Flow Chart and Methodology Adopted
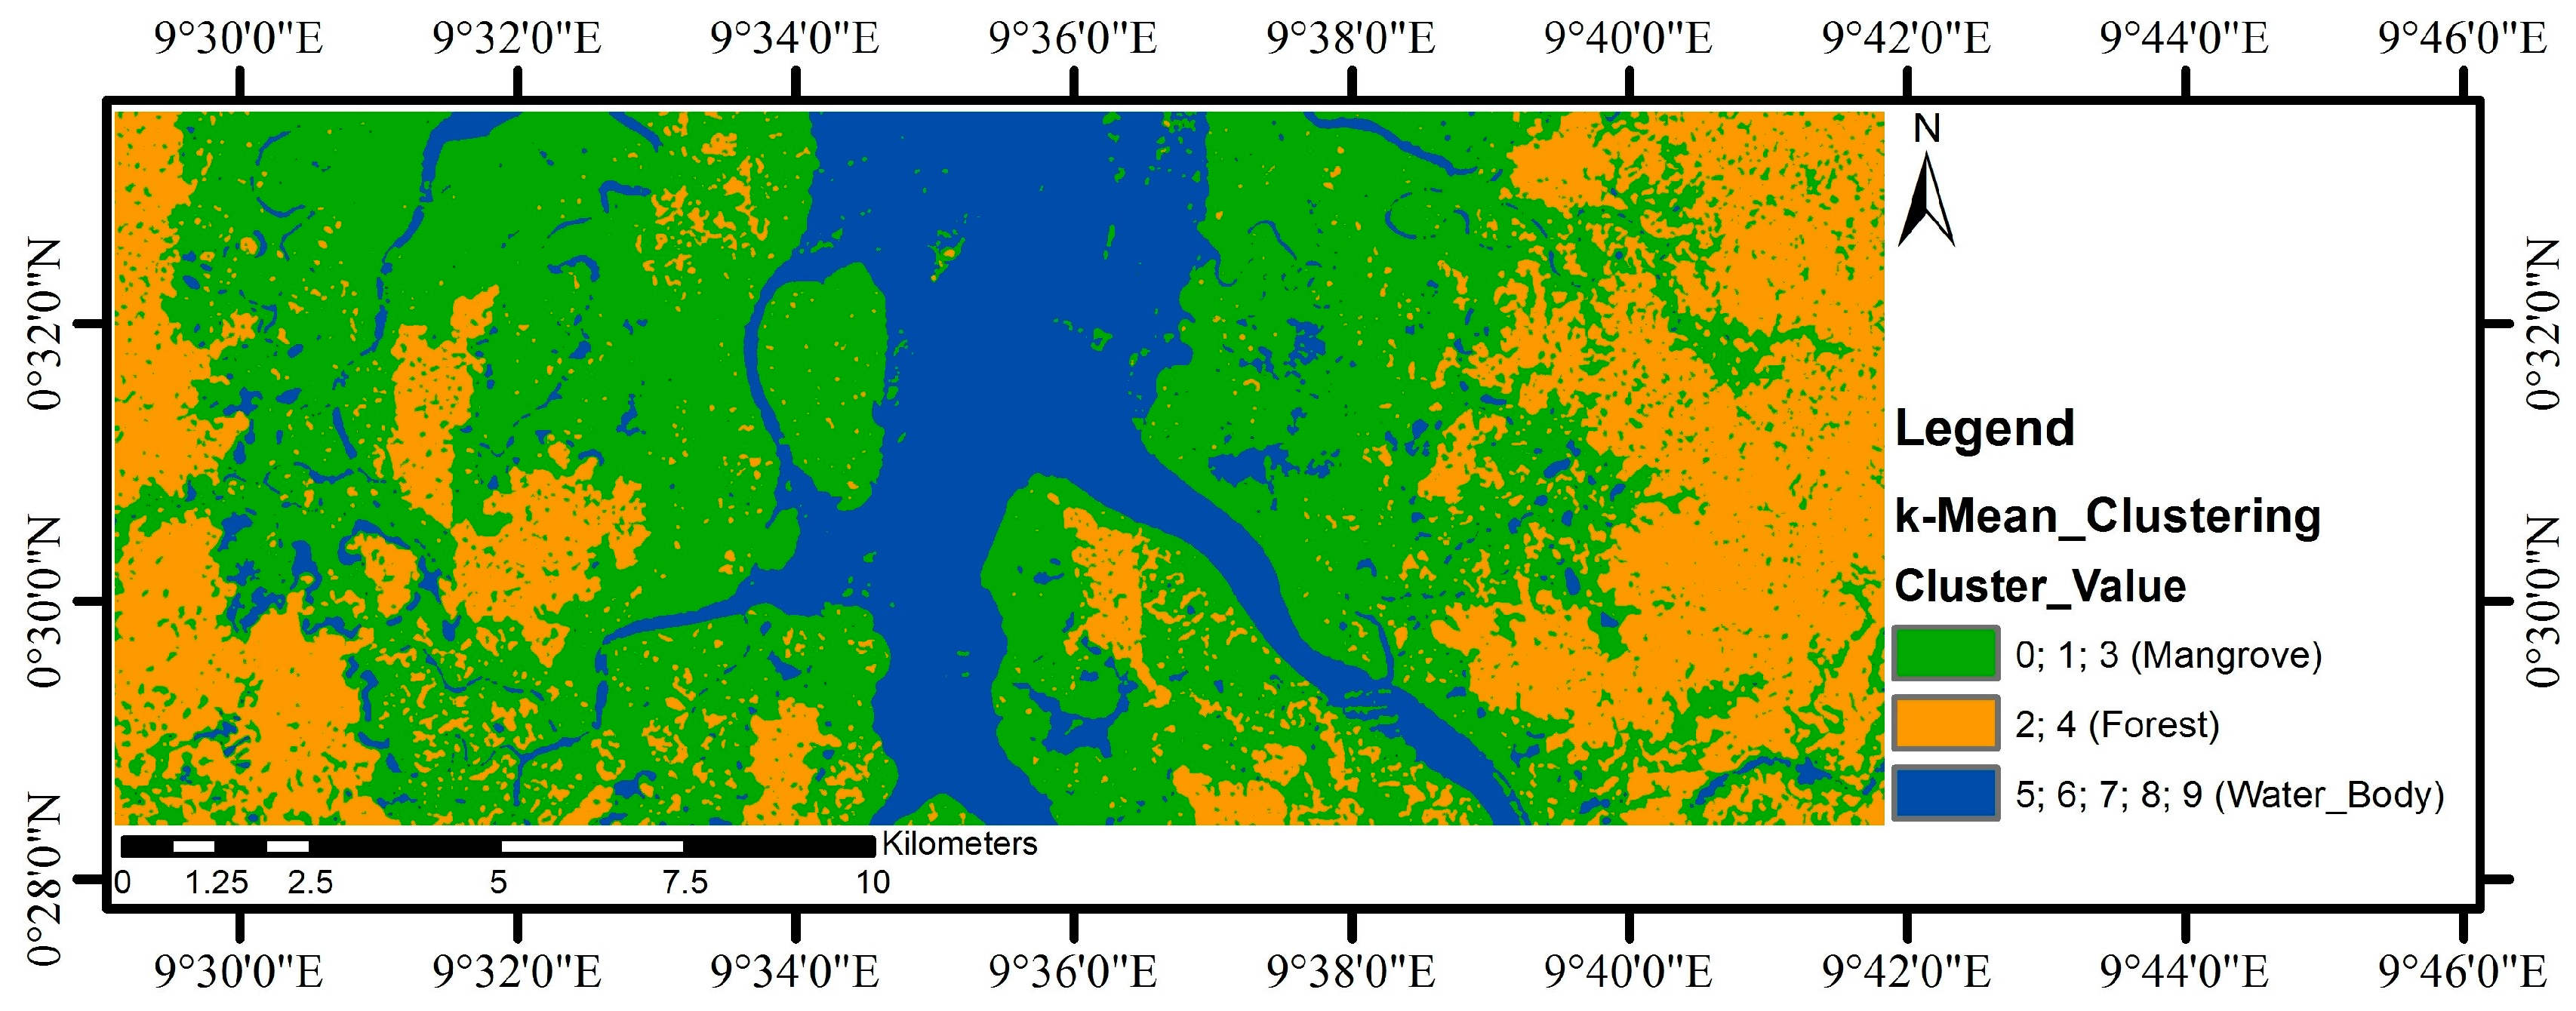
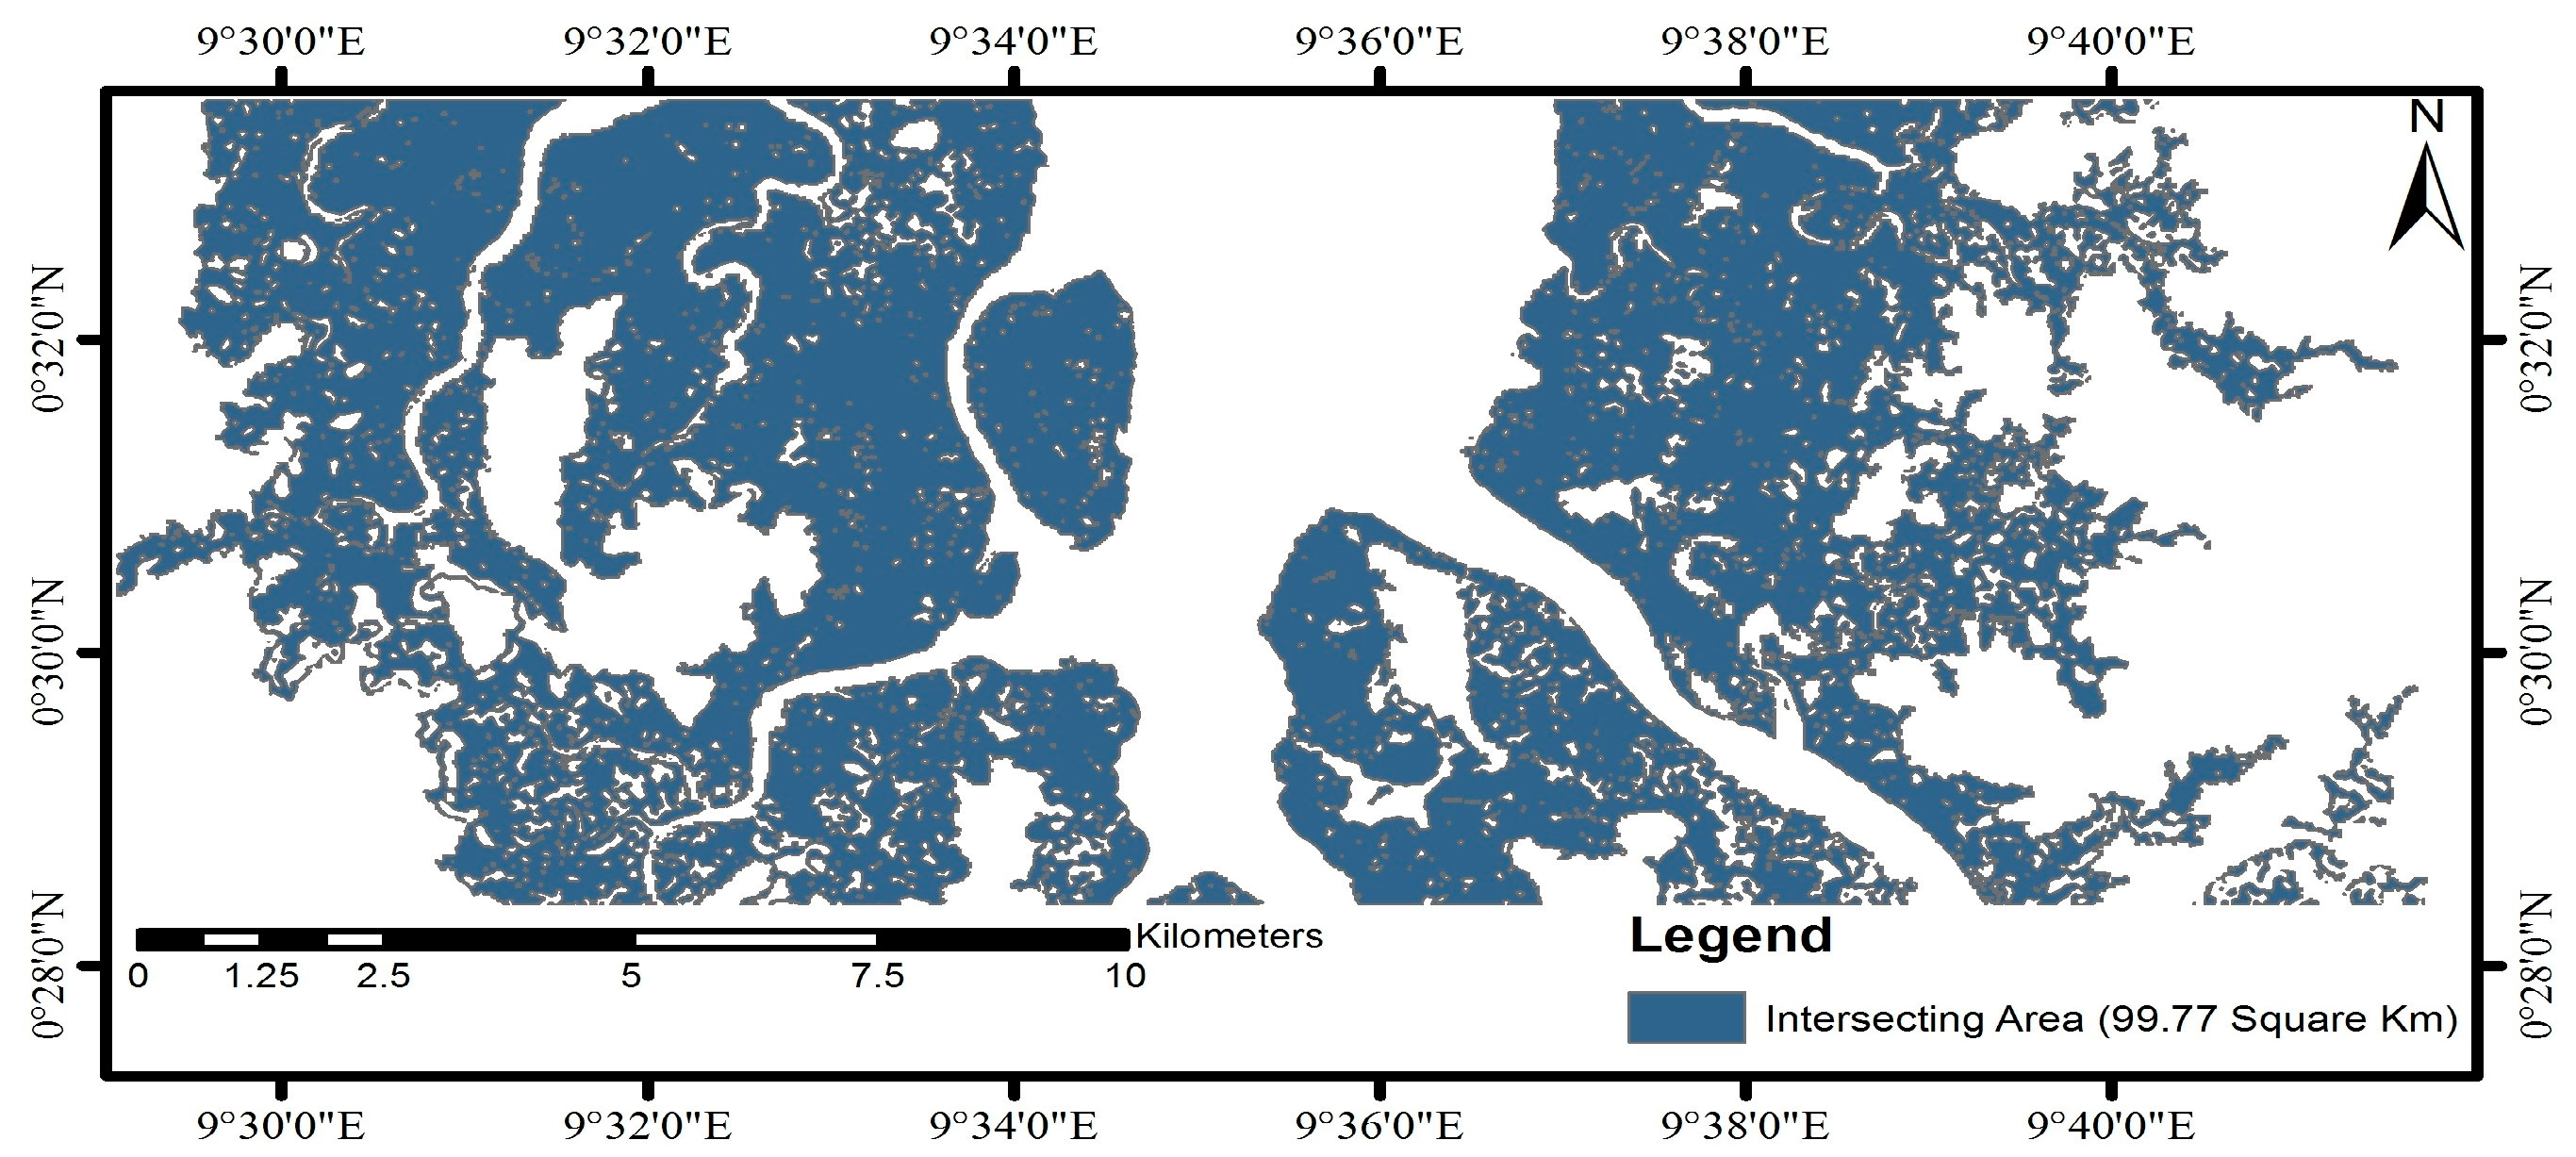
A mangrove land cover extraction method using the subset of remotely sensed L-band quad-pol UAVSAR data (acquired on 25 February 2016) based on Entropy and Anisotropy concept has experimented. H\A\Alpha decomposition method was applied to the subset of UAVSAR data of the study area. A combination of Entropy and Anisotropy “ A * ( 1 H ) ” has been used for the extraction. A median filter has been applied on A * ( 1 H ) image for smoothing so that mangrove region pixels may get clustered together without the presence of small non-mangrove patches in between. The Median Filtered A * ( 1 H ) image’s pixels were clustered together with a total of 9 clusters defined in the k-Mean clustering algorithm. Cluster 0, 1, and 3 were identified as mangrove cover. Cluster 5, 6, 7, 8, and 9 were identified as a water body. The rest of the area (forest) of the image was clustered with cluster values 2 and 4.

4. Results

As shown in Figure 3 (Green color), the mangrove land cover of the study area was extracted to be 116.07 Km2 using Entropy and Anisotropy based k-Mean clustering and validated with the contemporary shapefile data (Figure 4) of mangrove land cover area provided by GMW. According to GMW, the overall mangrove area of the study region is 115.67 Km2.
Despite having overestimation in an extracted mangrove land cover area, the intersection area (as shown in Figure 5) between the mangrove cover area provided by GMW and the extracted mangrove land cover using the tested methodology was found to be 99.77 Km2 which is 86.25% of the total area clustered as mangrove land cover area.

Author Contributions

Conceptualization, A.B., R.S.C., and O.S.; Methodology, A.B., R.S.C., and O.S.; Software and Analysis, A.B., R.S.C. and O.S.; Validation, A.B, and O.S..; Writing-Original Draft Preparation, O.S.; Writing-Review & Editing, A.B., R.S.C. and O.S..; Supervision, A.B., and R.S.C.

Funding

This research received no external funding.

Acknowledgments

Authors would like to thank JPL NASA, ESA, Japan Aerospace Exploration Agency (JAXA), and Kyoto & Carbon (K&C) for their insights and support through data sharing platforms and software, which were highly valuable and critical for the presented study.

Conflicts of Interest

The authors declare no conflict of interest.

References

  1. Field, C.B.; Osborn, J.; Hoffman, L.; Polsenberg, J.; Ackerly, D.; Berry, J.; Björkman, O.; Held, A.; Matson, P.; Mooney, H. Mangrove biodiversity and ecosystem function. Glob. Ecol. Biogeogr. Lett. 1998, 7, 3–14. [Google Scholar] [CrossRef]
  2. Donato, D.C.; Kauffman, J.B.; Murdiyarso, D.; Kurnianto, S.; Stidham, M.; Kanninen, M. Mangroves among the most carbon-rich forests in the tropics. Nat. Geosci. 2011, 4, 293–297. [Google Scholar] [CrossRef]
  3. Breithaupt, J.L.; Smoak, J.M.; Smith, T.J.; Sanders, C.J.; Hoare, A. Organic carbon burial rates in mangrove sediments: Strengthening the global budget. Glob. Biogeochem. Cycles 2012, 26. [Google Scholar] [CrossRef]
  4. Das, S.; Vincent, J.R. Mangroves protected villages and reduced death toll during Indian super cyclone. Proc. Natl. Acad. Sci. USA 2009, 106, 7357–7360. [Google Scholar] [CrossRef]
  5. Ellison, J.C. Vulnerability assessment of mangroves to climate change and sea-level rise impacts. Wetl. Ecol. Manag. 2015, 23, 115–137. [Google Scholar] [CrossRef]
  6. Kovacs, J.M.; Vandenberg, C.V.; Wang, J.; Flores-Verdugo, F. The Use of Multipolarized Spaceborne SAR Backscatter for Monitoring the Health of a Degraded Mangrove Forest. J. Coast. Res. 2008, 241, 248–254. [Google Scholar] [CrossRef]
  7. Thomas, N.; Lucas, R.; Bunting, P.; Hardy, A.; Rosenqvist, A.; Simard, M. Distribution and drivers of global mangrove forest change, 1996–2010. PLoS ONE 2017, 12, e0179302. [Google Scholar] [CrossRef] [PubMed]
  8. Zebker, H.A.; Member, S.; Van Zyl, J.J. Imaging Radar Polarimetry. J. Geophys. Res. Solid Earth 1987, 92, 683–701. [Google Scholar] [CrossRef]
  9. Yang, J.; Yamaguchi, Y.; Lee, J.S.; Touzi, R.; Boerner, W.M. Applications of polarimetric SAR. Sens. J. 2015, 2015, 11–13. [Google Scholar] [CrossRef]
  10. Liu, C.; Vachon, P.W.; Geling, G.W. Improved ship detection with airborne polarimetric SAR data. Can. J. Remote Sens. 2005, 31, 122–131. [Google Scholar] [CrossRef]
  11. Cloude, S.R. Polarimetric sar interferometry. IEEE Trans. Geosci. Remote Sens. 1998, 36, 1551–1565. [Google Scholar] [CrossRef]
  12. Freeman, A. Fitting a two-component scattering model to polarimetric SAR data from forests. IEEE Trans. Geosci. Remote Sens. 2007, 45, 2583–2592. [Google Scholar] [CrossRef]
  13. Ferrazzoli, P.; Paloscia, S.; Pampaloni, P.; Schiavon, G.; Sigismondi, S.; Solimini, D. The potential of multifrequency polarimetric sar in assessing agricultural and arboreous biomass. IEEE Trans. Geosci. Remote Sens. 1997, 35, 5–17. [Google Scholar] [CrossRef]
  14. Bhardwaj, A.; Jain, K.; Chatterjee, R.S. Generation of high-quality digital elevation models by assimilation of remote sensing-based DEMs. J. Appl. Remote Sens. 2019, 13, 044502. [Google Scholar] [CrossRef]
  15. Toutin, T.; Zakharov, I.; Schmitt, C. Fusion of Radarsat-2 polarimetric images for improved stereo-radargrammetric DEM. Int. J. Image Data Fusion 2010, 1, 67–82. [Google Scholar] [CrossRef]
  16. Schmullius, C.C.; Evans, D.L. Review article Synthetic aperture radar (SAR) frequency and polarization requirements for applications in ecology, geology, hydrology, and oceanography: A tabular status quo after SIR-C/X-SAR. Int. J. Remote Sens. 1997, 18, 2713–2722. [Google Scholar] [CrossRef]
  17. Darmawan, S.; Takeuchi, W.; Vetrita, Y.; Winarso, G.; Wikantika, K.; Sari, D.K. Characterization of mangrove forest types based on ALOS-PALSAR in overall Indonesian archipelago. IOP Conference Series: Earth and Environmental Science; IOP Publishing: Bristol, UK, 2014; Volume 20. [Google Scholar]
  18. Feka, N.Z.; Ajonina, G.N. Drivers causing decline of mangrove in West-Central Africa: A review. Int. J. Biodivers. Sci. Ecosyst. Serv. Manag. 2011, 7, 217–230. [Google Scholar] [CrossRef]
  19. Bunting, P.; Rosenqvist, A.; Lucas, R.M.; Rebelo, L.M.; Hilarides, L.; Thomas, N.; Hardy, A.; Itoh, T.; Shimada, M.; Finlayson, C.M. The global mangrove watch—A new 2010 global baseline of mangrove extent. Remote Sens. 2018, 10, 1669. [Google Scholar] [CrossRef]
  20. Pasolli, L.; Notarnicola, C.; Bruzzone, L.; Bertoldi, G.; Chiesa, S.D.; Niedrist, G.; Tappeiner, U.; Zebisch, M. Polarimetric RADARSAT-2 imagery for soil moisture retrieval in alpine areas. Can. J. Remote Sens. 2012, 37, 535–547. [Google Scholar] [CrossRef]
  21. Xie, Q.; Meng, Q.; Zhang, L.; Wang, C.; Wang, Q.; Zhao, S. Combining of the H/A/Alpha and Freeman-Durden Polarization Decomposition Methods for Soil Moisture Retrieval from Full-Polarization Radarsat-2 Data. Adv. Meteorol. 2018, 2018, 10–1155. [Google Scholar] [CrossRef]
  22. Baghdadi, N.; Cresson, R.; Pottier, E.; Aubert, M.; Mehrez, M.; Jacome, A.; Benabdallah, S. A potential use for the C-band polarimetric SAR parameters to characterize the soil surface over bare agriculture fields. IEEE Trans. Geosci. Remote Sens. 2012, 50, 3844–3858. [Google Scholar] [CrossRef]
  23. Baghdadi, N.; Dubois-Fernandez, P.; Dupuis, X.; Zribi, M. Sensitivity of main polarimetric parameters of multifrequency polarimetric SAR data to soil moisture and surface roughness over bare agricultural soils. IEEE Geosci. Remote Sens. Lett. 2013, 10, 731–735. [Google Scholar] [CrossRef]
  24. Cloude, S.R. Polarimetry: The Characterisation of Polarisation Effects in EM Scattering. Ph.D. Thesis, University of Birmingham, Birmingham, UK, October 1986; p. 367. [Google Scholar]
Figure 1. The geographical location of the study area shown with Pauli decomposed RGB UAVSAR data.
Proceedings 46 00021 g001aProceedings 46 00021 g001b
Figure 2. Flow chart for methodology adopted.
Proceedings 46 00021 g002
Figure 3. k-Mean Clustering result for the extraction of mangrove land cover using Entropy and Anisotropy.
Proceedings 46 00021 g003
Figure 4. k-Mean Clustering result with overlaid Global Mangrove Watch (GMW) shapefile for the mangrove land cover.
Proceedings 46 00021 g004
Figure 5. The intersection area between the mangrove cover area provided by GMW and the extracted mangrove land cover using the tested methodology.
Proceedings 46 00021 g005
Table 1. Properties of datasets used for the study.
Data PropertiesSpecification
Dataset Acquisition Date6 March 2016
Look DirectionLeft
PolarizationQuad Pol (HH, HV, VH, VV)
BandL
Data TypeGround-Range
Data Dimension6952 × 4172
Publisher’s Note: MDPI stays neutral with regard to jurisdictional claims in published maps and institutional affiliations.

