Proceeding Paper

Fourier-Transform Infrared Microspectroscopy (FT-IR) Study on Caput and Cauda Mouse Spermatozoa †

Dipartimento di Medicina Sperimentale, Università della Campania “L. Vanvitelli”, 80138 Naples, Italy
*
Author to whom correspondence should be addressed.
Presented at the 6th International Electronic Conference on Sensors and Applications, 15–30 November 2019; Available online: https://ecsa-6.sciforum.net/.
Proceedings 2020, 42(1), 19; https://doi.org/10.3390/ecsa-6-06537
Published: 14 November 2019

Abstract

:
Fourier-Transform Infrared micro-spectroscopy (µFT-IR) was used for an in vitro investigation on spermatozoa (SPZ) samples separately collected from caput and cauda of mouse epididymis. SPZ are characterized by deep biochemical changes during the transit along the epididymis and they can constitute ideal candidates for a µFT-IR investigation, thanks to the ability of this technique in analyzing cells at a molecular level. Appreciable differences were reported in the infrared spectra from caput and cauda SPZ, and biochemical changes in protein, nucleic acid, lipid, and carbohydrate content of cells were evidenced. The present investigation indicates that µFT-IR can constitute a valuable tool for monitoring, in an easy and fast way, the changes suffered by SPZ during the transit along the epididymis.

1. Introduction

Fourier-Transform IR (FT-IR) spectroscopic technique is nowadays a very valuable tool for the nondestructive analysis of biological specimens. FT-IR results are also particularly useful in cytological and histological diagnosis by using imaging procedures [1]. FT-IR is able to reveal bonds presenting a change of dipole moment during vibrational motion. These vibrational modes can be quantitatively characterized by IR spectroscopy, providing a very sensitive, label-free tool for studying molecular composition and dynamics without perturbing the sample. When FT-IR spectroscopy is performed on biological materials, the most important spectral regions are the fingerprint region (600–1450 cm−1) and the amide I and amide II (amide I/II) region (1500–1700 cm−1). The higher-wavenumber region (2800–3500 cm−1) is due to stretching vibrations such as S-H, C-H, N-H and O-H, whereas the lower-wavenumber regions typically correspond to bending and carbon skeleton fingerprint vibrations. These regions are able to give a complete biochemical fingerprint of the structure and function of investigated samples and have been adopted in a very large number of different samples of biological interest.
Recently, FT-IR spectroscopy has been adopted for investigating spermatozoa (SPZ) samples in order to principally take advantage of its non-invasivity. In particular, cyanide toxicity effects on rat sperm have been investigated at a molecular level by using FT-IR technique. Cyanide compounds are largely used in industries and are considered to be a ubiquitous pollutant in the environment. The use of FT-IR spectroscopy has also allowed an investigation on the secondary structure of protein components. It is worth noting that a complementary vibrational technique, the Raman technique, has been used for investigating oxidative DNA damage in human sperm [2].
In the present paper, FT-IR microspectroscopy (µFT-IR) has been adopted for characterizing SPZ separately collected from caput and cauda of the epididymis. Interestingly, SPZ are transcriptionally and translationally silent cells. During the epididymal transit, from caput-to-cauda, these cells undergo maturation via massive biochemical changes [3,4] that include: (i) decreases of cholesterol; (ii) qualitative composition of cytoplasmic proteins and RNA; (iii) protein degradation and phosphorylation; (iv) acquisition of GPI-anchored membrane proteins; (v) proteolytic remodelling of membrane proteins; (vi) fatty acid composition from saturated to polyunsaturated forms; (vii) DNA methylation; and (viii) inter/intra protamine disulfide-bound formation. Due to their remarkable biochemical differences, caput and cauda SPZ can be considered ideal candidates for an FT-IR spectroscopy investigation.
In this report, we summarize the preliminary results of an investigation on mouse sperm samples from caput and cauda epididymis. To our knowledge, this is the first time that vibrational spectroscopies are adopted for investigating the changes occurring in SPZ during the epididymal transit.

2. Materials and Methods

2.1. Collection of Sperm Samples from Caput and Cauda Epididymis

Adult male mice (CD1 background, from Charles River Laboratories, Lecco, Italy) were euthanized by asphyxia with CO2 and epididymis were dissected for sperm collection. Briefly, caput and cauda epididymis were separately immersed in PBS (pH 7.6) and slightly cut to endorse sperm extrusion from the epididymal duct, as previously reported [5]. Spermatozoa samples, separately collected from caput and cauda epididymis, were filtered throughout cheesecloth, washed by centrifugation (200× g for 5 min), in 0.9% NaCl solution, and pellets were processed for FT-IR analysis.
All animal studies were carried out in accordance with the principles and procedures outlined in the National Institute of Health Guide for Care and Use of Laboratory Animals and approved by the Italian Ministry of Research and the Italian Ministry of Health.

2.2. FT-IR Spectral Analysis

For FT-IR spectral analysis, SPZ pellets were resuspended in 0.9% NaCl solution and drops of a few microliters were used for spectra acquisition. For this purpose, a Perkin Elmer Spectrum One FT-IR spectrometer equipped with a Perkin Elmer Multiscope system infrared microscope (Mercury Cadmium Telluride detector, Perkin Elmer Inc., Hopkinton, MA, USA) was used. Spectral acquisitions were performed in specular-reflection mode with thin layers of samples (2 L) put on metallic IR-reflective surface. The background spectrum was collected from the metallic IR-reflective surface without sample. A sampling spot on the surface was selected through an objective (l0× optical or 15× infrared). All spectra were collected using 64 scans in the range from 4000 to 600 cm−1 with a 4 cm−1 spectral resolution.
The spectra were preliminarily analyzed using the application routines provided by the software package (“Spectrum” User Guide, Perkin Elmer Inc., Hopkinton, MA, USA) controlling the whole data acquisition system. “Spectrum” (release 5.0.2, 2004) is the main Perkin Elmer software package for collecting, viewing and processing IR spectra [6].

3. Results and Discussion

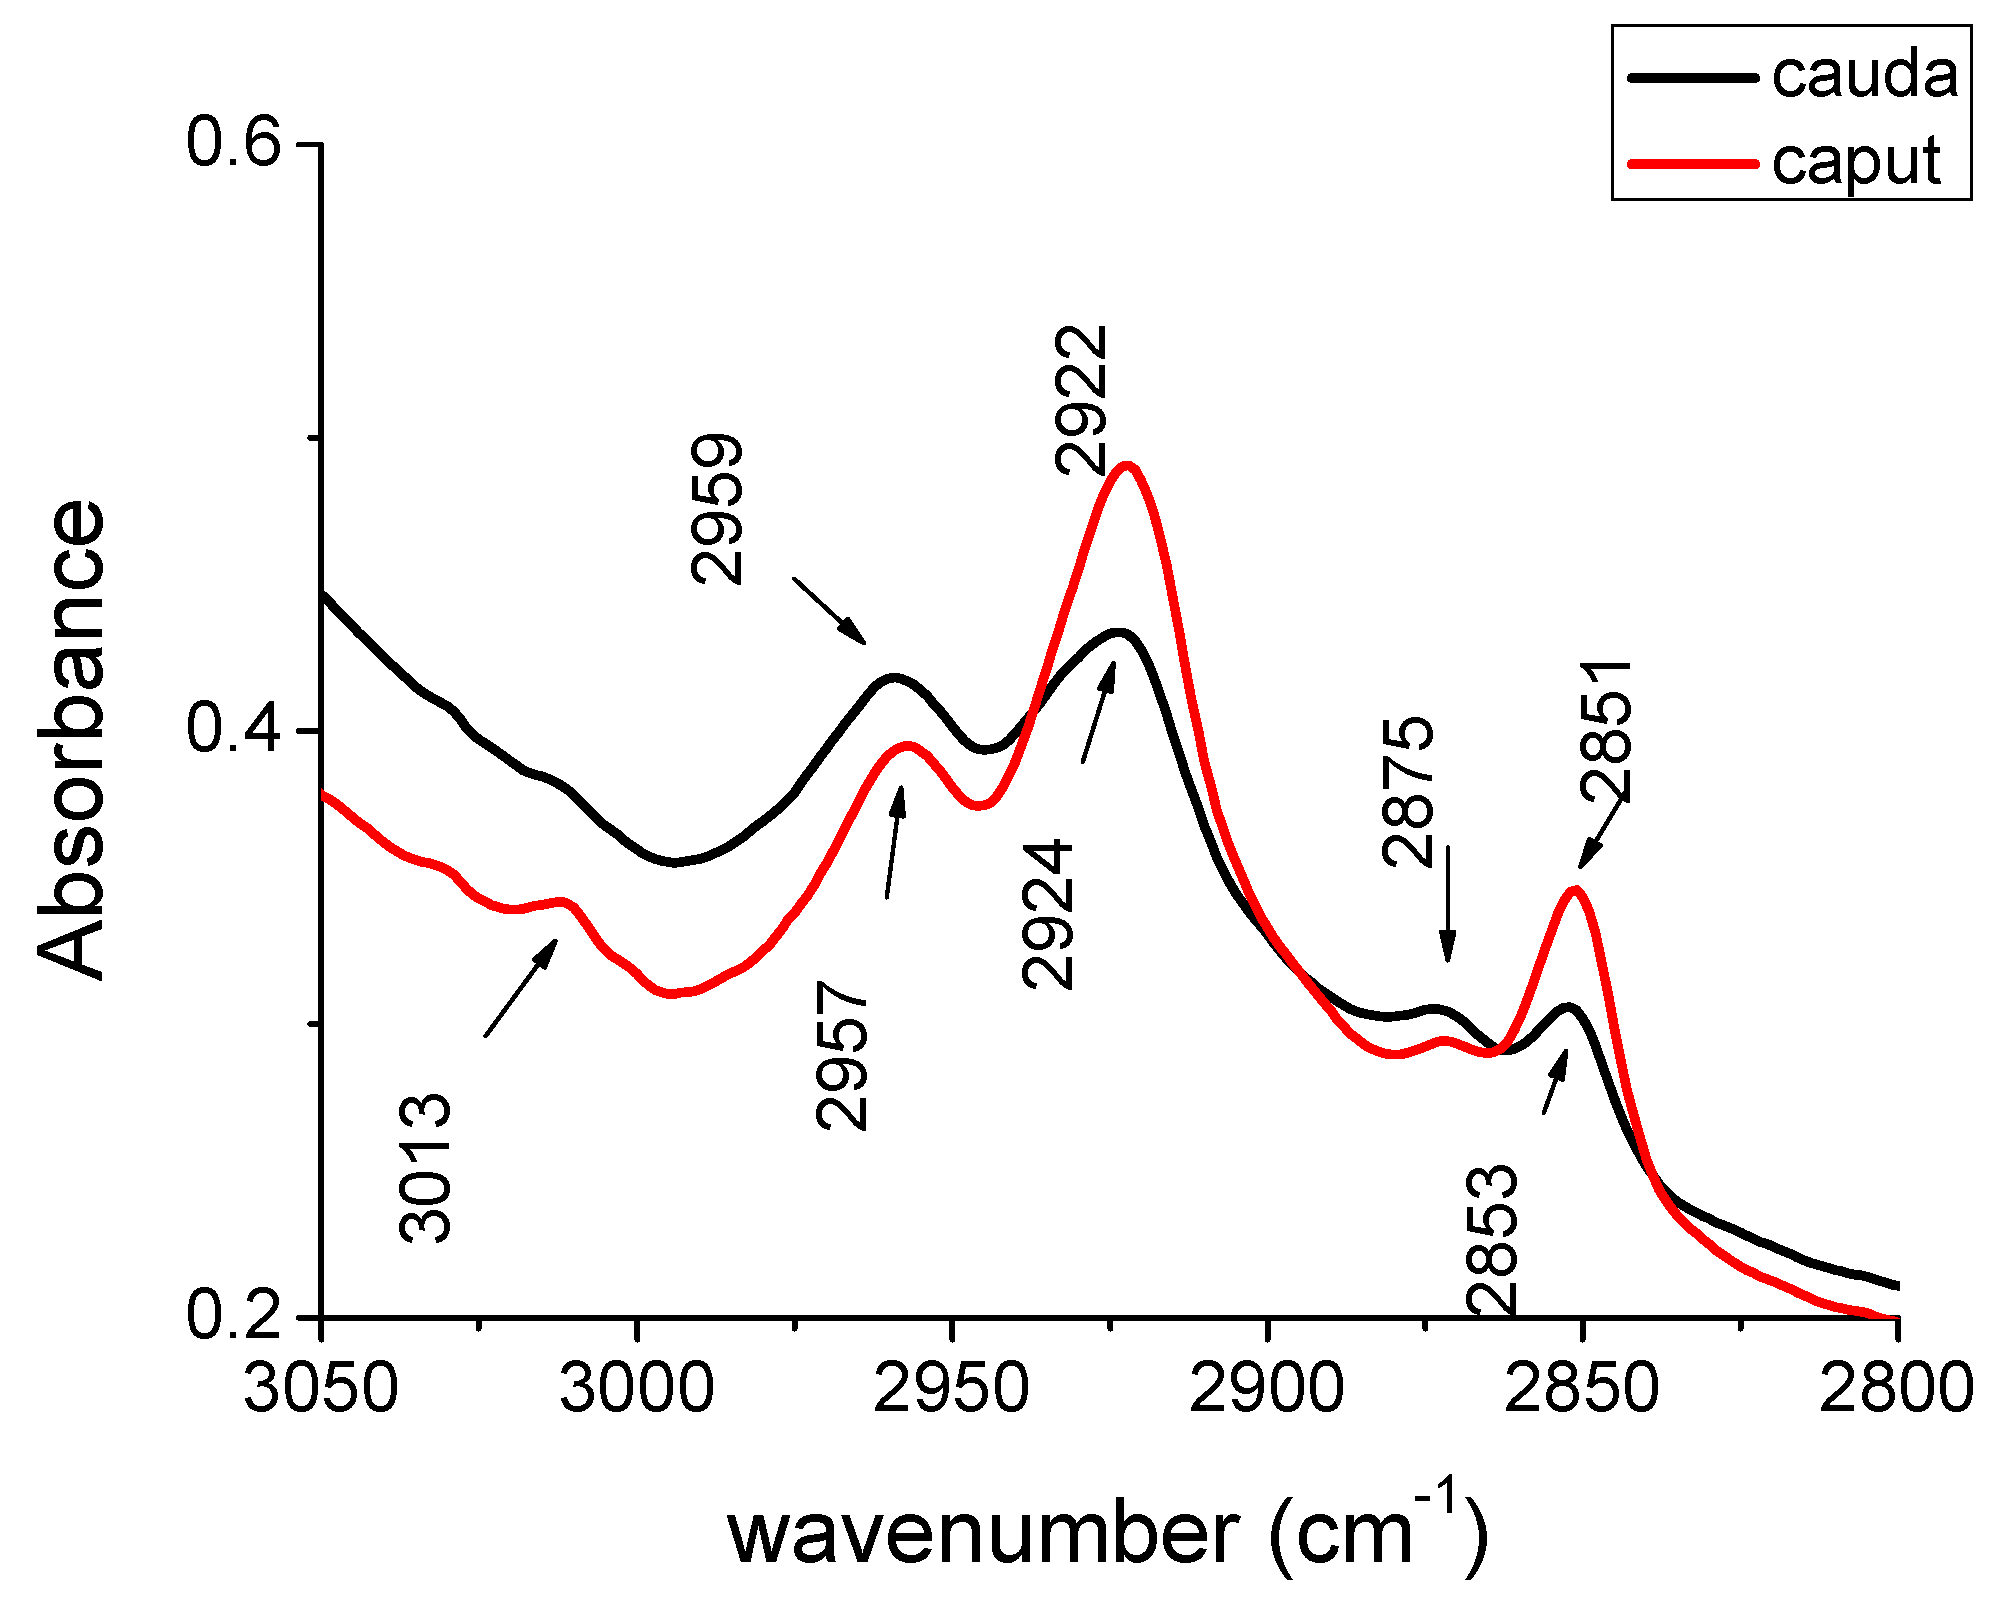
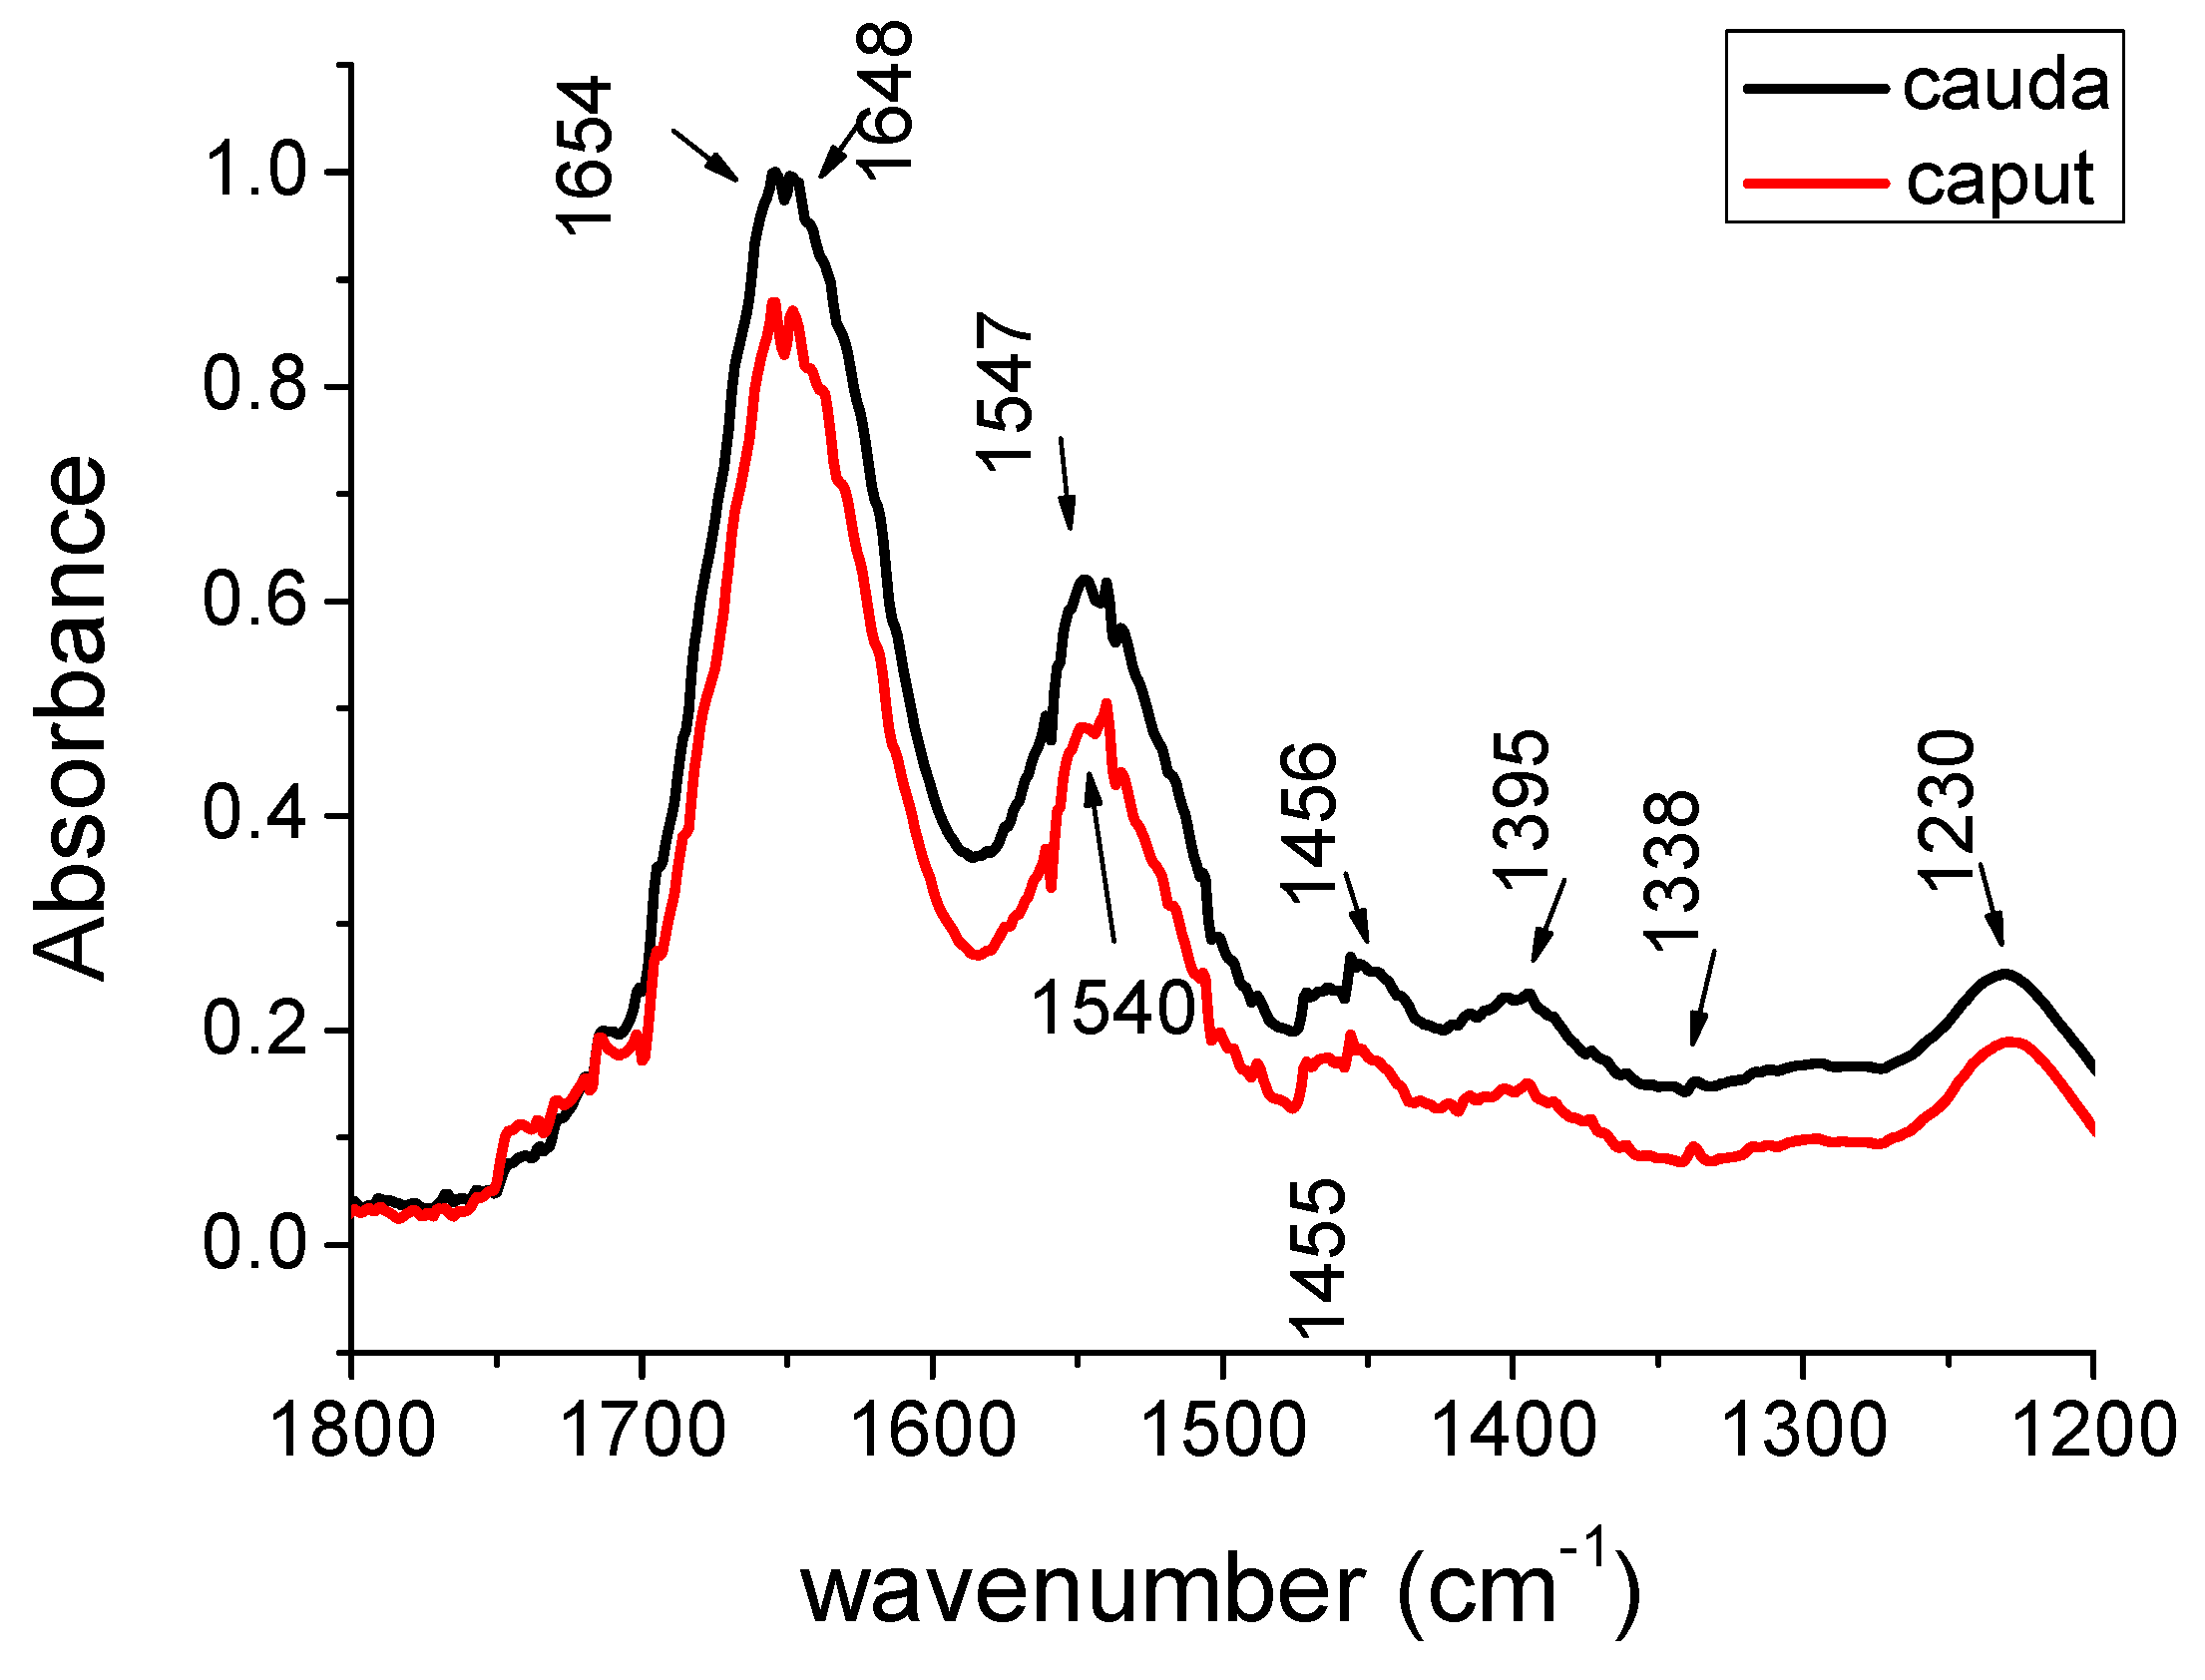
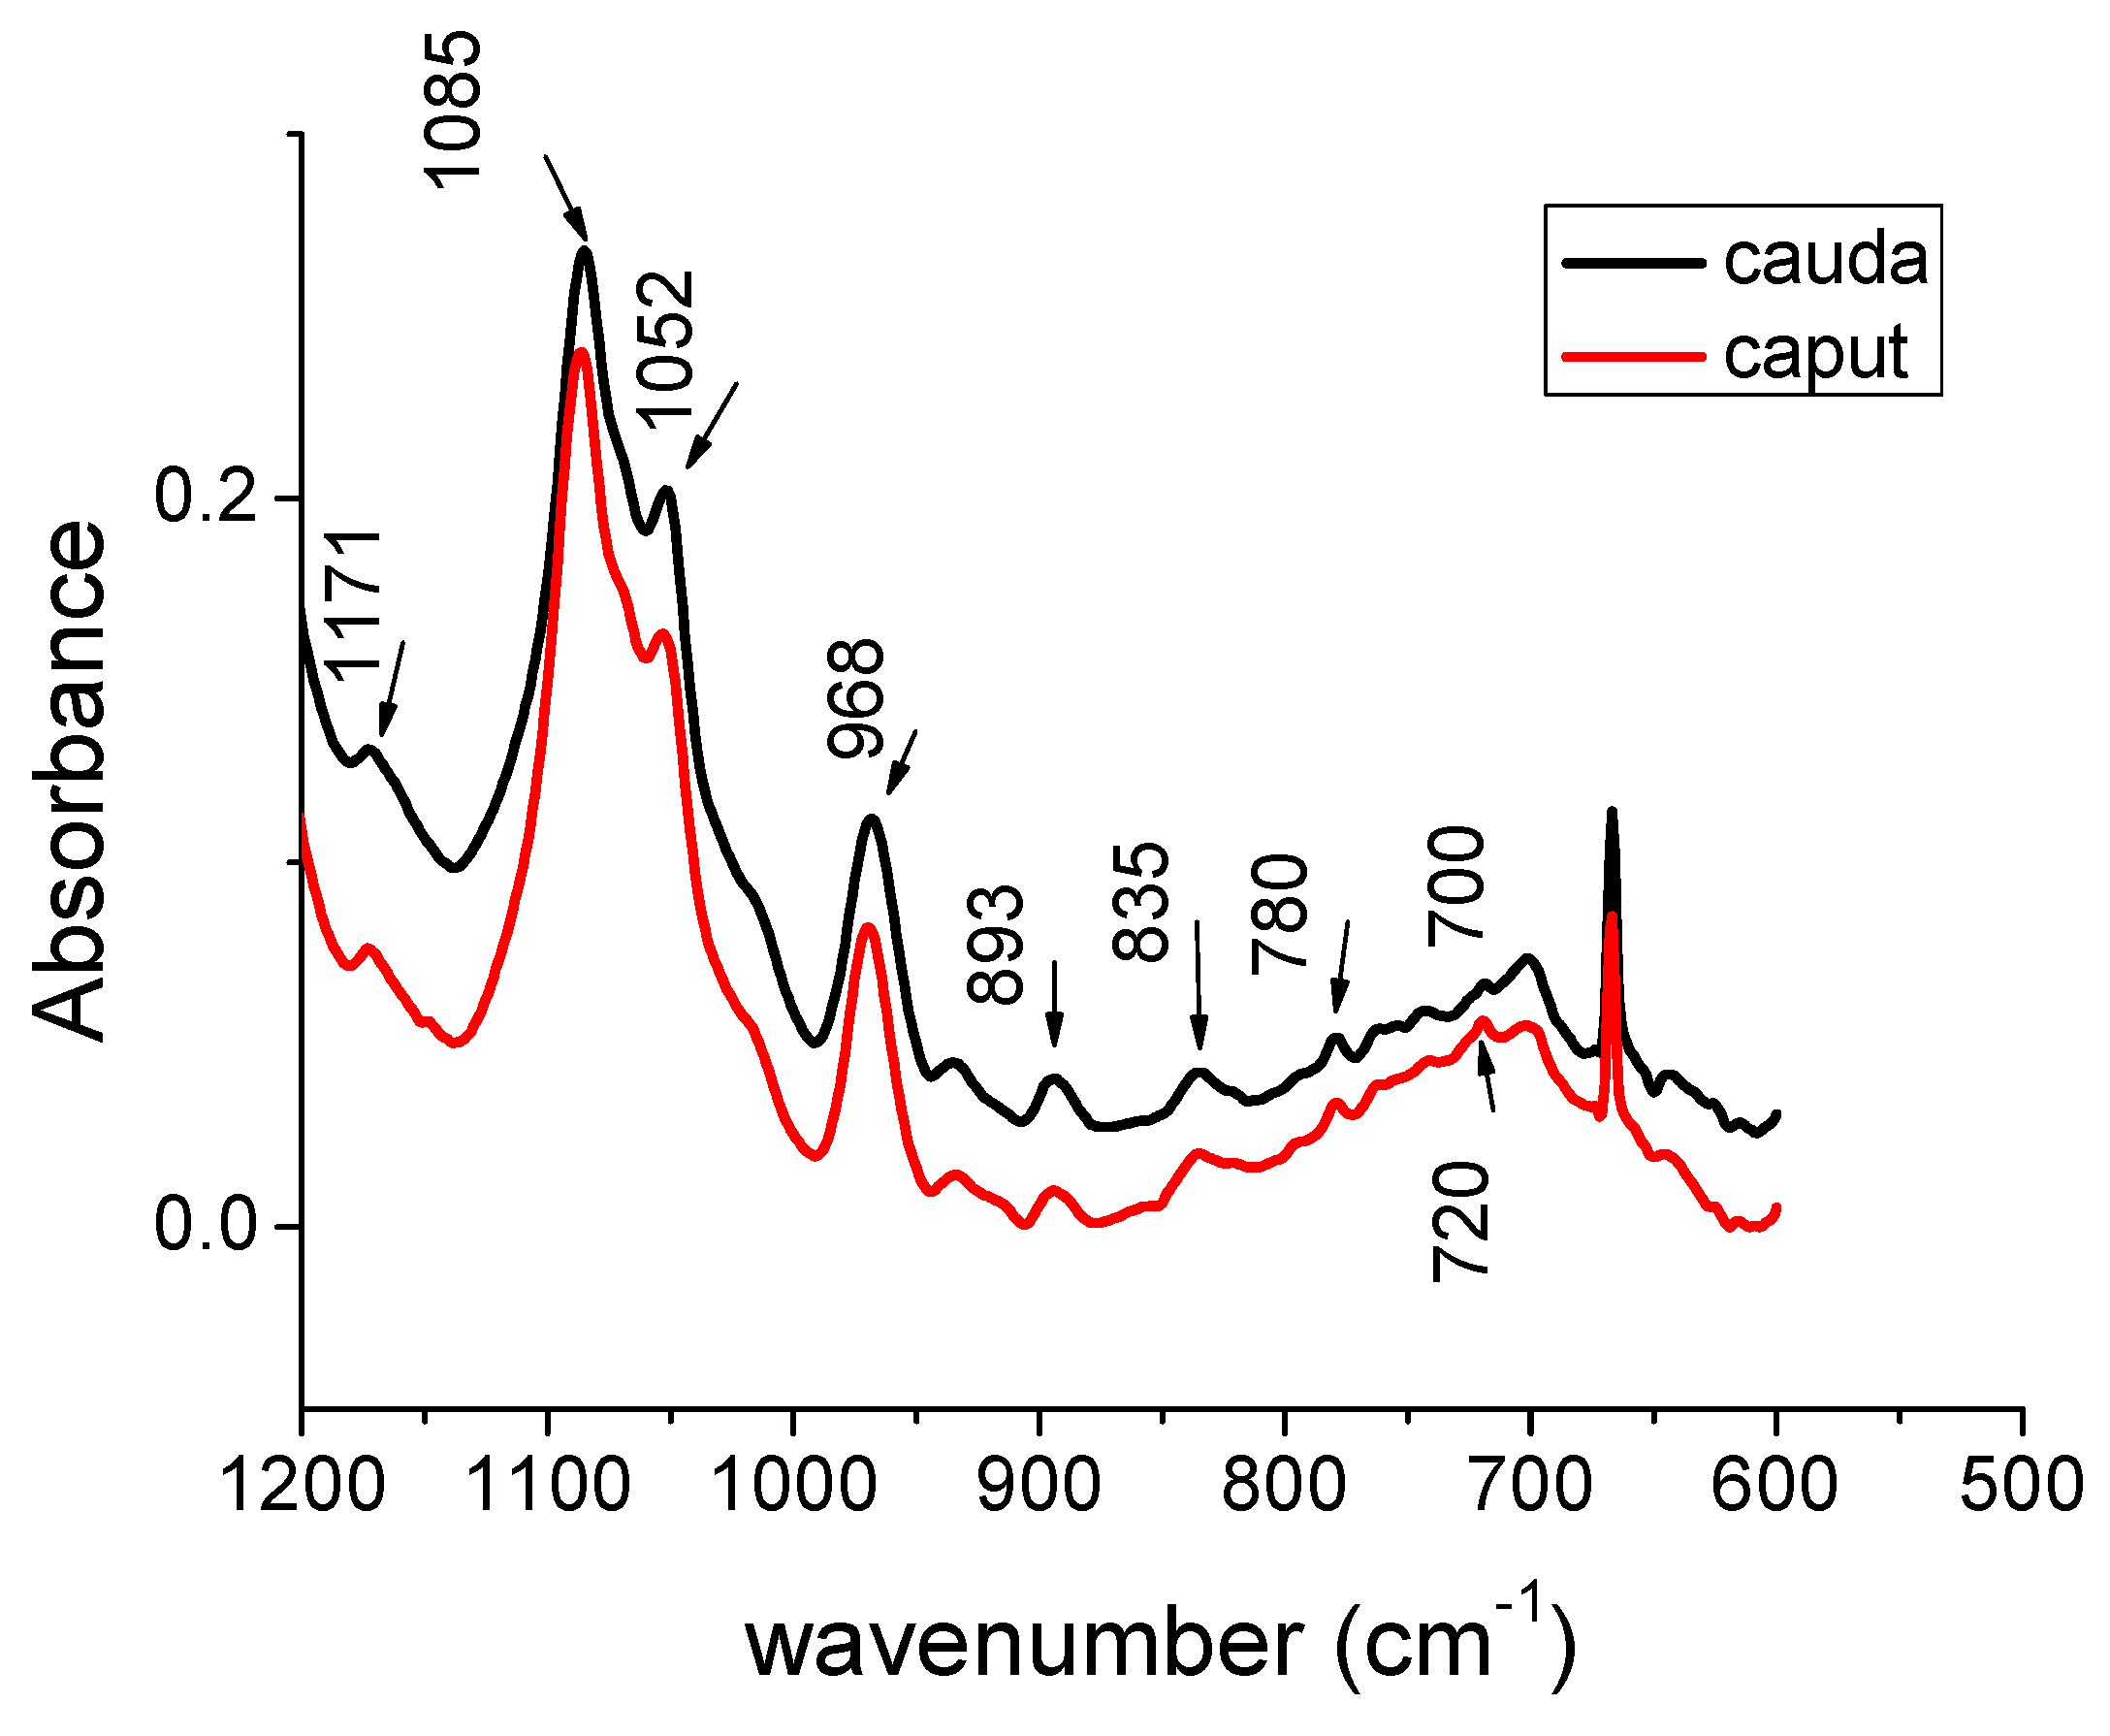
The µFT-IR average spectra of mouse SPZ samples from caput and cauda epididymis (caput and cauda SPZ) were obtained in the 4000–600 cm−1 range. The peak position and band assignments were done in agreement with [6]. In order to evidence the differences occurring between the two spectra, they were divided into four wavenumber ranges: 3600–3000 cm−1 (Figure 1), 3050–2800 cm−1 (Figure 2), 1800–1200 cm−1 (Figure 3) and 1200–600 cm−1 (Figure 4).
Figure 1 shows the average µFT-IR spectra of caput and cauda SPZ in the range of 3600–3000 cm−1. In this range, there is the large contribution of amide A band (located at 3309 and 3290 for caput and cauda SPZ, respectively) due to N-H and O-H stretching modes of proteins and intermolecular H bonding. It is worth noting that the shape of this band changes between caput and cauda samples. In particular, for caput SPZ, the maximum is located at ~3400 cm−1; conversely, for cauda SPZ, the maximum is located at 3290 cm−1. A very weak contribution ~3070 cm−1 can be noticed only in the case of cauda samples and can be attributed to the N-H stretching of amide B. In order to analyze the changes in the lipid content of caput and cauda SPZ, the spectral region from 3050 to 2800 cm−1 was considered (Figure 2). In this region, it is possible to evidence the contributions of CH3 asymmetric stretching (located at 2957 and 2959 cm−1 for caput and cauda samples, respectively), CH2 asymmetric stretching (located at 2922 and 2924 cm−1 for caput and cauda samples, respectively), CH3 symmetric stretching (located at 2875 cm−1 for both caput and cauda samples) and CH2 symmetric stretching (located at 2851 and 2853 cm−1 for caput and cauda samples, respectively). It is important to note that the two spectra are largely different in shape and relative intensity of the main peaks, even though the position of the different CH2 and CH3 contribution does not change in a crucial way. In particular, the position of CH2 symmetric stretching does not show significant changes, taking into account the spectral resolution of our equipment (4 cm−1). This can indicate that no important changes in membrane fluidity occur [7]. In this region of the spectra, a contribution at 3013 cm−1 is also present which is more evident for caput SPZ samples. This band is usually assigned to an olefinic functional group in unsaturated lipids, mainly due to C-H stretching mode. This band can be used for further investigating lipid peroxidation in tissue [8].
In Figure 3, the 1800–1200 cm−1 region of µFT-IR spectra of caput and cauda SPZ is reported. In this region, the main contributions are due to protein content. In particular, the band due to the Amide I C=O stretching is positioned ~1650 cm−1 for the two different samples; however, differences can be noted in the band’s shape. In Figure 3, the contributions of Amide II (at 1540 and 1547 cm−1 for caput and cauda samples, respectively) and Amide III (at 1300 cm−1 for both caput and cauda samples) are present. The small band positioned at 1455 and 1456 cm−1 for caput and cauda samples, respectively, can be due to CH3 asymmetric bending and CH2 scissoring mode that can be associated with lipid and protein contents. At 1395 cm−1, a small feature can be noticed and it can be attributed to COO- symmetric stretching vibration mode related to fatty acids. The band located at 1230 cm−1 is due to PO2- asymmetric stretching mode related to nucleic acids and phospholipids contributions.
In Figure 4, the region of short wavenumber (1200–600 cm−1) of µFT-IR spectra of caput and cauda SPZ is shown. This region is mainly related to DNA contributions. The most important ones are located at 1085 (PO2 symmetric stretching) and 1052 cm−1 (C–O stretching). In this region too, differences can be noted in the band shape. Additionally, the other structures positioned at 968 cm−1 (C–C stretching), 893 cm−1 (deoxyribose ring), 835 cm−1 (S-type sugar) are attributed to DNA. A complete list of the peak position and band assignments is reported in Table 1.

4. Conclusions

The results reported here indicate that µFT-IR spectroscopy can constitute a useful tool for investigated changes occurring in SPZ from caput and cauda epididymis of mice in a rapid and easy way. Biochemical changes in protein, nucleic acid, lipid, and carbohydrate content of cells have been evidenced. Further work is in progress in order to quantitatively assess the observed differences.

Acknowledgments

This work was supported by Università della Campania “L. Vanvitelli” (Italy) under the project “Ricerca Scientifica di Dipartimento” (2017). The authors are pleased to thank Nadia Diano for useful discussions.

Conflicts of Interest

The authors declare that there is no conflict of interest.

Compliance with Ethical Standards

All applicable international, national, and/or institutional guidelines for the care and use of animals were followed.

References

  1. Baker, M.J.; Trevisan, J.; Bassan, P.; Bhargava, R.; Butler, H.J.; Dorling, K.M.; Fielden, P.R.; Fogarty, S.W.; Fullwood, N.J.; Heys, K.A.; et al. Using Fourier transform IR spectroscopy to analyze biological materials. Nat. Protoc. 2014, 9, 1771–1791. [Google Scholar] [PubMed]
  2. Shivanoor, S.M.; David, M. Fourier transform infrared (FT-IR) study on cyanide induced biochemical and structural changes in rat sperm. Toxicol. Rep. 2015, 2, 1347–1356. [Google Scholar] [CrossRef] [PubMed]
  3. Sánchez, V.; Redmann, K.; Wistuba, J.; Wübbeling, F.; Burger, M.; Oldenhof, H.; Wolkers, W.F.; Kliesch, S.; Schlatt, S.; Mallidis, C. Oxidative DNA damage in human sperm can be detected by Raman microspectroscopy. Fertil. Steril. 2012, 98, 1124–1129. [Google Scholar] [CrossRef] [PubMed]
  4. Marciani, S.; Tamburrino, L.; Muratori, M.; Baldi, E. Epididymal sperm transport and fertilization. In Endocrinology of the Testis and Male Reproduction Endocrinology 1; Simoni, M., Huhtaniemi, I.T., Eds.; Springer International Publishing AG: Berlin/Heidelberg, Germany, 2017; pp. 457–478. [Google Scholar]
  5. Cooper, T.G. Epididymis. In Enciclopedia of Reproduction; Knobil, E., Neill, J.D., Eds.; Academic Press: Cambridge, MA, USA, 2003; pp. 1–17. [Google Scholar]
  6. Portaccio, M.; d’Apuzzo, F.; Perillo, L.; Grassia, V.; Errico, S.; Lepore, M. Infrared microspectroscopy characterization of gingival crevicular fluid during orthodontic treatment. J. Mol. Struct. 2019, 1176, 847–854. [Google Scholar] [CrossRef]
  7. Liu, K.Z.; Schultz, C.P.; Mohammad, R.M.; Johnston, J.B.; Mantsch, H.H. Infrared spectroscopic study of bryostatin 1-induced membrane alterations in a B-CLLcell line. Leukemia 1999, 13, 1273–1280. [Google Scholar] [CrossRef] [PubMed]
  8. Severcan, F.; Gorgulu, G.; Gorgulu, S.T.; Guray, T. Rapid monitoring of diabetes-induced lipid peroxidation by Fourier transform infrared spectroscopy: Evidence from rat liver microsomal membranes. Anal. Biochem. 2005, 339, 36–40. [Google Scholar] [CrossRef] [PubMed]
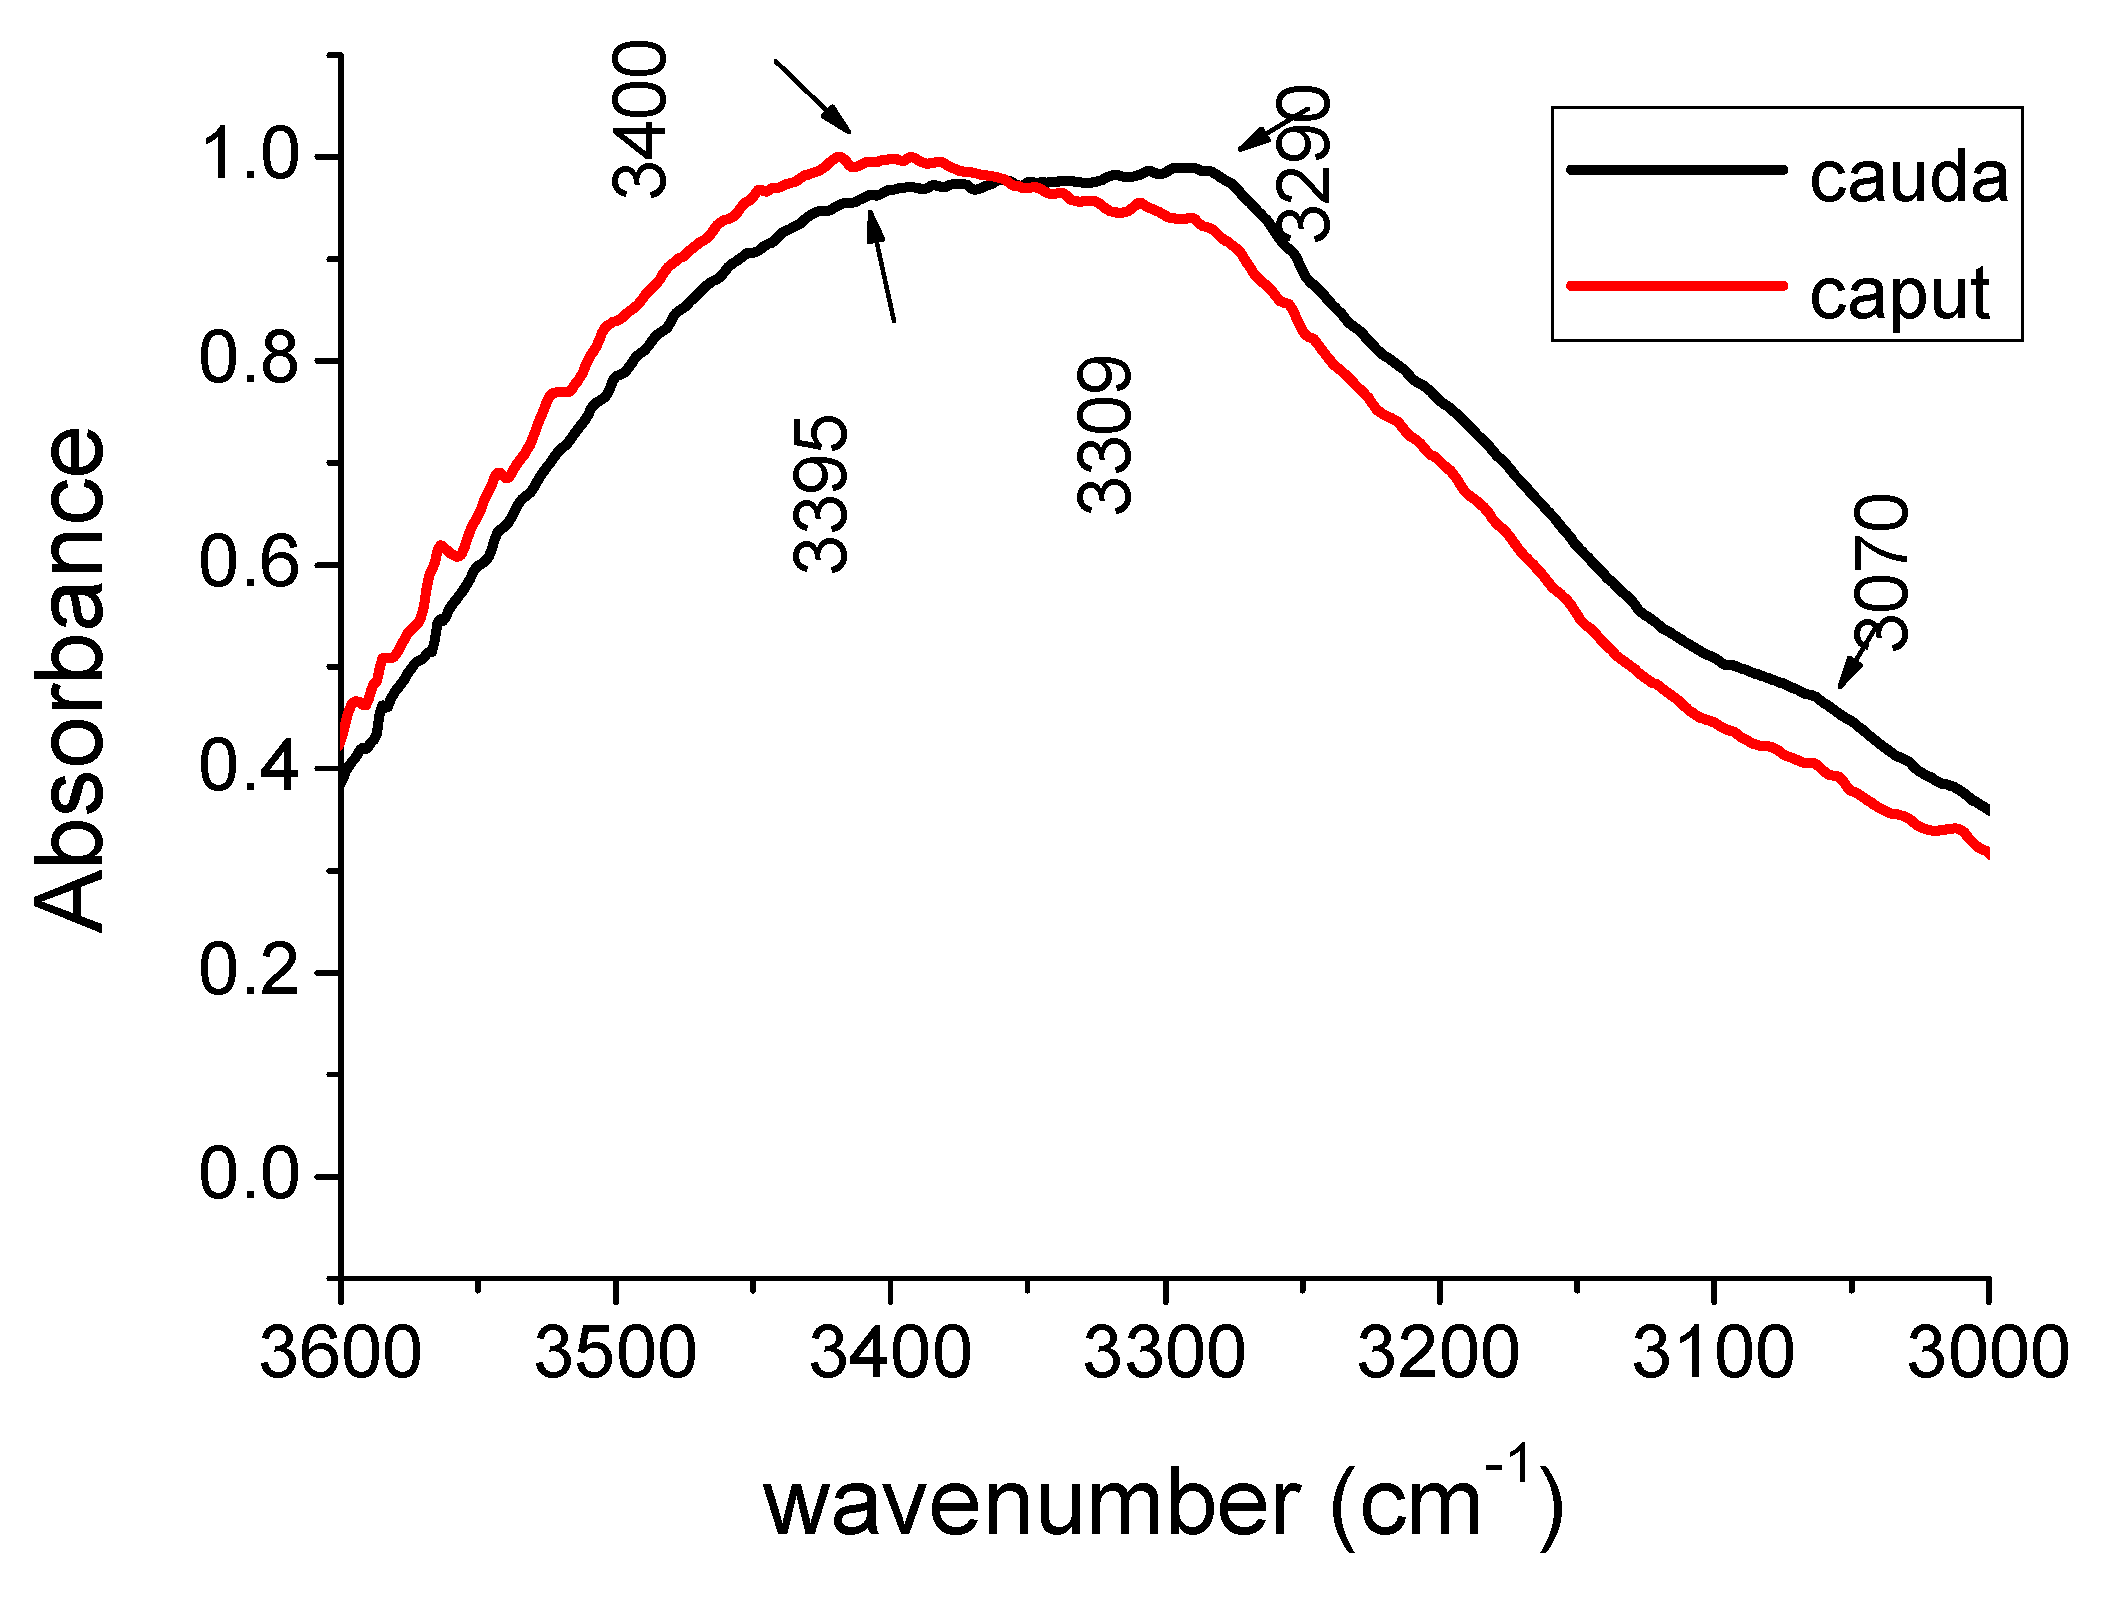
Figure 1. FT-IR spectra of caput and cauda sperm of WT mouse in 3600–3000 cm−1 region.
Proceedings 42 00019 g001
Figure 2. FT-IR spectra of caput and cauda sperm of WT mouse in 3050–2800 cm−1 region.
Proceedings 42 00019 g002
Figure 3. FT-IR spectra of caput and cauda sperm of WT mouse in 1800–1200 cm−1 region.
Proceedings 42 00019 g003
Figure 4. FT-IR spectra of caput and cauda sperm of WT mouse in 1200–600 cm−1 region.
Proceedings 42 00019 g004
Table 1. Mode assignments for the FT-IR frequency values in caput and cauda sperm samples, abbreviation: as = asymmetric, s = symmetric, ν = stretching, vbr = vibration, b = bending, scis = scissoring.
Peak caput cm−1Peak cauda cm−1Peak AssignmentsBiochemical Molecules
34003395Hydrogen bonded O-H N-Hprotein water
33093290Amide A N-Hprotein
30133013olefinic = C-Hunsaturated lipid
29572959CH3 aslipid
29222924CH2 aslipid
28752875CH3 slipid
28512853CH2 slipid
16541654Amide I-helixprotein
16481648Amide Iprotein
15401547Amide IIprotein
14551456CH3 as bCH2 scislipid and protein
13951395COO- sfatty acid
13001300Amide IIIprotein
12301230PO2- asnucleic acids and phospholipids
11711171CO-O-Cglycogen
10851085PO2- snucleic acids
10521052C-Osaccharides and DNA deoxyribose
968968C-CDNA backbone
893893Deoxyribose ringDNA
835835DNA S-type sugarDNA
Publisher’s Note: MDPI stays neutral with regard to jurisdictional claims in published maps and institutional affiliations.