Proceeding Paper

Rapid, Wide-Range, and Low-Cost Determination of Formaldehyde Based on Porous Silica Gel Plate by Digital Image Colorimetry †

State Key Laboratory of Precision Spectroscopy, East China Normal University, Shanghai 200062, China
*
Author to whom correspondence should be addressed.
Presented at the 6th International Electronic Conference on Sensors and Applications, 15–30 November 2019; Available online: https://ecsa-6.sciforum.net/.
Proceedings 2020, 42(1), 13; https://doi.org/10.3390/ecsa-6-06542
Published: 14 November 2019

Abstract

:
A porous silica gel plate impregnated with a colorimetric reagent, 4-amino-3-penten-2-one (Fluoral-P) has been fabricated for the first time to determinate formaldehyde. The reaction of formaldehyde and Fluoral-P produced a yellow product 3,5-diacetyl-1,4-dihydrolutidine (DDL), which was further photographed by a smartphone. A good linear relationship has been found between the intensity of blue component from the digital image and formaldehyde concentration in the range of 0–50 mg L−1 with low detection limit of 2.2 ± 0.1 mg L−1. A good precision in the range of 0.59–7.75%RSD and an accuracy with the relative error of +3.7% from control samples are also obtained. These results demonstrate that our developed low-cost sensor, together with digital image colorimetry, has potential for sensitively and quickly measuring formaldehyde.

1. Introduction

Formaldehyde is a toxic substance, which can cause serious damages to human eyes, skin, and respiratory organs and even lead to loss of the function of nervous system, as well as ear, nose, and laryngeal cancers [1]. It has been classified as a human carcinogen by the International Agency for Research on Cancer (IARC) in 2006 [2]. Due to its preservative and fresh-keeping properties, formaldehyde has been inappropriately used in various foods to extend its shelf life, which results in a higher concentration of formaldehyde in food that exceeds what is deemed natural (e.g., 3.3–60 mg kg 1 in fruits and vegetables, 1–98 mg kg 1   in   fish , 8–20 mg kg 1 in meat, 1–3.3 mg kg 1 in milk) [3]. Therefore, rapid, convenient, and cost-effective determination of formaldehyde is of great significance for protecting human health.
So far, a large number of techniques have been reported for the determination of formaldehyde, including gas chromatography (GC) [4] and high-performance liquid chromatography (HPLC) [5]. These analytical laboratory methods usually need the large and expensive instruments, which are not suitable for the portable in-field detection of formaldehyde. Colorimetric methods provide a competitive choice because of their fast response, visual detection, low cost, and ease of handling. These methods are typically based on the entrapment or impregnation of colorimetric reagents within porous materials, such as porous glass [6], sol-gel matrix [7], or porous silica gel plate [8]. However, a colorimetric sensor based on spectrophotometric methods usually requires a spectrophotometer for the quantitative analysis of formaldehyde, which could limit the field applications of an analytical method.
Recently, digital image colorimetry (DIC) has attracted a lot of attention. Based on the analysis of basic RGB values (Red Green Blue data) obtained from the digital images of colorimetric products, DIC has shown the advantages of low cost in fast and in-field quantitative determinations [9]. In brief, the images are taken from a digital camera, such as the built-in digital camera in a mobile phone [10] or digital single-lens reflex camera [11], and their RGB data will be analyzed by a color analysis program (e.g., Matlab and Adobe Photoshop) [12]. The individual RGB values can then be inspected in order to produce a calibration curve for the quantitative determination of the interested analyte.
In this work, the porous silica gel plates have been used for the first time to determinate formaldehyde in combination with DIC method. The sensing elements were fabricated by impregnating the porous silica gel plate with the reagent of 4-amino-3-penten-2-one (Fluoral-P), which is well known to be sensitive and selective to formaldehyde. By this method, a rapid, simple, wide-ranging, and cost-effective determination of formaldehyde has been achieved, indicating a promising and practical application for the in-field detection of formaldehyde.

2. Materials and Methods

2.1. Materials

All reagents were used without any further purification. Formaldehyde solution (37%) was purchased from Macklin Biochemical Co., Ltd. (Shanghai, China). Porous silica gel plates were purchased from Qingdao Haiyang Chemical Co., Ltd. (Qingdao, China). 4-amino-3-penten-2-one (Fluoral-P, 98%) was purchased from Aladdin (Shanghai, China).

2.2. Preparation of the Sensing Elements

The porous silica gel plates were cut into 1.5 cm × 1.5 cm chips. The chips were first immersed in the saturated solution of Fluoral-P in acetonitrile and then dried in a vacuum oven to remove the acetonitrile. After cooling to the room temperature, the sensing elements were put into a self-sealing bag to avoid the contamination and then stored in a refrigerator at 4 °C for further use.
The morphology of the sensing elements was investigated using a scanning electron microscope (SEM) (Phenom G2 Pro, Phenom-World BV, Eindhoven, The Netherlands).

2.3. Colorimetric Test of Formaldehyde

The standard working solutions with different concentrations from 1 mg L 1 to 2500 mg L 1 were prepared from formaldehyde stock solution (37%) in deionized water. Then, 40 μ L of each standard working solution was dripped evenly on the surface of the sensor chips. The resultant yellow products were then photographed by using the built-in digital camera of a HUAWEI P10. Each colorimetric test was repeated five times across all prepared standard concentrations, and each resultant color was photographed three times by the same digital camera. Finally, the average RGB values from a total of 15 images for each standard concentration were analyzed by Matlab.

2.4. Photographic System and Procedure

A home-built photographic box, as shown in Figure 1, was used throughout the experiments [13]. In brief, the box (30 cm × 30   cm   × 25   cm ) was made of opaque plexiglass plates with a white background inside in order to get the same light conditions for all tests. Four sets of light emitting diode arrays were placed around the box as the light sources. The outside of the box was pasted with a reflective film to reduce any negative effect from environmental light. A small hole ( Φ = 1.5   cm ) was made at the top of box, and the RGB values of colorimetric products were detected from the hole by using the built-in digital camera of a HUAWEI P10.
The digital camera was set to automatic white balance and flash off, with high dynamic range (HDR) off. Each image was about 2.76 MB (5120 × 3840 -pixel) in size and saved in JPEG format (24-bits). Then, the images were analyzed by Adobe Photoshop and Matlab. The images were first cut into 150 × 150 -pixel by Adobe Photoshop, and then the RGB values were analyzed by a Matlab program. The average RGB intensities from all three images for each of five sensors were used as the single data point to establish the calibration curves.

2.5. Analytical Performance and Method Validation

We have investigated the analytical performance including sensitivity, linearity, linear range, limit of detection (LOD), limit of quantification (LQD), precision, and accuracy. The LOD and LQD were calculated by using the standard methods (LOD = 3.3   S B l /k and LQD = 10   S B l /k, where S B l is the standard deviation of blank from 10 analyses and k represents the slope of the calibration curve) [14]. The precision was expressed as percentage of the relative standard deviation for each color from three images for each of five sensors (n = 15). The accuracy was evaluated as the percentage relative error by analyzing the known standard formaldehyde concentration (15 mg   L 1 ) against the established standard curve.

3. Results and Discussion

3.1. Characterization of Silica Gel Plates and Preparation of the Sensing Elements

The SEM images of silica gel plates are shown in Figure 2. Large pores with about 2 μ m average pore size have been observed in the silica gel plates. It is noticed that the porous structure can help to entrap the Fluoral-P molecules and facilitate the penetration of Fluoral-P into the sensing elements, so that formaldehyde can react with the entrapped Fluoral-P molecules.
The porous silica gel plates were cut into 1.5 cm × 1.5 cm chips, and the sensing elements were prepared by entrapping the colorimetric reagent within the chips. The chips were immersed in the saturated solution of reagent and then dried in vacuum oven to remove the acetonitrile. By using this method, a good precision of 0.20–2.10% RSD from five sensor chips has been achieved, which shows a good uniformity of the sensing elements.

3.2. Colorimetric Test of the Sensing Elements

Colorimetric test of formaldehyde is based on the specific reaction between formaldehyde and Fluoral-P, which has been widely used in formaldehyde sensors [15]. A yellow product, named 3,5-diacetyl-1,4-dihydrolutidine (DDL), is produced by this reaction. With the increase of formaldehyde concentration, the color of the yellow products becomes darker, as shown in Figure 3.

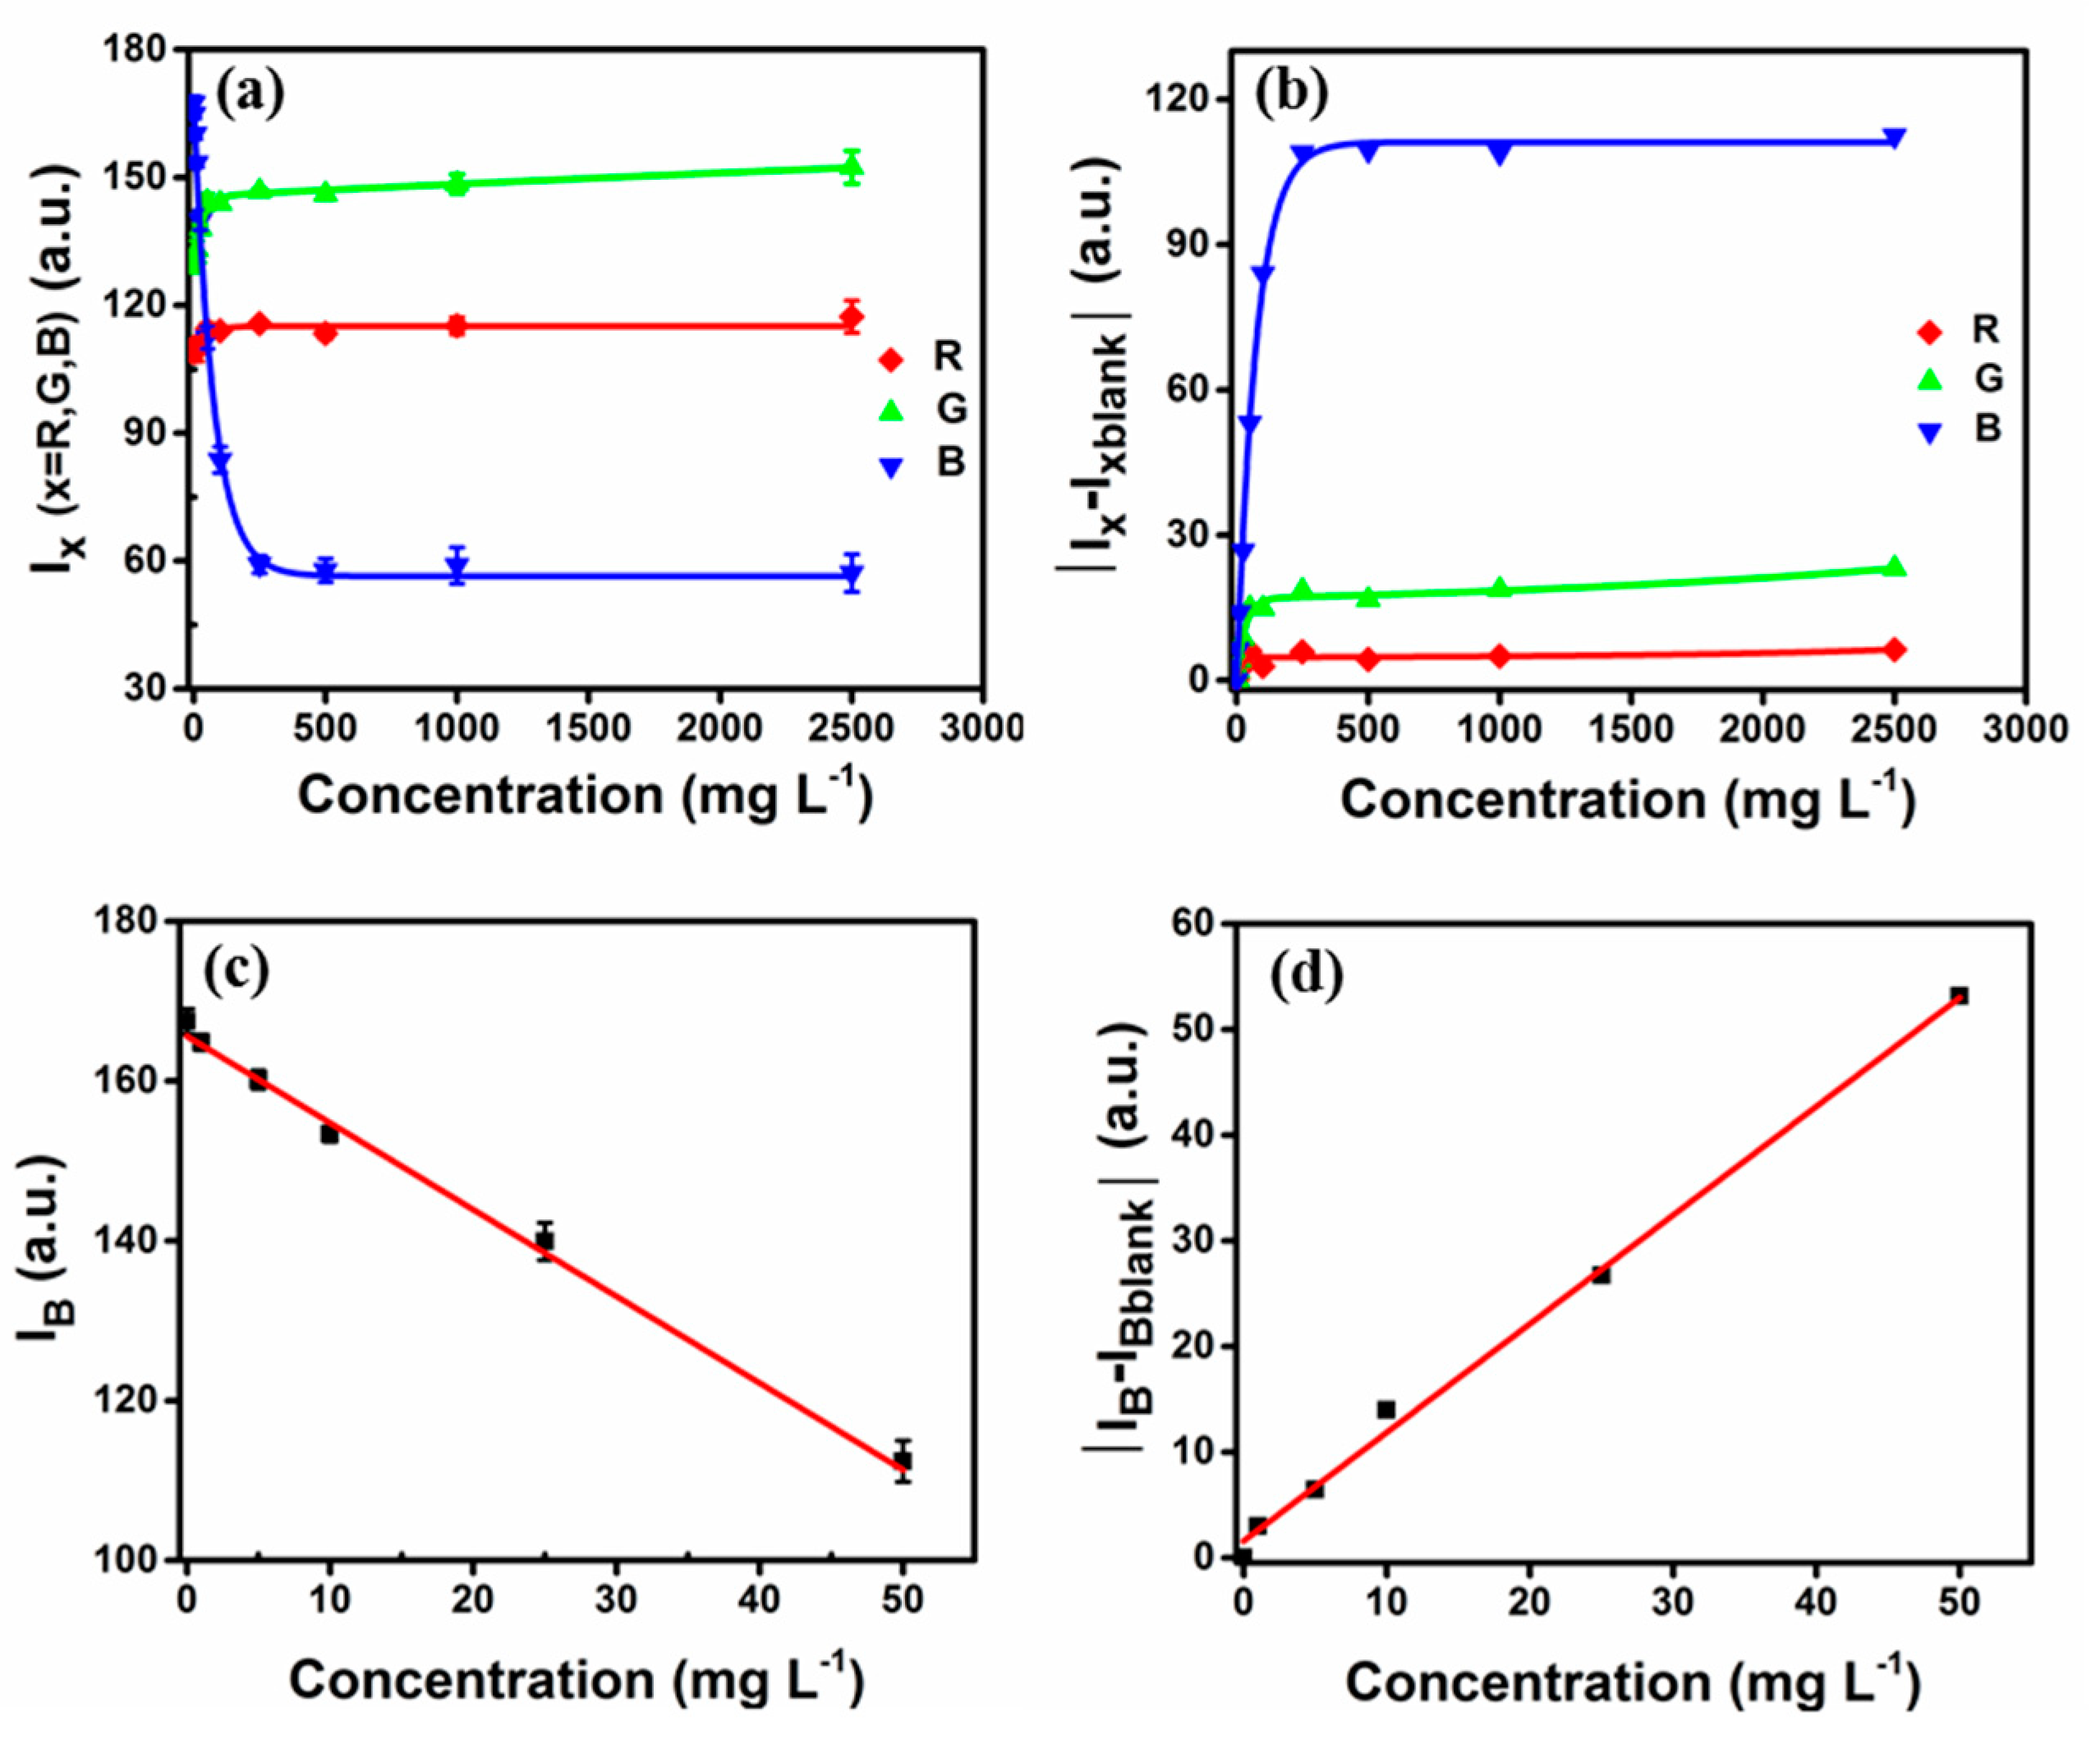
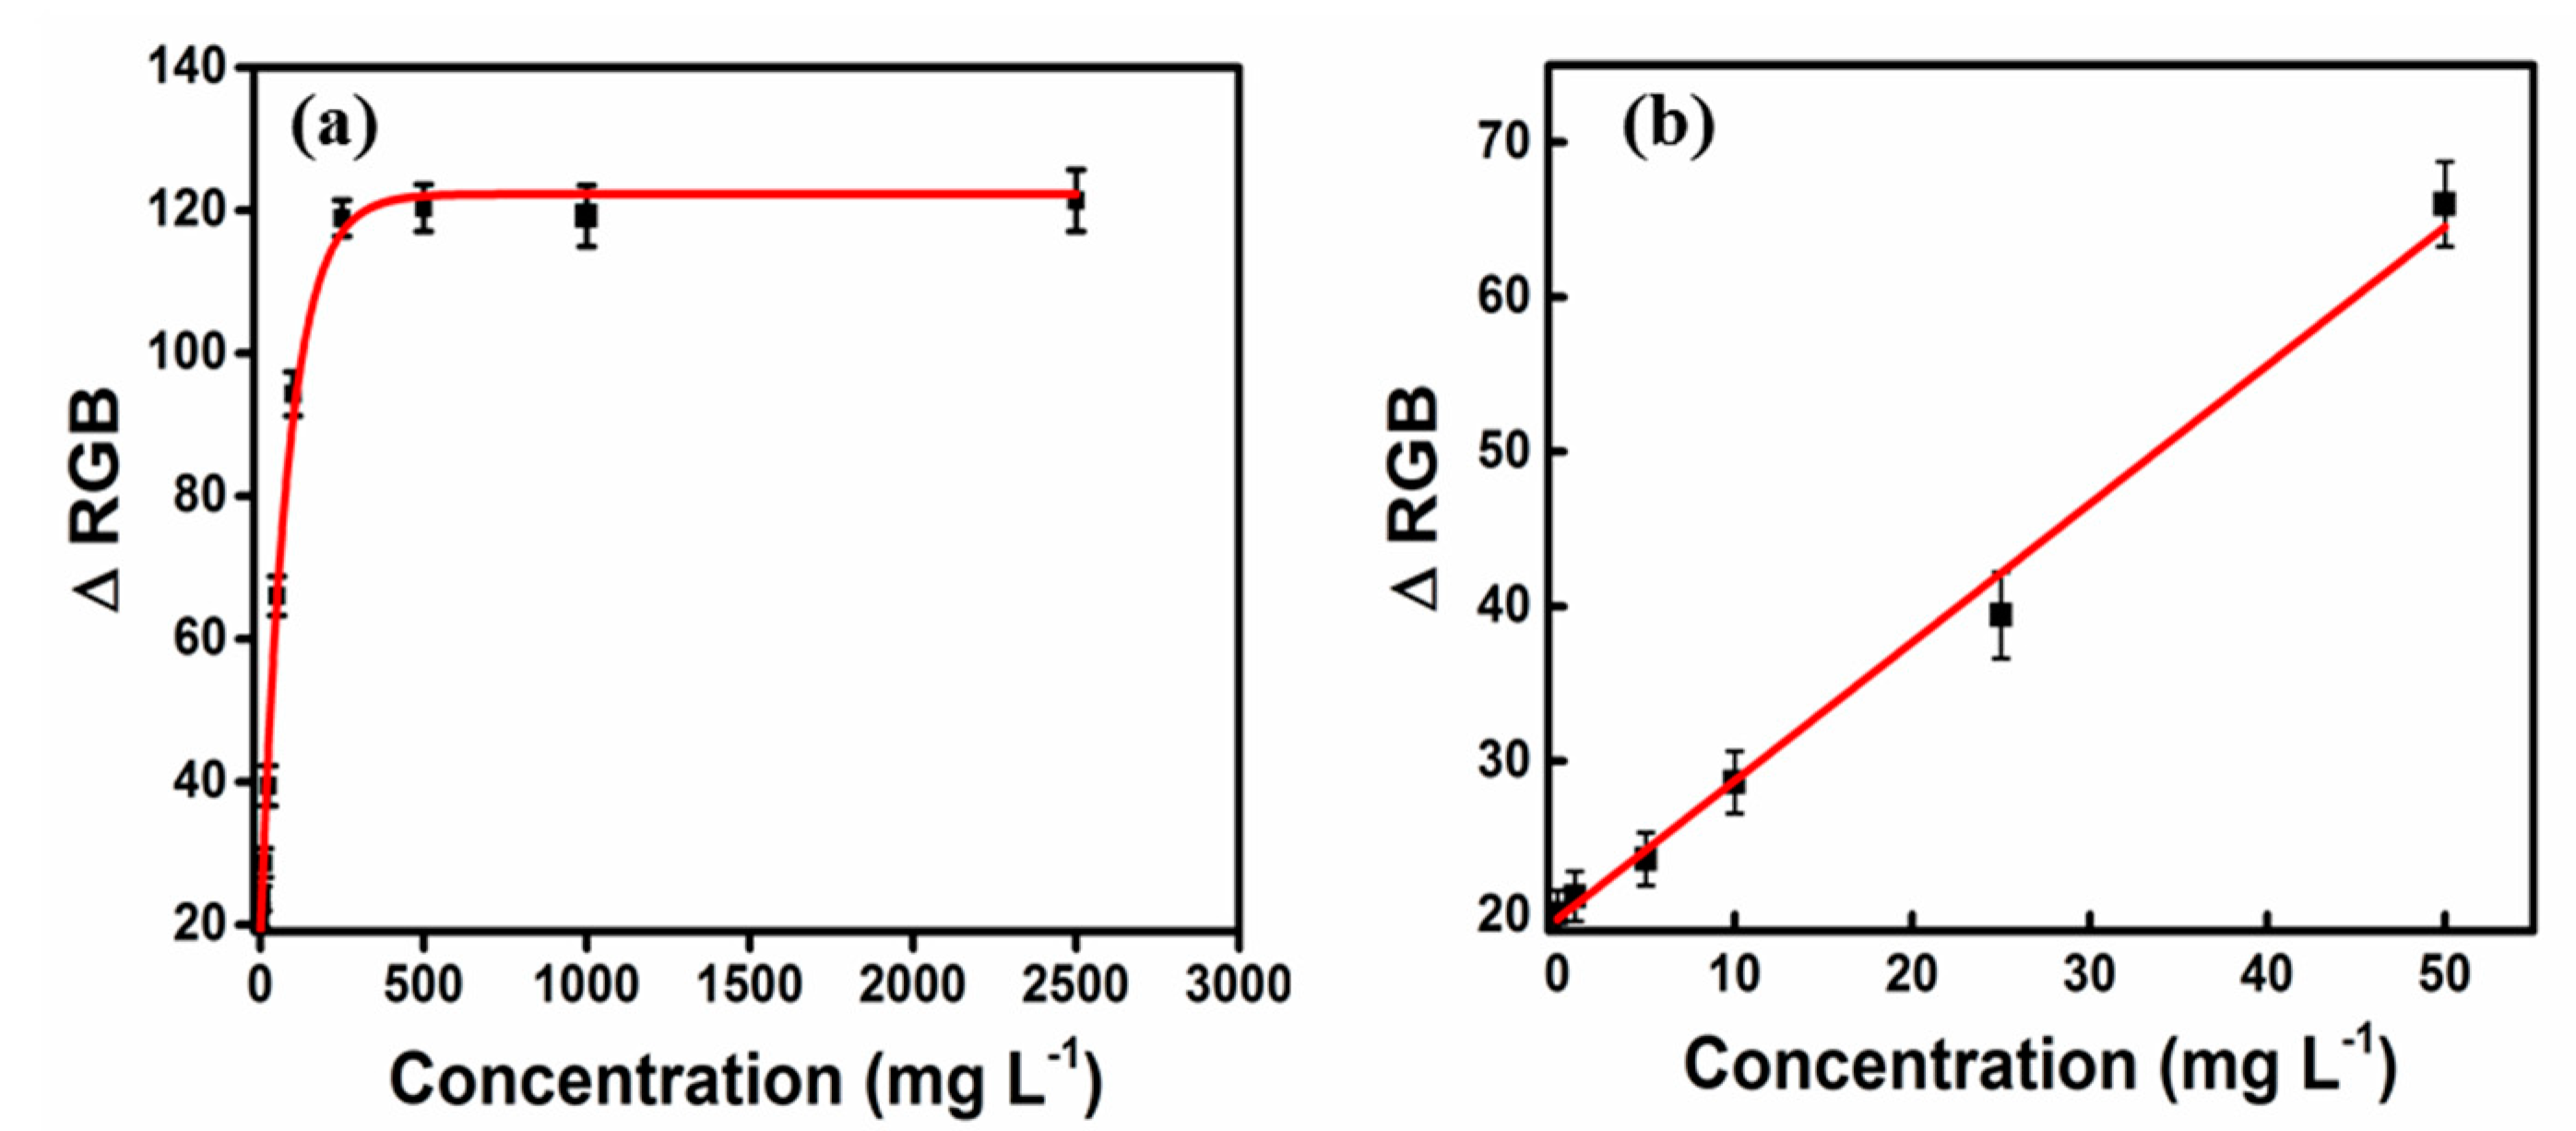
3.3. Digital Image Analysis for Quantification of Formaldehyde

The images of the colorimetric products from the reaction between formaldehyde and Fluoral-P were obtained by using the built-in digital camera of HUAWEI P10. The RGB data were then analyzed by a Matlab program. The relationship between the intensities of RGB components and formaldehyde concentrations is shown in Figure 4a.
The intensity of blue component decreases gradually with formaldehyde increasing, while the intensities of red and green components have a trend to be constant. These results indicate that the yellow products absorb light in the blue channel (400–500 nm), which is in accordance with the absorption peak of DDL around 412 nm [16]. With the increase of formaldehyde concentration, more yellow products are generated while more blue light are absorbed, which provides less intensities.
The blank-subtracted intensities of RGB components vs. formaldehyde concentrations is shown in Figure 4b. The intensity of blue component increases with formaldehyde concentration, while those are nearly constant for the red and green components. These results indicate that the blue light causes the greatest difference between the color of the products and the blank. The blank-subtracted intensity of the blue component may be more suitable for the condition that the color of the samples can interfere with the observation of the colored products [17].
Figure 4c illustrates a good linear relationship between the intensity of blue component and formaldehyde concentration in the range of 0–50 mg L 1 , as well as blank-subtracted intensity of blue component illustrated in Figure 4d, whose range is much wider than previously reported (0–25 mg L 1 ) [12], showing a good performance in formaldehyde determination.
The RGB distance, Δ RGB , is also calculated using the following equation [18]:
Δ RGB = ( I R I R 0 ) 2 + ( I G I G 0 ) 2 + ( I B I B 0 ) 2 ,
where   I R , I G and I B represent the average intensities of red, green and blue components, respectively. I R 0 , I G 0 and I B 0 is the RGB values of initial background images. As shown in Figure 5a, the Δ RGB increases dramatically with increasing formaldehyde concentration in the range of 0–250 mg L 1 , and then saturated at higher concentrations. At formaldehyde concentrations below 50 mg L 1 , a good linear relationship between Δ RGB and formaldehyde concentration has also been found, as shown in Figure 5b, which means Δ RGB can also been used for the detection of formaldehyde.

3.4. Analytical Performance and Method Validation

The calibration equations, linearity, linear range, LOD, and LQD are summarized in Table 1. I B , | I B I B B l a n k | and Δ RGB vs. formaldehyde concentrations are all found to be linear in the low concentration range (0–50 mg   L 1 ), which is much wider than previously reported [12]. The good linearity ( R 2 > 0.9892 ) means that all these curves can be used for the quantification of formaldehyde.
All these analytical methods show a good LOD ( < 2.7   mg   L 1 ) and LQD ( < 8.2   mg   L 1 ), which can be estimated to be about 0.7 mg   kg 1 and 2.0 mg   kg 1 in food respectively by using the reported method [12]. These analytical characteristics show a potential in sensitive detection of formaldehyde in food. Good precisions (n = 5) are obtained in the range of 0.59–7.75% RSD. When the control samples of 15 mg   L 1 are tested, the formaldehyde concentrations of 15.56 mg   L 1 , 16.95 mg   L 1 and 12.66 mg   L 1 with the relative errors of +3.7%, +13.0% and 15.6% are obtained by using the calibration curves I B , | I B I B B l a n k | , and Δ RGB , respectively, indicating the method of using calibration curve I B has the best detection performance.

4. Conclusions

A colorimetric sensor for formaldehyde detection has been successfully developed. The sensor element was fabricated by impregnating a porous silica gel plate with 4-amino-3-penten-2-one (Fluoral-P), which makes the preparation of the sensor element simple and easy. When the sensor is used in conjunction with digital image colorimetry (DIC), the rapid, sensitive, and cost-effective determination of formaldehyde can be achieved. Different from spectrophotometric methods, which usually need a spectrophotometer, the DIC method needs only a digital camera, which makes formaldehyde detection very convenient. By using the developed method, a linear relationship has been obtained with a wide linear range (0–50 mg   L 1 ) and low detection limit (2.2 ± 0.1 – 2.7 ± 0.1 mg   L 1 ). This method also provides good precision in the range of 0.59–7.75% RSD with a relative error of +3.7%. These results indicate that the developed method can be an effective alternative for formaldehyde detection in fruits, vegetables, etc.

Author Contributions

The work presented in this paper was conducted in collaboration with all the authors. S.C. and J.X. provided the initial ideas. S.C. and Y.L. performed major part of the laboratory work. L.Z. and X.C. designed the photographic system. X.W. and M.Z. performed the data analysis. S.C. wrote the manuscript together with all other authors. J.C. and H.P. performed the review and editing.

Funding

This work was funded by the National Natural Science Foundation of China (No. 11674101).

Acknowledgments

The authors would like to thank Tianxiang Zheng for the help in mechanical aspect and Shanghai Key laboratory of Green Chemistry and Chemical Processes for providing scanning electron microscopy equipment.

Conflicts of Interest

The authors declare no conflict of interest.

References

  1. Chung, P.R.; Tzeng, C.T.; Ke, M.T.; Lee, C.Y. Formaldehyde Gas Sensors: A Review. Sensors 2013, 13, 4468–4484. [Google Scholar] [CrossRef] [PubMed]
  2. World Health Organization. Formaldehyde, 2-butoxyethanol and 1-tert-butoxypropan-2-ol. IARC Monogr Eval. Carcinog. Risks Hum. 2006, 88, 1–478. [Google Scholar]
  3. World Health Organization. Environmental Health Criteria 89 Formaldehyde; WHO: Geneva, Switzerland, 1989. [Google Scholar]
  4. Hopkins, J.R.; Still, T.; Al-Haider, S.; Fisher, I.R.; Lewis, A.C.; Seakins, P.W. A simplified apparatus for ambient formaldehyde detection via GC-pHID. Atmos. Environ. 2003, 37, 2557–2565. [Google Scholar] [CrossRef]
  5. Wahed, P.; Razzaq, M.A.; Dharmapuri, S.; Corrales, M. Determination of formaldehyde in food and feed by an in-house validated HPLC method. Food Chem. 2016, 202, 476–483. [Google Scholar] [CrossRef] [PubMed]
  6. Maruo, Y.Y.; Nakamura, J. Portable formaldehyde monitoring device using porous glass sensor and its applications in indoor air quality studies. Anal. Chim. Acta 2011, 702, 247–253. [Google Scholar] [CrossRef] [PubMed]
  7. Mariano, S.; Wang, W.; Brunelle, G.; Bigay, Y.; Tran-Thi, T.H. Colorimetric Detection of Formaldehyde: A Sensor for Air Quality Measurements and a Pollution-Warning Kit for Homes. Procedia Eng. 2010, 5, 1184–1187. [Google Scholar] [CrossRef]
  8. Lin, C.; Zhu, Y.; Yu, J.; Qin, X.; Xian, X.; Tsow, F.; Forzani, E.S.; Wang, D.; Tao, N. Gradient-Based Colorimetric Sensors for Continuous Gas Monitoring. Anal. Chem. 2018, 90, 5375–5380. [Google Scholar] [CrossRef] [PubMed]
  9. Rungroadsri, J.; Limsakul, W.; Wongniramaikul, W.; Choodum, A. Rapid Semi-Quantitative Analysis of Formaldehyde in Food by Digital Image Colorimetry. Int. J. Chem. Eng. Appl. 2017, 8, 294–298. [Google Scholar] [CrossRef]
  10. Choodum, A.; Kanatharana, P.; Wongniramaikul, W.; Daeid, N.N. Using the iPhone as a device for a rapid quantitative analysis of trinitrotoluene in soil. Talanta 2013, 115, 143–149. [Google Scholar] [CrossRef] [PubMed]
  11. Choodum, A.; Daeid, N.N. Rapid and semi-quantitative presumptive tests for opiate drugs. Talanta 2011, 86, 284–292. [Google Scholar] [CrossRef] [PubMed]
  12. Wongniramaikul, W.; Limsakul, W.; Choodum, A. A biodegradable colorimetric film for rapid low-cost field determination of formaldehyde contamination by digital image colorimetry. Food Chem. 2018, 249, 154–161. [Google Scholar] [CrossRef] [PubMed]
  13. Choodum, A.; Kanatharana, P.; Wongniramaikul, W.; Nicdaeid, N. A sol–gel colorimetric sensor for methamphetamine detection. Sens. Actuators B Chem. 2015, 215, 553–560. [Google Scholar] [CrossRef]
  14. Shrivastava, A.; Gupta, V.B. Methods for the determination of limit of detection and limit of quantitation of the analytical methods. Drug Discov. Ther. 2011, 2, 21–25. [Google Scholar] [CrossRef]
  15. Pinheiro, H.L.; de Andrade, M.V.; de Paula Pereira, P.A.; de Andrade, J.B. Spectrofluorimetric determination of formaldehyde in air after collection onto silica cartridges coated with Fluoral P. Microchem. J. 2004, 78, 15–20. [Google Scholar] [CrossRef]
  16. Wang, S.E. Spectrophotometric Method with Silica-Gel Beads for Determination of Trace Formaldehyde in Air. Spectrosc. Lett. 2005, 38, 121–130. [Google Scholar]
  17. Choodum, A.; Kanatharana, P.; Wongniramaikul, W.; Nicdaeid, N. Poly vinyl alcohol cryogel as a selective test kit for pre and post blast trinitrotoluene. Sens. Actuators B Chem. 2016, 222, 654–662. [Google Scholar] [CrossRef]
  18. Hoang, T.; Cho, Y.B.; Yong, S.K. A strip array of colorimetric sensors for visualizing a concentration level of gaseous analytes with basicity. Sens. Actuators B Chem. 2017, 251, 1089–1095. [Google Scholar] [CrossRef]
Figure 1. Diagram of the home-built photographic system for formaldehyde detection.
Proceedings 42 00013 g001
Figure 2. SEM images of silica gel plates at (a) 10,000 × and (b) 25,000 × . .
Proceedings 42 00013 g002
Figure 3. Colorimetric products from the reaction between Fluoral-P and various formaldehyde concentrations (0–2500 mg L 1 ) . .
Proceedings 42 00013 g003
Figure 4. Plots of (a) intensities and (b) blank-subtracted intensities of RGB components vs. formaldehyde concentrations. The relationship between (c) intensity/(d) blank-subtracted intensity of blue component and formaldehyde concentration in the range of 0–50 mg L 1 .
Proceedings 42 00013 g004
Figure 5. (a) Plot of Δ RGB vs. formaldehyde concentration. (b) The relationship between Δ RGB and formaldehyde concentration in the range of 0–50 mg L 1 .
Proceedings 42 00013 g005
Table 1. Calibration equations and analytical performance of the developed method in formaldehyde determination.
RelationshipCalibration Equation Y = a . u . ,   x = mg   L 1 Linearity
( R 2 )
Linear Range
( mg   L 1 )
LOD
( mg   L 1 )
LQD
( mg   L 1 )
I B y = ( 1.09 ± 0.05 ) x + ( 165.6 ± 0.7 ) 0.98920-50 2.2 ± 0.1 6.7 ± 0.3
| I B I BBlank | y = ( 1.03 ± 0.03 ) x + ( 1.57 ± 0.74 ) 0.99520-50 2.3 ± 0.1 7.1 ± 0.2
Δ RGB y = ( 0.90 ± 0.03 ) x + ( 19.78 ± 0.56 ) 0.99260-50 2.7 ± 0.1 8.2 ± 0.3
Publisher’s Note: MDPI stays neutral with regard to jurisdictional claims in published maps and institutional affiliations.

