1. Introduction
Grinding is considered one of most important steps in the machining process of advanced ceramics, as it gives the workpiece more accurate dimensional control and excellent finishing [
1]. However, the grinding operation contains many variables that must be considered in order to guarantee its efficiency, such as the contact of the grinding wheel abrasive grit with the workpiece surface, grinding forces, the machining environment, specific energy, and the grinding speed adjustment.
Advanced ceramics have been widely used in the manufacture of components with complex requirements, in which high performance materials are required due to their excellent properties, such as high temperature resistance, low thermal expansion coefficient, chemical stability, and wear endurance [
2]. Because advanced ceramics, such as aluminum oxide, silicon nitride, zirconia and alumina have high hardness and friability, they present challenges when subjected to manufacturing processes, especially to grinding [
3].
Monitoring the ceramic grinding process aims to better control the component quality, among others, since it is a process that provides a combination of superior finish and tight dimensional tolerance, as the main requirements. According to Ma et al. [
4], surface roughness is the main output parameter employed to evaluate the quality of a machined component. However, this direct method of measuring, besides its destructive characteristics, requires process interruption, and thus is excessively time-consuming when performed. Because of these drawbacks, the indirect monitoring of surface quality, even to estimate surface quality, is welcome and can bring benefits. Indirect methods are based on the signal processing of sensors related to the variable of interest. These methods are most desirable since they enable real-time process analysis. The study of the wear of the grinding wheel during the ceramic grinding process was proposed by Nakai et al. [
1] using acoustic emission and power sensors together with the application of artificial neural networks.
According to Baptista et al. [
5], piezoelectric transducers have been used in recent decades in order to detect structural damage by means of signs related to the piezoelectric effect. This type of transducer has a large importance in many areas of process monitoring. The most commonly used piezoelectric transducers are the PZT (lead zirconate titanate) and macro-fiber composite (MFC) ceramics, which have thickness of some tenths of a millimeter. The signals from PZT sensors provides several kinds of information about the process they are monitoring. The estimation of roughness during the steel grinding process was proposed by Ribeiro et al. [
6] using low-cost piezoelectric diaphragms.
This work proposes the application of a low-cost piezoelectric transducer in the analysis of the surface quality of ceramic components during the grinding process. Time–frequency techniques, together with the ratio of power (ROP) parameter were used, which represents a novel approach for the manufacturing field, as at the moment of writing we are yet to notice any published work on this topic. In order to verify the application of this technique, an acoustic emission (AE) sensor, consolidated in the monitoring of manufacturing processes was used. It is worth mentioning that the monitoring of the ceramic grinding process with low-cost piezoelectric transducers was not found in the literature.
2. Signal Processing
An alternative approach to frequency-domain analysis is short-time Fourier transform (STFT). This alternative consists in segmenting a time interval into short window subsequences, spaced by a uniform time interval, and its discrete Fourier transform (DFT) is calculated separately. With this method, it is possible to perform a more detailed analysis of the frequency spectrum [
7]. The result obtained is a two-dimensional representation of the signal in time and ist frequency. The time–frequency resolution can be adjusted by changing the window size. One of the parameters that analyzes the frequency spectrum of acoustic emission signals is the ROP. This parameter addresses the power ratio of a given frequency band with the total power of the analyzed spectrum [
8], which is defined in Equation (1).
From Equation (1), the denominator eliminates the local effect of power, where N is the block data size; and define the frequency range for the analysis and is the discrete Fourier transform (DFT).
3. Materials and Methods
3.1. Experimental Setup and Data Acquisition
Three ceramic alumina workpieces with 35 mm length × 8 mm width and a Vickers micro-hardness of 1339 ± 47 HV1 (JIS R1610-1991 standard) were machined in a peripheral surface grinding machine, RAPH 1055 model, from Sulmecanica. A resin-bond diamond grinding wheel with designation SD126MN50B2 from Dinser, external diameter of 350 mm and wheel width of 15.5 mm was used in the tests. All tests consisted of a single grinding pass across the workpiece surface at different cutting conditions: cutting speed of 33 m/s; worktable speed of 58 mm/s. Three radial depth of cut values were tested: 25 µm, 105 µm and 350 µm, representing slight, medium and severe grinding conditions, respectively. Prior to each test, a conglomerate type dresser was used to dress the grinding wheel to guarantee its best grinding performance. Each test was performed in the presence of a coolant (water–oil emulsion of 4%) at a flow rate of 27.5 L/min and pressure of 0.7 MPa.
A low-cost PZT transducer, 7BB-35-3 model, from Murata Electronics North America and an AE sensor, equipped with a processing signal unit from Sensis (DM-42 model), was employed in the tests. As shown in [
9], this piezoelectric transducer has similar properties to conventional PZT ceramics and is sensitive to damage. Both sensors were attached to the workpiece holder and properly calibrated for good signal sensitivity and saturation. An oscilloscope, DL850 model, manufactured by Yokogawa, collected the PZT and AE raw signals at a sampling rate of 2 MHz.
3.2. Workpiece Surface Assessment
After the grinding tests, the surface quality of the workpieces was evaluated in terms of surface roughness (Ra parameter) using a Taylor Hobson Surtronic 3+ portable stylus instrument. A sampling length of 0.8 mm and a cut-off of 0.25 mm were used. Each workpiece ground length was equally divided into five regions and three roughness measurements were taken from each region. The mean value was calculated for each workpiece, allowing the assessment of the ground workpiece. In addition to measuring surface roughness, all the workpieces were subjected to microscopical analysis in order to evaluate the subsurface integrity. The confocal microscopy measurements were taken using a DCM three-dimensional (3D) confocal microscope manufactured by LEICA, with 800× magnification.
3.3. Signal Processing
The data sets from the tests were digitally processed in MATLAB. According to Ribeiro et al. [
10], the frequency response of the two sensors (AE and PZT) varies from 2 kHz to 400 kHz. Thus, in order to reduce the amount of data to be processed, and respecting the Nyquist sampling theorem, the samples were resampled at a rate of 1 MHz. Before the resampling, a digital filter (2 KHz to 400 KHz) was applied with the aim of avoiding the aliasing effect and eliminating noise. The STFT of each test was then calculated using a rectangular window 5000 points in length and a 90% overlap. Thus, a time–frequency resolution of 5 ms and 400 Hz, respectively, was obtained.
A frequency band was chosen for each sensor. The absolute value of the STFT was considered for the choice of frequency bands. Thus, the criterion used in the selection of frequency bands was based on the search for frequency intervals that present a similar value over time and differences in magnitude (color bar) related to the conditions of the process (slight, medium, and severe). The absolute STFT values and the time–frequency resolution were used to compute the ROP parameter, applied in the chosen frequency bands.
4. Results and Discussion
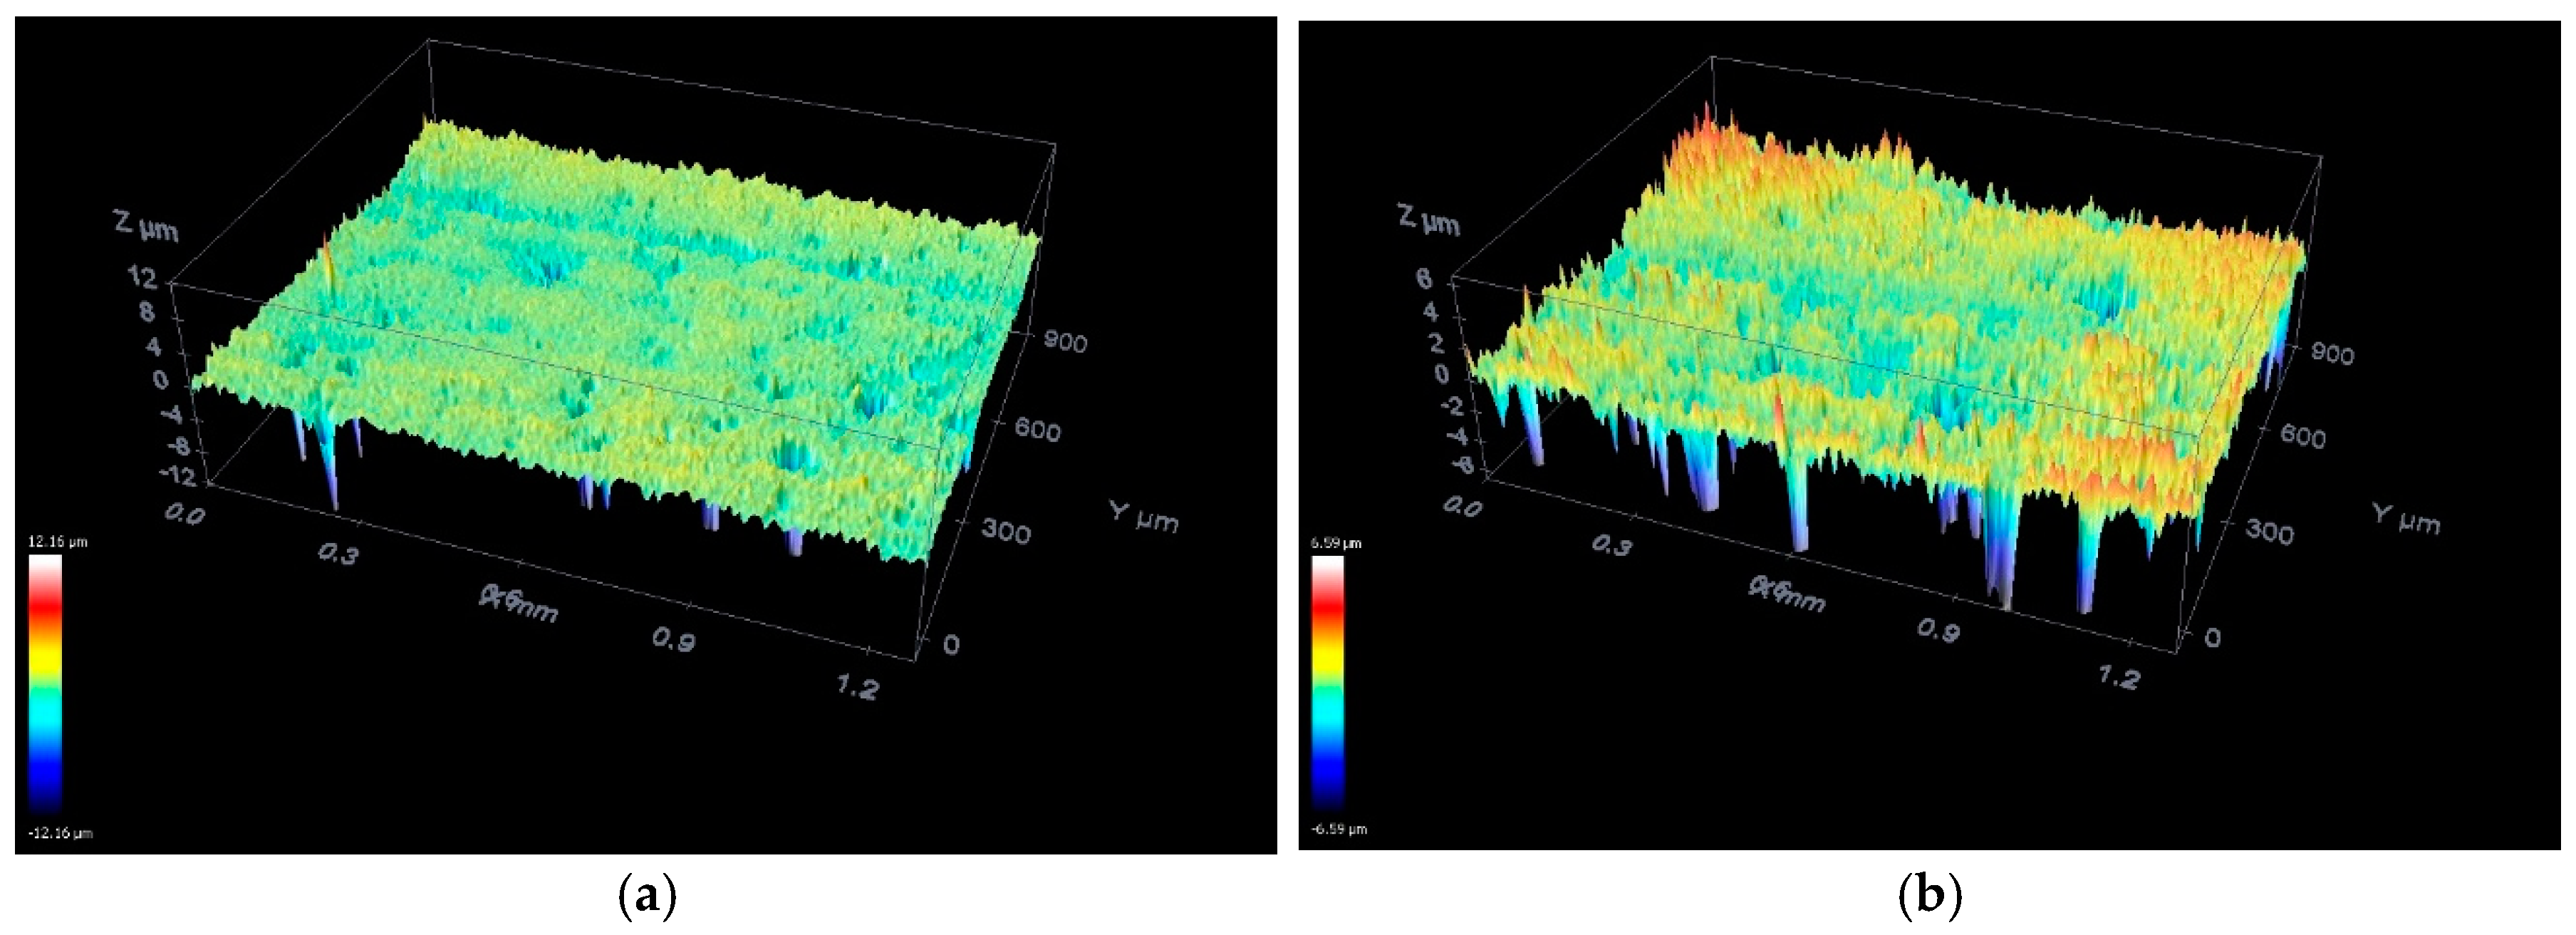
The results obtained from the characterization of the ground ceramic workpieces are presented in this section. The surface roughness (Ra) results were measured using a confocal microscope are shown in
Figure 1. As seen in
Figure 1, signals generated by both sensors and their correlation with the workpiece surface roughness were obtained through frequency–time analysis, band selection, and ROP parameter analysis. The results are shown in
Table 1 and
Figure 2. The confocal analysis was performed for each radial depth of cut in order to detect micro-defects on the workpiece surface. It can be seen that when the ceramic was machined at the slight condition, no significant surface grinding alteration was detected. However, some peculiar irregularities of previous processes can be observed in
Figure 1a.
As the depth of cut increased, the severity of the grinding process also increased, thereby worsening the component surface quality. The most significant effect can be observed in
Figure 1b, corresponding to the workpiece surface, which was ground at a 350 µm depth of cut. An increase in the material removal rate led to a decrease in surface quality, increasing the number of surface cracks. The irregularities and color differences on the graphs in
Figure 1 were related to the proximity of the formed valleys. The 3D images clearly indicate the increasing peak-to-valley distance, i.e., greater surface roughness.
The mean roughness values, measured by the portable stylus instrument for slight, medium and severe grinding conditions were 0.5156 µm, 0.6844 µm and 0.7933 µm, respectively. As expected, the mean roughness values increased with the process severity. These results are in agreement with those obtained in
Figure 1. Furthermore, the surface roughness values were within an acceptable range for the grinding process, with a maximum value of 1.6 µm for steel, according to [
11]. In advanced ceramic grinding, roughness values lower than 1 µm are usually expected.
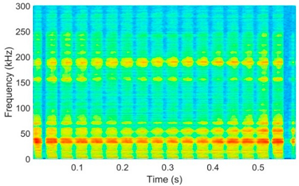
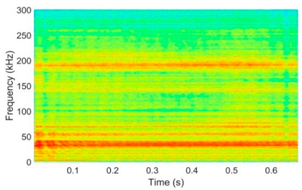
The STFT spectrograms of both sensors (AE and PZT) for the slight and severe grinding conditions are shown in
Table 1. Magnitude variations in the spectrum frequencies that represented the lowest depth of cut (25 µm) were observed. This variation was related to the contact between the workpiece surface and abrasive grit of the grinding wheel, which followed a non-uniform behavior, since many of the abrasive grits did not have contact with the workpiece surface, generating low energy levels on the graphs. Thus, little acoustic activity was generated, directly reflecting in the harmonic content of the signal sampled during the process. On the other hand, the spectrogram that represented a severe grinding process (350 µm) presented a uniform harmonic content over time. This was caused by the continuous contact of the abrasive grit and the workpiece surface, generating greater acoustic activity. In both, grinding conditions were observed with the characteristic frequencies distributed continuously over time. However, for the most severe grinding condition, the harmonic content assumed higher magnitude levels.
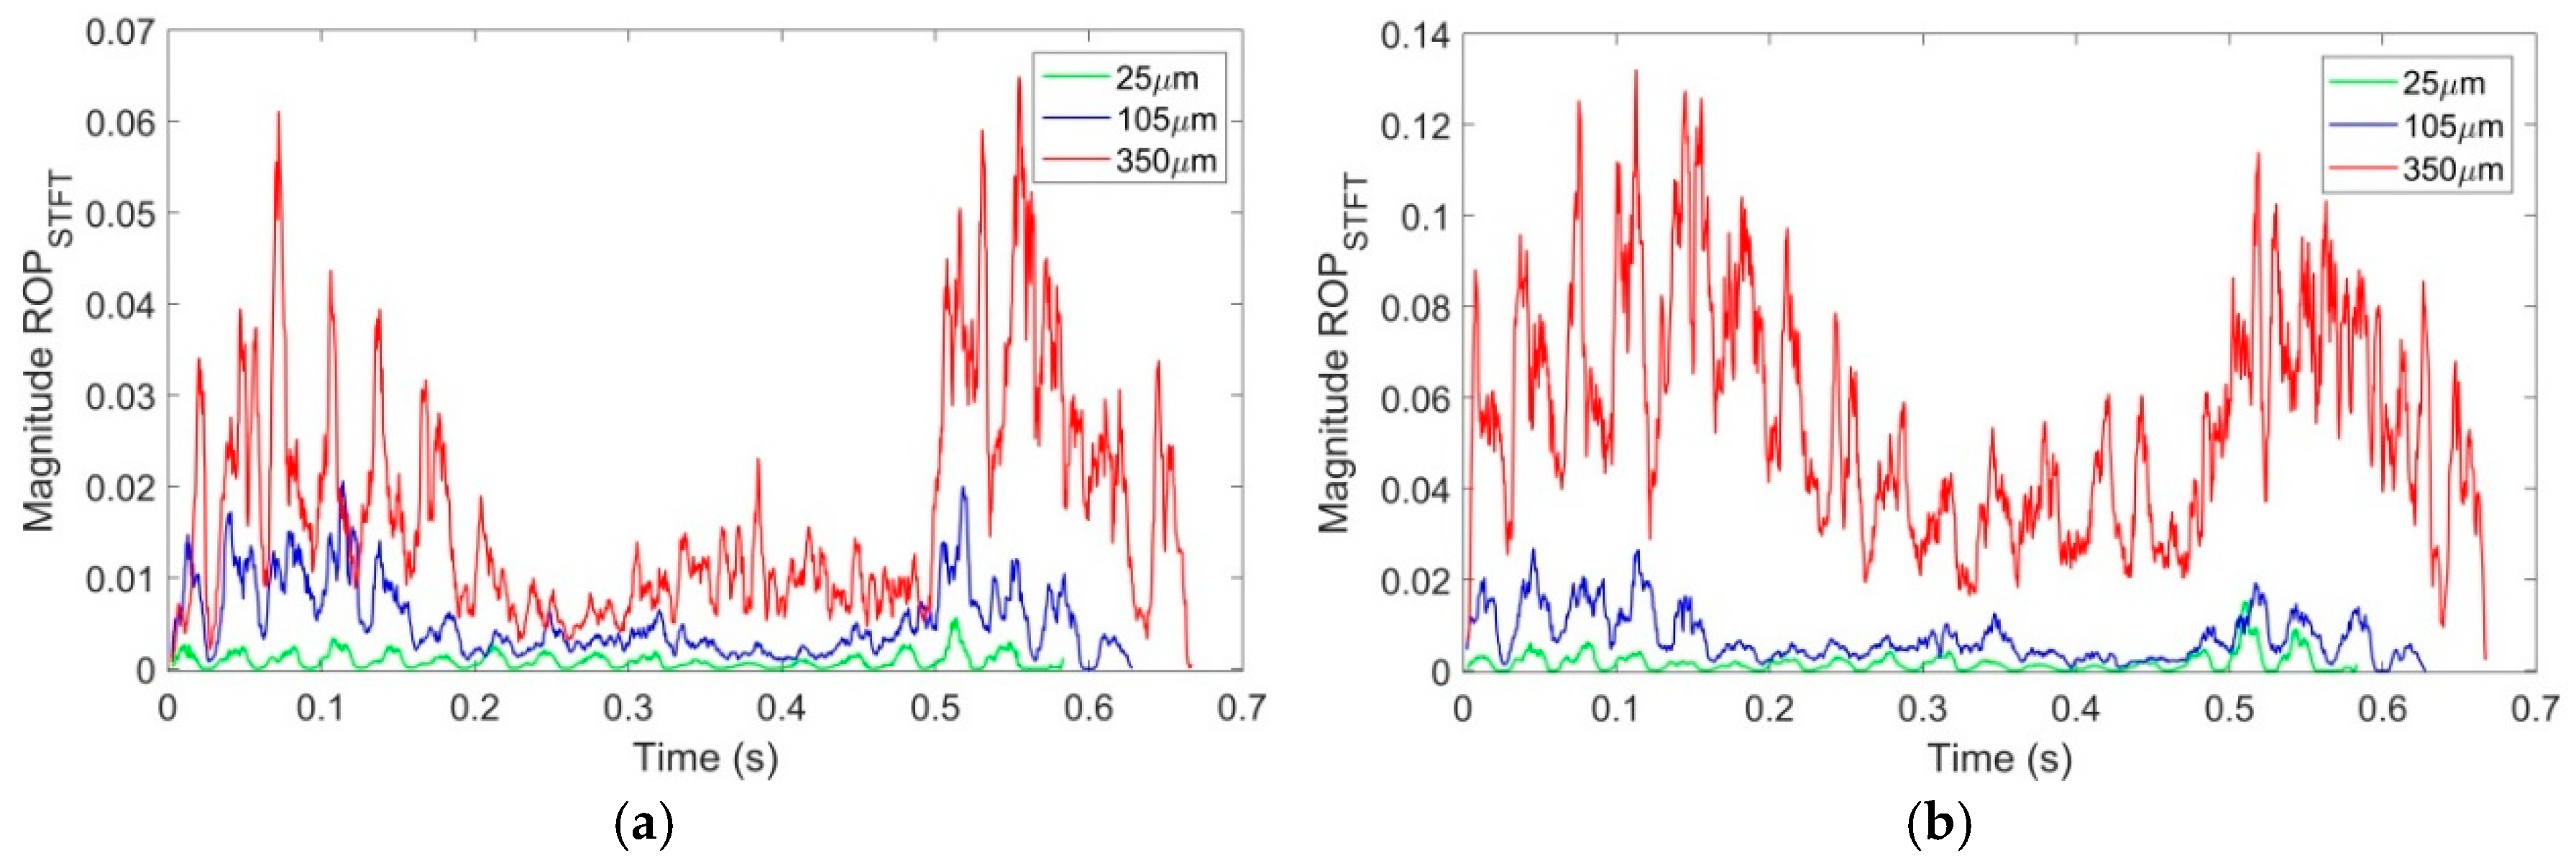
The frequency bands chosen for the computation of the ROP parameter were (138–143) kHz for the AE sensor and (142–147) kHz for the PZT transducer. The two frequency bands presented characteristics related to the process conditions. The ROP results for both sensors are shown in
Figure 2. It can be clearly seen that as the depth of cut increased, there was an increase in the ROP values, i.e., the ROP parameter was proportional to the variation in the radial depth of cut in grinding. This was due to the chip accumulation in the cutting region, resulting in an increased cutting force and, consequently, greater acoustic emission activity and surface roughness. Therefore, machining ceramics with a diamond abrasive wheel and a depth of cut of 350 µm generated the highest ROP, STFT and Ra values.
It can be seen from the results presented in
Table 1 and
Figure 2 that there was an increase in energy at the beginning and end of the grinding process. This is typical grinding behavior, since it represents the first contact of the grinding wheel abrasive grit with the workpiece as well as the last contact. The grinding contact area was smaller at the beginning and also at the end of the machining process. This characteristic of the process slightly increased the surface roughness values at the ends of the machined workpiece, as can be seen in
Figure 1, from 0.0 to 0.2 and 1.0 to 1.2 on the x-axis, with a change in color representing a greater roughness value that is highly perceptible. In the middle of the workpiece surface, the surface roughness presented almost constant values, and all the surface changes were clearer in the severe grinding condition. The frequency bands chosen presented amplitudes related to the workpiece surface condition. In both cases, a minimum of overlap between the process conditions can be observed.

 ,
, 


