1. Introduction
Occupant’s activities at home, such as cooking or drying clothes, often generate an important load of air pollutants or of humidity in residences. When the indoor air reaches hazardous concentrations of pollutants or humidity, damaging consequences can occur for the health of the occupants or the long-term integrity of the building. Approximately 20% of US homes regularly exceed NO2 standard because of the lack of use of exhaust fans during cooking [
1]. By venting pollutants and excessive humidity outdoor, exhaust devices (range hoods, bathroom fans, dryers…) are thus essential for maintaining an appropriate indoor air quality in residential buildings. This is especially true for recent and future buildings that have airtight envelopes. From a heating standpoint, high airtightness is good to reduce outdoor air infiltration, but it is not ideal for the natural evacuation of pollutants—mechanical systems are thus required to fill this gap.
Using exhaust devices require the consumption of energy. Obviously, exhaust fans use electricity to move air. Exhaust fans also increases household energy use by taking indoor warm air and discharging it outside. This amount of air is eventually replaced (either naturally via infiltration or mechanically through the ventilation system) by cold outdoor air that has to be heated up to the set point temperature of the dwelling [
2]. Since it is a large energy consumer, the use and the energy consumption of clothes dryers have been studied before [
3,
4], but this is less true for kitchen hoods and bathroom fans. Nonetheless, Logue and Singer evaluated that range hoods are responsible for 19–33 TWh of site energy use across the US, mainly due to the increase in infiltration rate [
5].
The purpose of this paper is to observe how occupants in different households use their exhaust devices and to quantify the impact of the use of these devices on the energy performance of a dwelling. To do so, data analysis from a monitored building was carried out. The paper first describes the case study building from which the data was recorded before presenting results regarding the use of exhaust devices and its impact on the energy balance of a dwelling.
2. Materials and Methods
A multi-residential building located in Quebec City (Canada) has been heavily instrumented during its construction in 2015 and has been monitored ever since. Among the data recorded from the building are the indoor temperature, heating, electricity and hot water consumption, window openings, use of mechanical ventilation system and use of the three available exhaust fans (kitchen hood, bathroom fan and dryer) for eight dwellings. Four of these dwellings are located on the first floor of the building and four on the fourth floor. Weather data is also obtained from a nearby weather station. The state (on/off) of the exhaust devices, of the mechanical ventilation system and of the windows in each of the dwelling is reported every minute. Other data are recorded at a 1-hour frequency. The building was designed with the objective of achieving high energy performances, so it has a highly insulated and airtight envelope. The natural infiltration rate through the envelope has been estimated to be roughly 0.10 air change per hour (ACH) on average throughout the year [
6]. However, windows in the monitored dwellings are often opened (average of 10.3% of the times in winter and 36.4% of the times in summer), which increases air infiltration in the apartments, particularly for those on the first floor due the stack effect.
The ventilation system in the dwellings is balanced, i.e., the supply and return air flow rates are assumed to be the same.
The standard flow rate of ventilation for a dwelling in this building is 59 cfm (100 m3/h), which is equivalent to air change rate of 1.10 ACH. Occupants can directly control this system with an on/off switch that activates or deactivates mechanical ventilation for their apartment. For the sake of simplicity, exhausted air is considered in this paper to be replaced via increased infiltration due to the temporally depressurized indoor environment.
There are three exhaust devices in each apartment. First, there is a 3-speed range hood that can extract air at a rate of 100, 200 or 300 cfm (58, 118 or 177 m
3/h; 0.62, 1.25 or 1.88 ACH) and that has an efficiency of 0.68 W/cfm. The second exhaust device is the bathroom fan, which extracts 80 cubic feet of air per minute (47 m
3/h or 0.50 ACH) and consumes 50 W of electricity when operating. Finally, the clothes dryer also acts as an exhaust devices. Each household has its own dryer and no information was available regarding the specifications of the clothes dryers used in each monitored dwelling. Typical clothes dryer specs were thus used for this paper—an airremoval rate of 125 cfm (74 m
3/h or 0.79 ACH) and a total power consumption of 5500 W (250 W for the fan and 5250 W for the electric heater) [
7]. The power consumption of the heater is included since its purpose is in line with those of exhaust devices, i.e. extracting humidity from clothes and discharging it outside.
This paper is based on data for the year 2018. During that year, the case study building used 39.6 kWh per square meter of floor area for space heating, 47.6 kWh/m2 for domestic hot water and 44.9 kWh/m2 for electrical appliances—the total energy use of the building was thus 132.1 kWh/m2.
3. Results
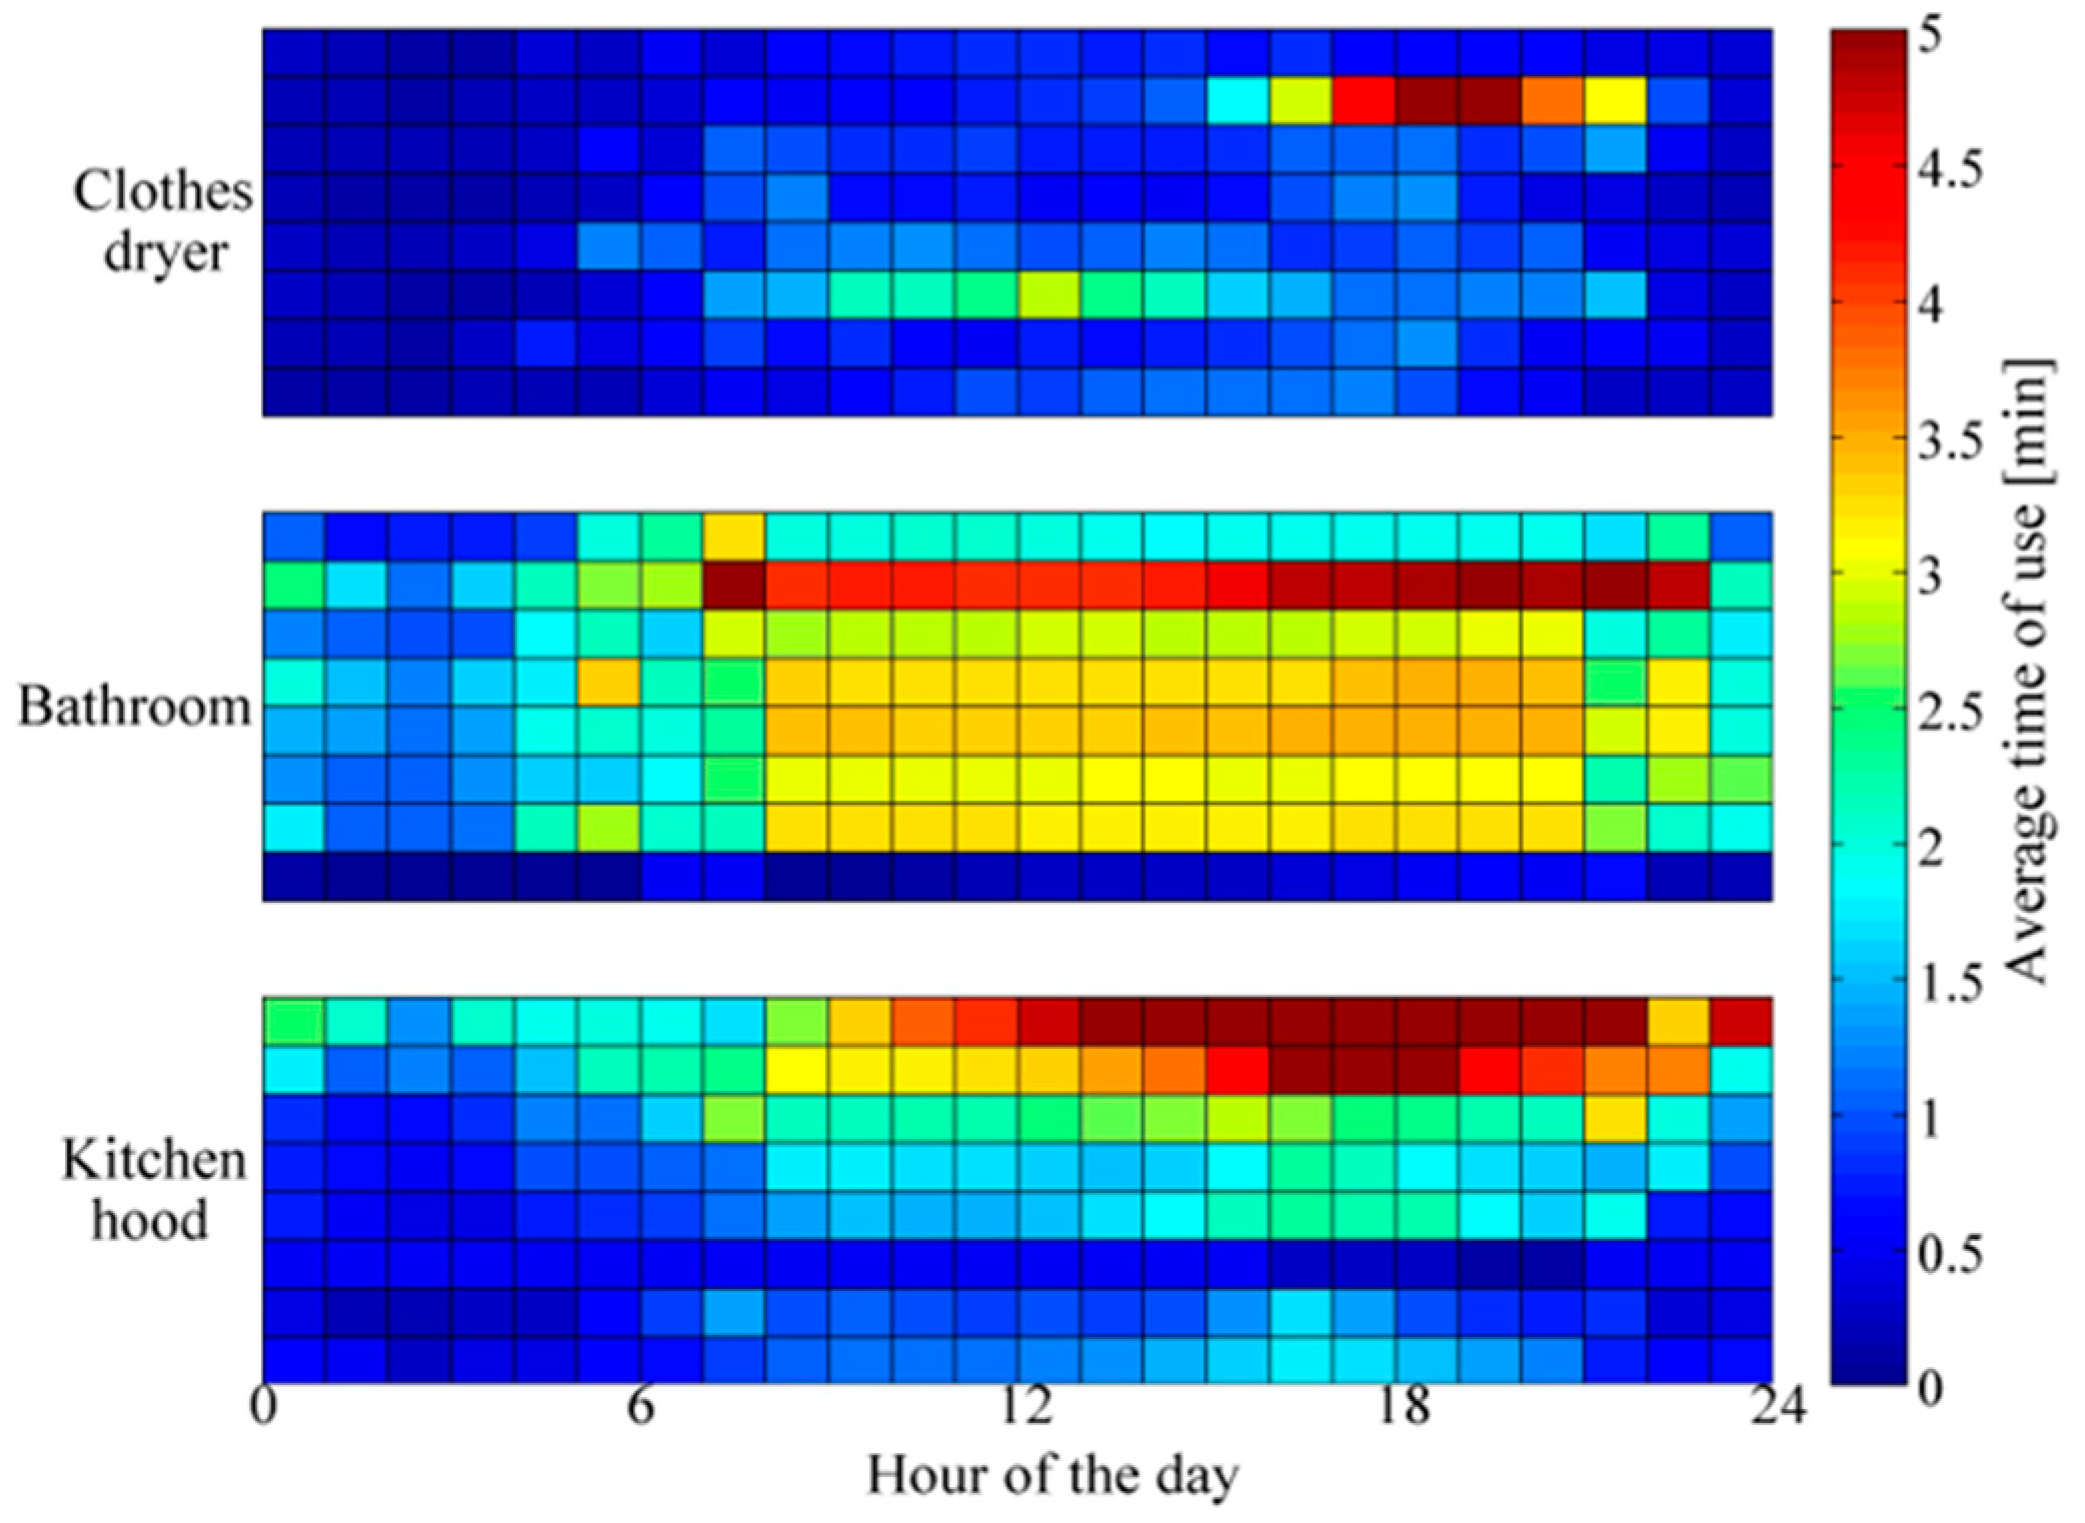
Figure 1 reports the average use of the exhaust fans over the day. Each line represents a different dwelling and each pixel shows, on average, how many minutes in that hour time slot the fan was used. It can be observed that there is large variation of the fans usage from one dwelling to another. Furthermore, the bathroom fan tends to be used more regularly during the day, compared to the other two fans. On average, it was measured that the kitchen hood, the bathroom fan and the clothes dryer were respectively used 43, 56 and 19 min per day per dwelling.
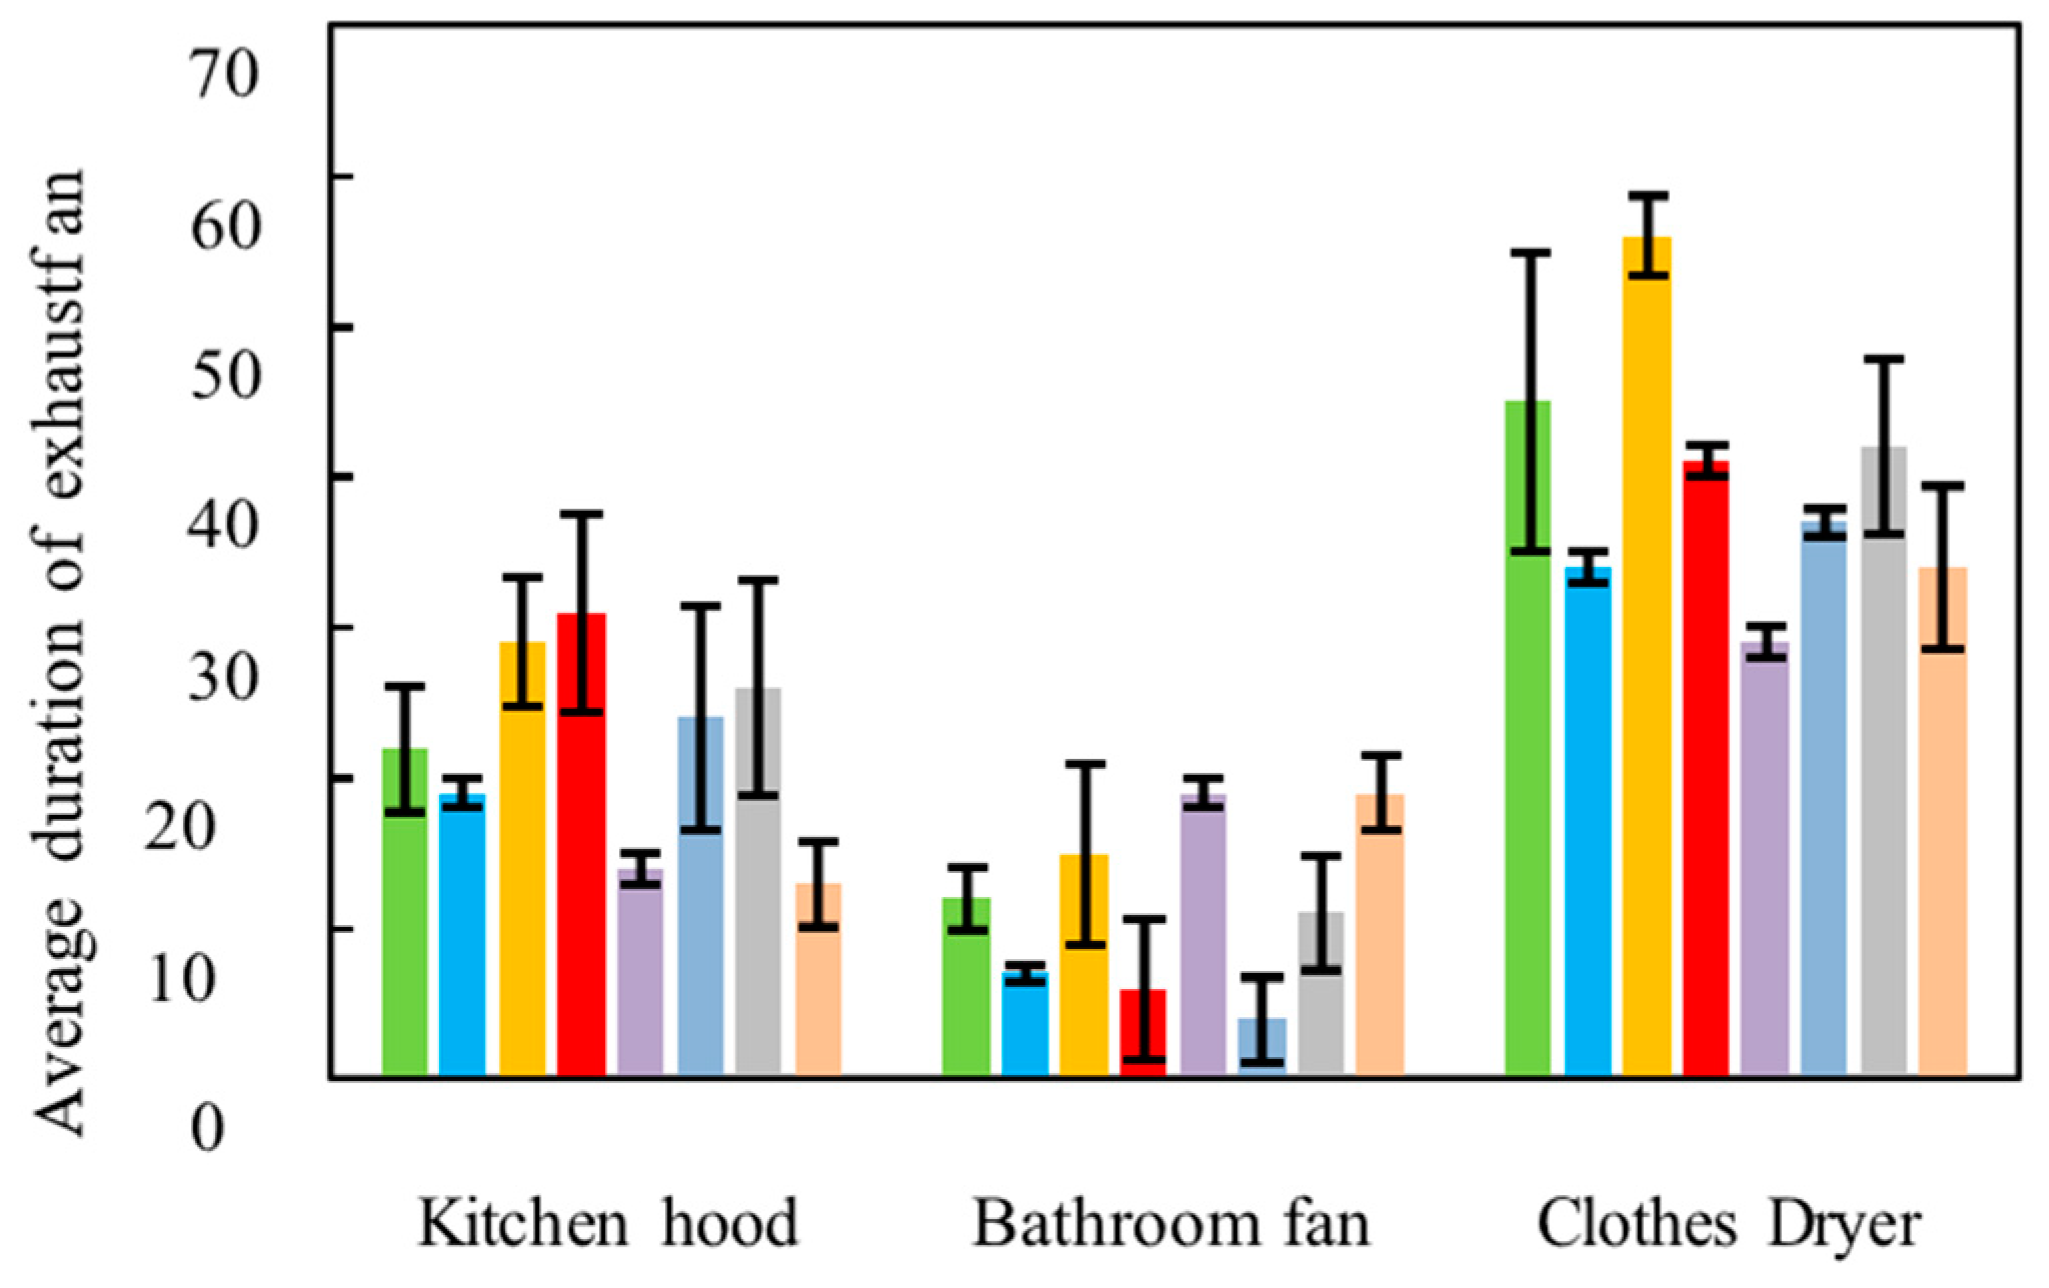
In
Figure 2, the average duration of an event (i.e., period of time during which the appliance remains operating once it is activated) for each monitored fan in the building is reported. The error bar corresponds to the standard deviation in the dataset. The clothes dryer is activated for the longest duration (average of 39.8 min per event), and the bathroom fan for the shortest amount of time (11.6 min per event). Clothes dryer events duration are less variable than the events for the kitchen hoods and the bathroom fans, due to the fact that clothes dryers usually follow prescribed cycles duration whereas the other two appliances are totally controlled by humans.
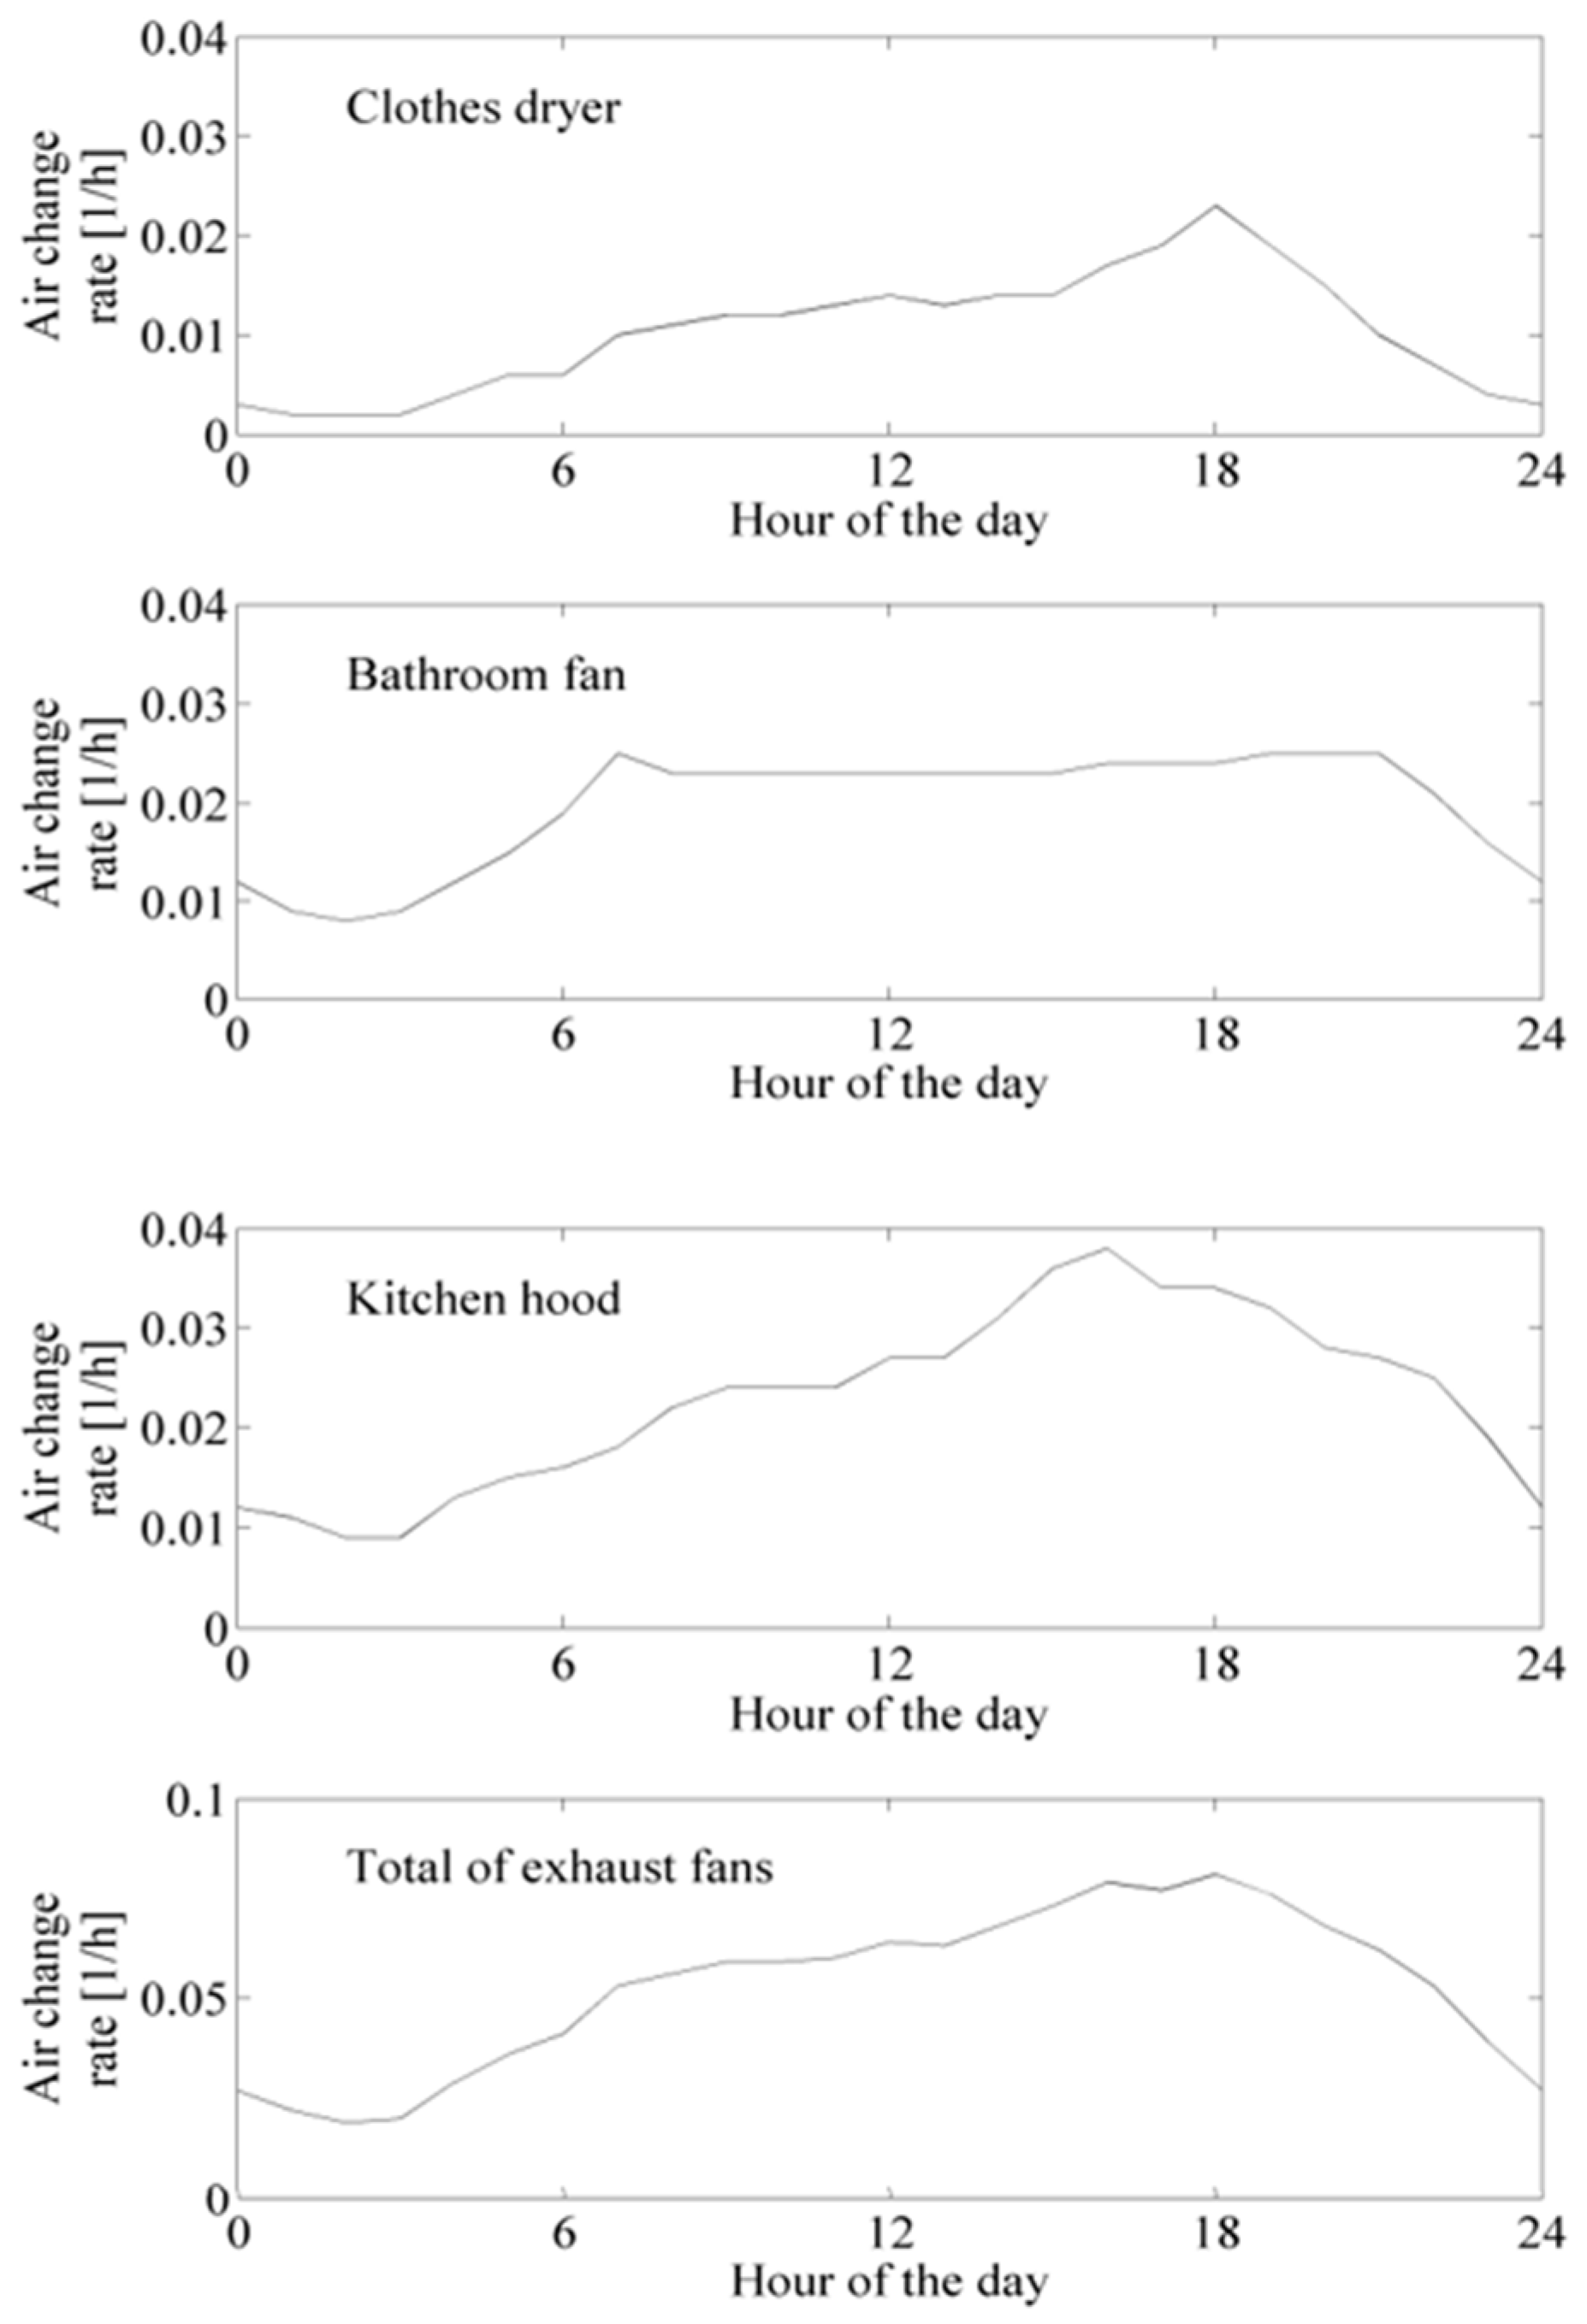
Based on the observations, an average dwelling profile of usage for each fan was created and the estimated air exhaust rate was estimated with the nominal values presented earlier. The resulting curves are shown in
Figure 3. The peak exhaust rate is reached on average around 18:00 with an average rate of 0.081 ACH, which is close to the base natural infiltration rate (0.10 ACH). Averaged across the whole day, the mean air change rate related to exhaust fans is 0.052 ACH. This value highly changes from a day to another, with some days having zero air change rate and others reaching relatively high values (0.250 ACH). The peak air change rate found in 2018 for a single timestep was 2.43 ACH.
As mentioned before, exhaust devices influence the energy balance of a building in two ways: from the electricity that they consumed to activate their fans and from the warm air that is taken out of the building and eventually replaced by cold air.
Using the specifications of the exhaust appliances, deriving their electricity consumption from the monitoring of their use is straightforward when one assumes that the electrical efficiency of the devices is constant for all flow rates:
As shown in Equation (1), one merely needs to multiply the power consumption of the appliance with its total annual duration of activation. Electricity consumption in 2018 was thus estimated to be 0.24 kWh/m2 for the kitchen hood, 0.18 kWh/m2 for the bathroom fan, 0.30 kWh/m2 for the exhaust fan of the dryer and 6.05 kWh/m2 for the heater of the dryer. This leads to a total annual electricity consumption of 6.77 kWh/m2. Considering the electricity consumption of 44.9 kWh/m2 of the whole building, this figure means that exhaust devices are responsible for approximately 15% of the total electricity consumption (only 2% without the heater used by the dryer).
Estimating the impact of exhaust devices on heating demand proves to be more complicated. In a balanced ventilation system where the air taken away from indoor by exhaust devices is replaced—at least to some extent—by natural infiltration, the impact of exhaust fans on the heating demand is seen through this additional infiltration. However, because of the complexity of measuring infiltration rate in situ, no live infiltration data was available to verify the change in infiltration rate in a dwelling when exhaust fans are operating.
It still remains possible to compare the change in heating energy consumption of a dwelling when the devices are activated. One should still take into account that the infiltration rate is not the only variable affecting the heating demand. For example, outdoor and indoor temperatures, internal heat gains or solar radiation play a significant role on the heating demand.
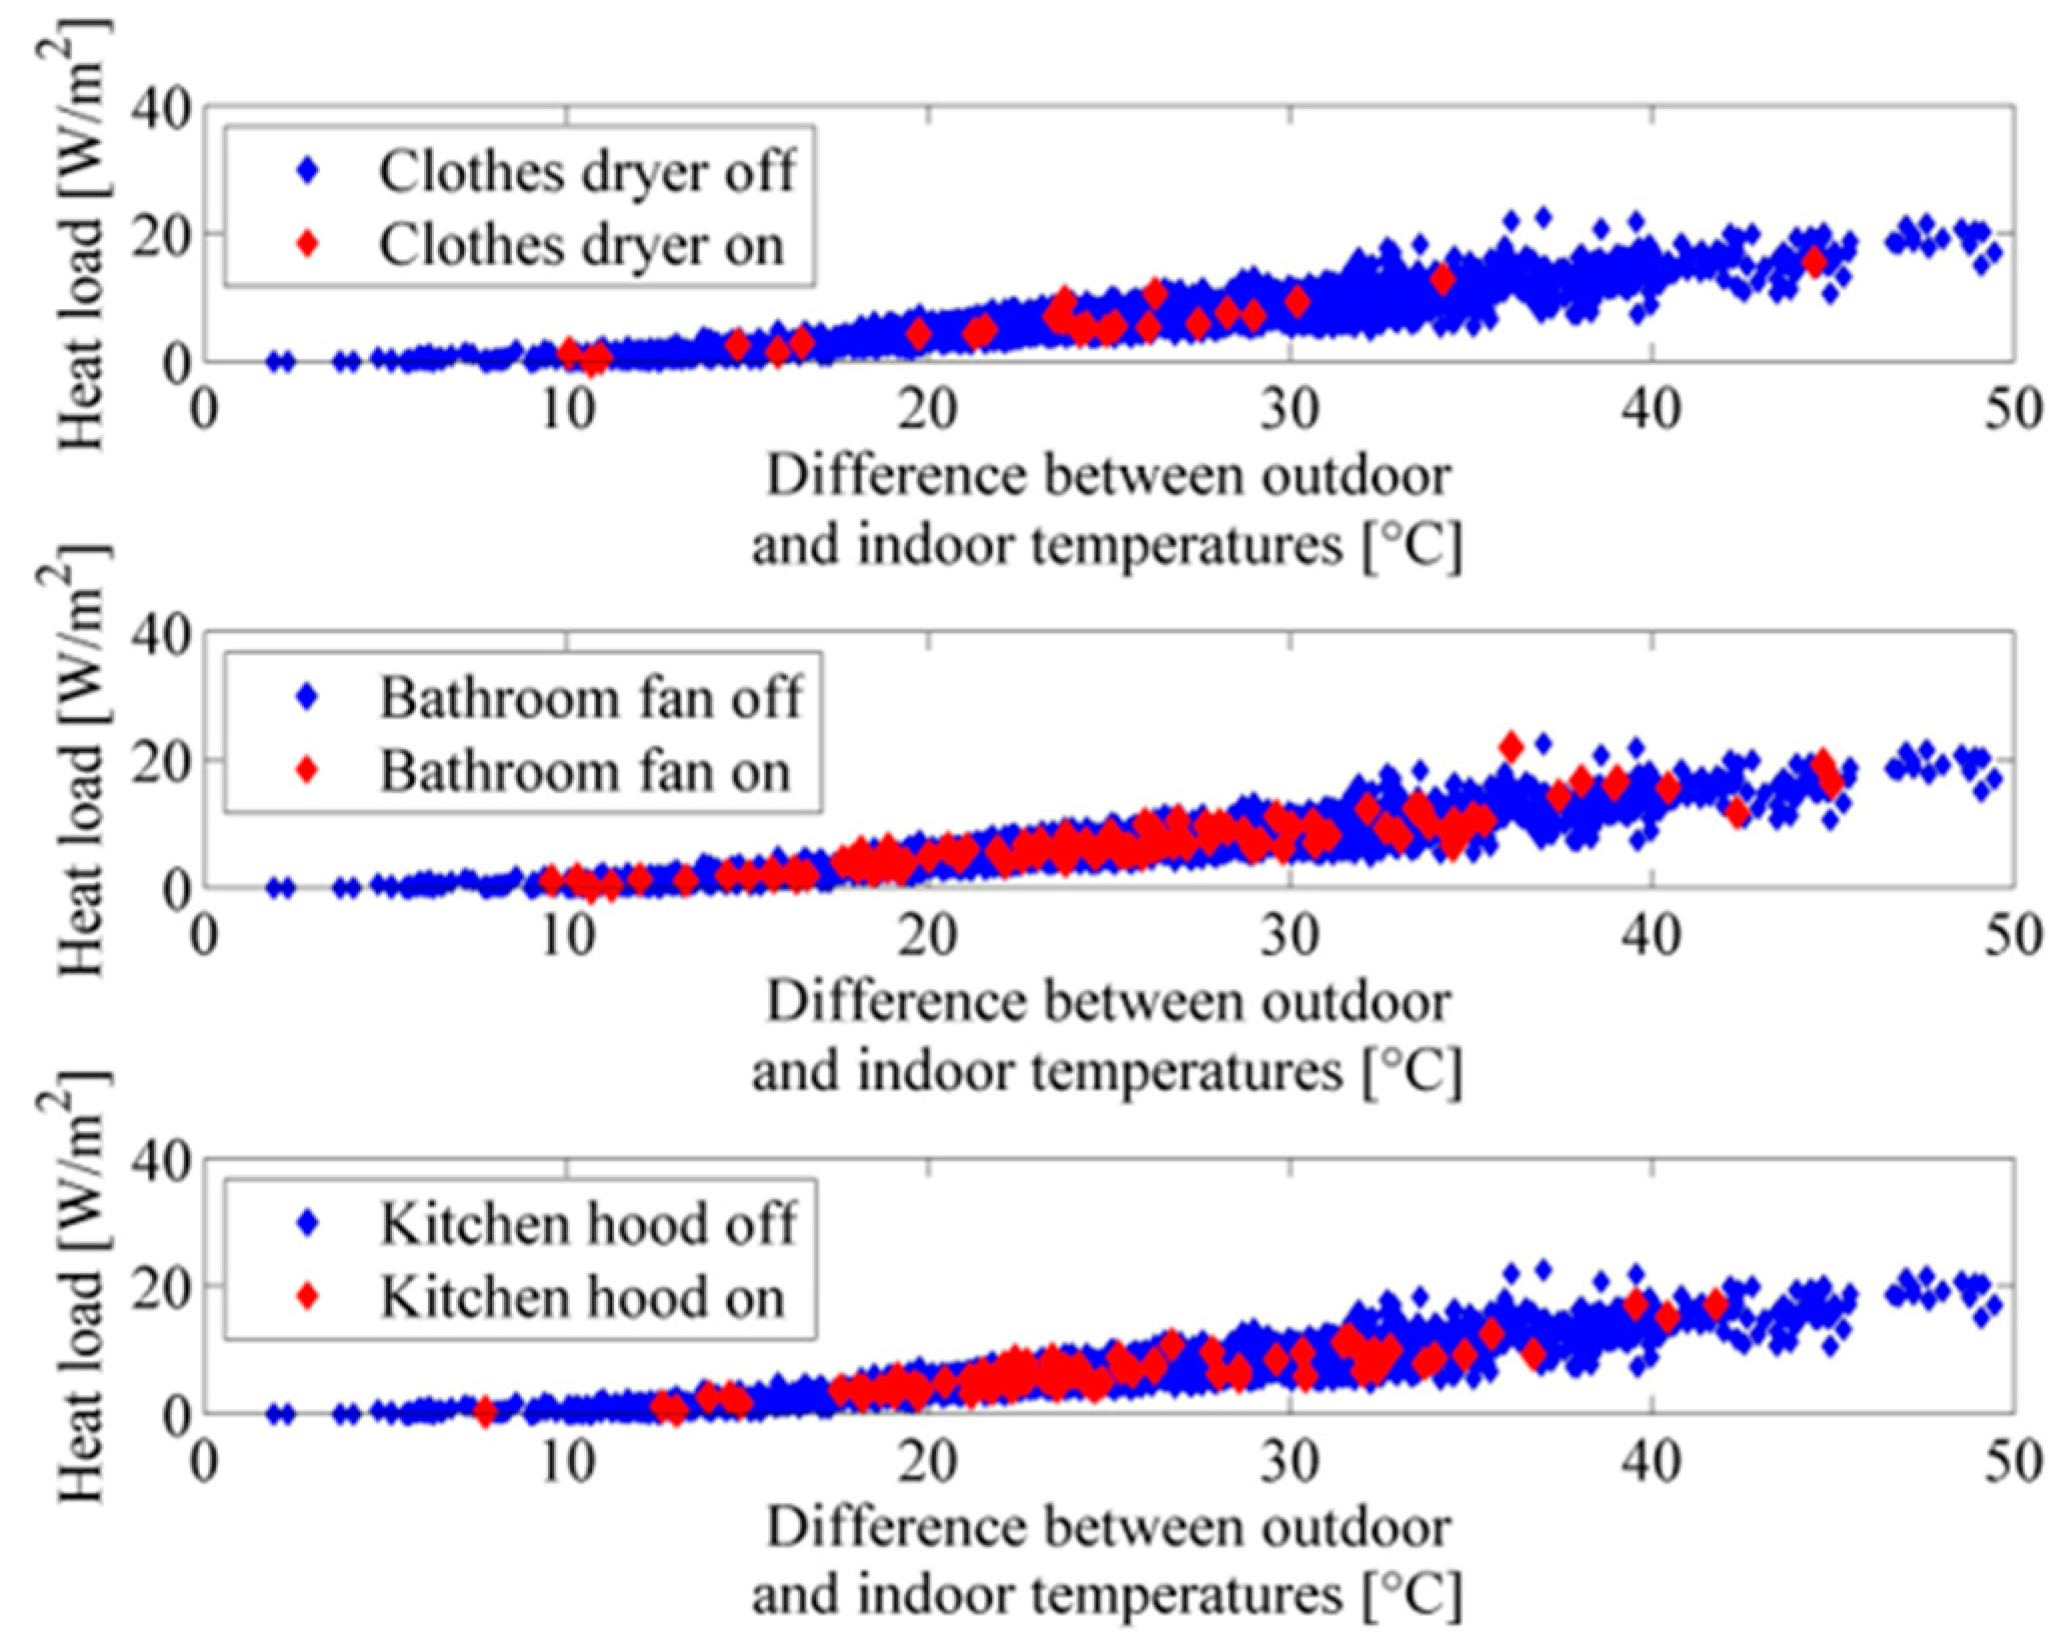
Figure 4 shows in a scatter plot the relation between outdoor and indoor temperatures and heating power consumption of a dwelling, differentiating time steps when exhaust fans are activated and those when they are not. Regressions can be plotted for the blue points (fans off) and for the red points (fans off). It was found that the slopes were slightly higher when the fans were on, pointing towards a higher air exchange rate during these time steps. Nevertheless, the change of slope is weaker than the one that would be predicted by the exhaust airflow rates of
Figure 3. One could argue that use of exhaust fans correlate with use of electrical appliances, so there is probably more internal heat gains in time steps where the fans are operating. As a result, it is not possible to assess the impact of exhaust fans on the heat load without accounting for electricity consumption.
To fix this shortcoming, a multilinear regression was built from the dataset for each dwelling to estimate their respective heating need based on the different influencing factors mentioned above (outdoor-indoor temperature difference, window opening, etc.) including the use of the exhaust fans.
Regression models yielded satisfying results, with R2 values ranging from 0.654 to 0.921, so they were considered as validated. To increase the robustness of the models, regression analysis used standardized coefficients.
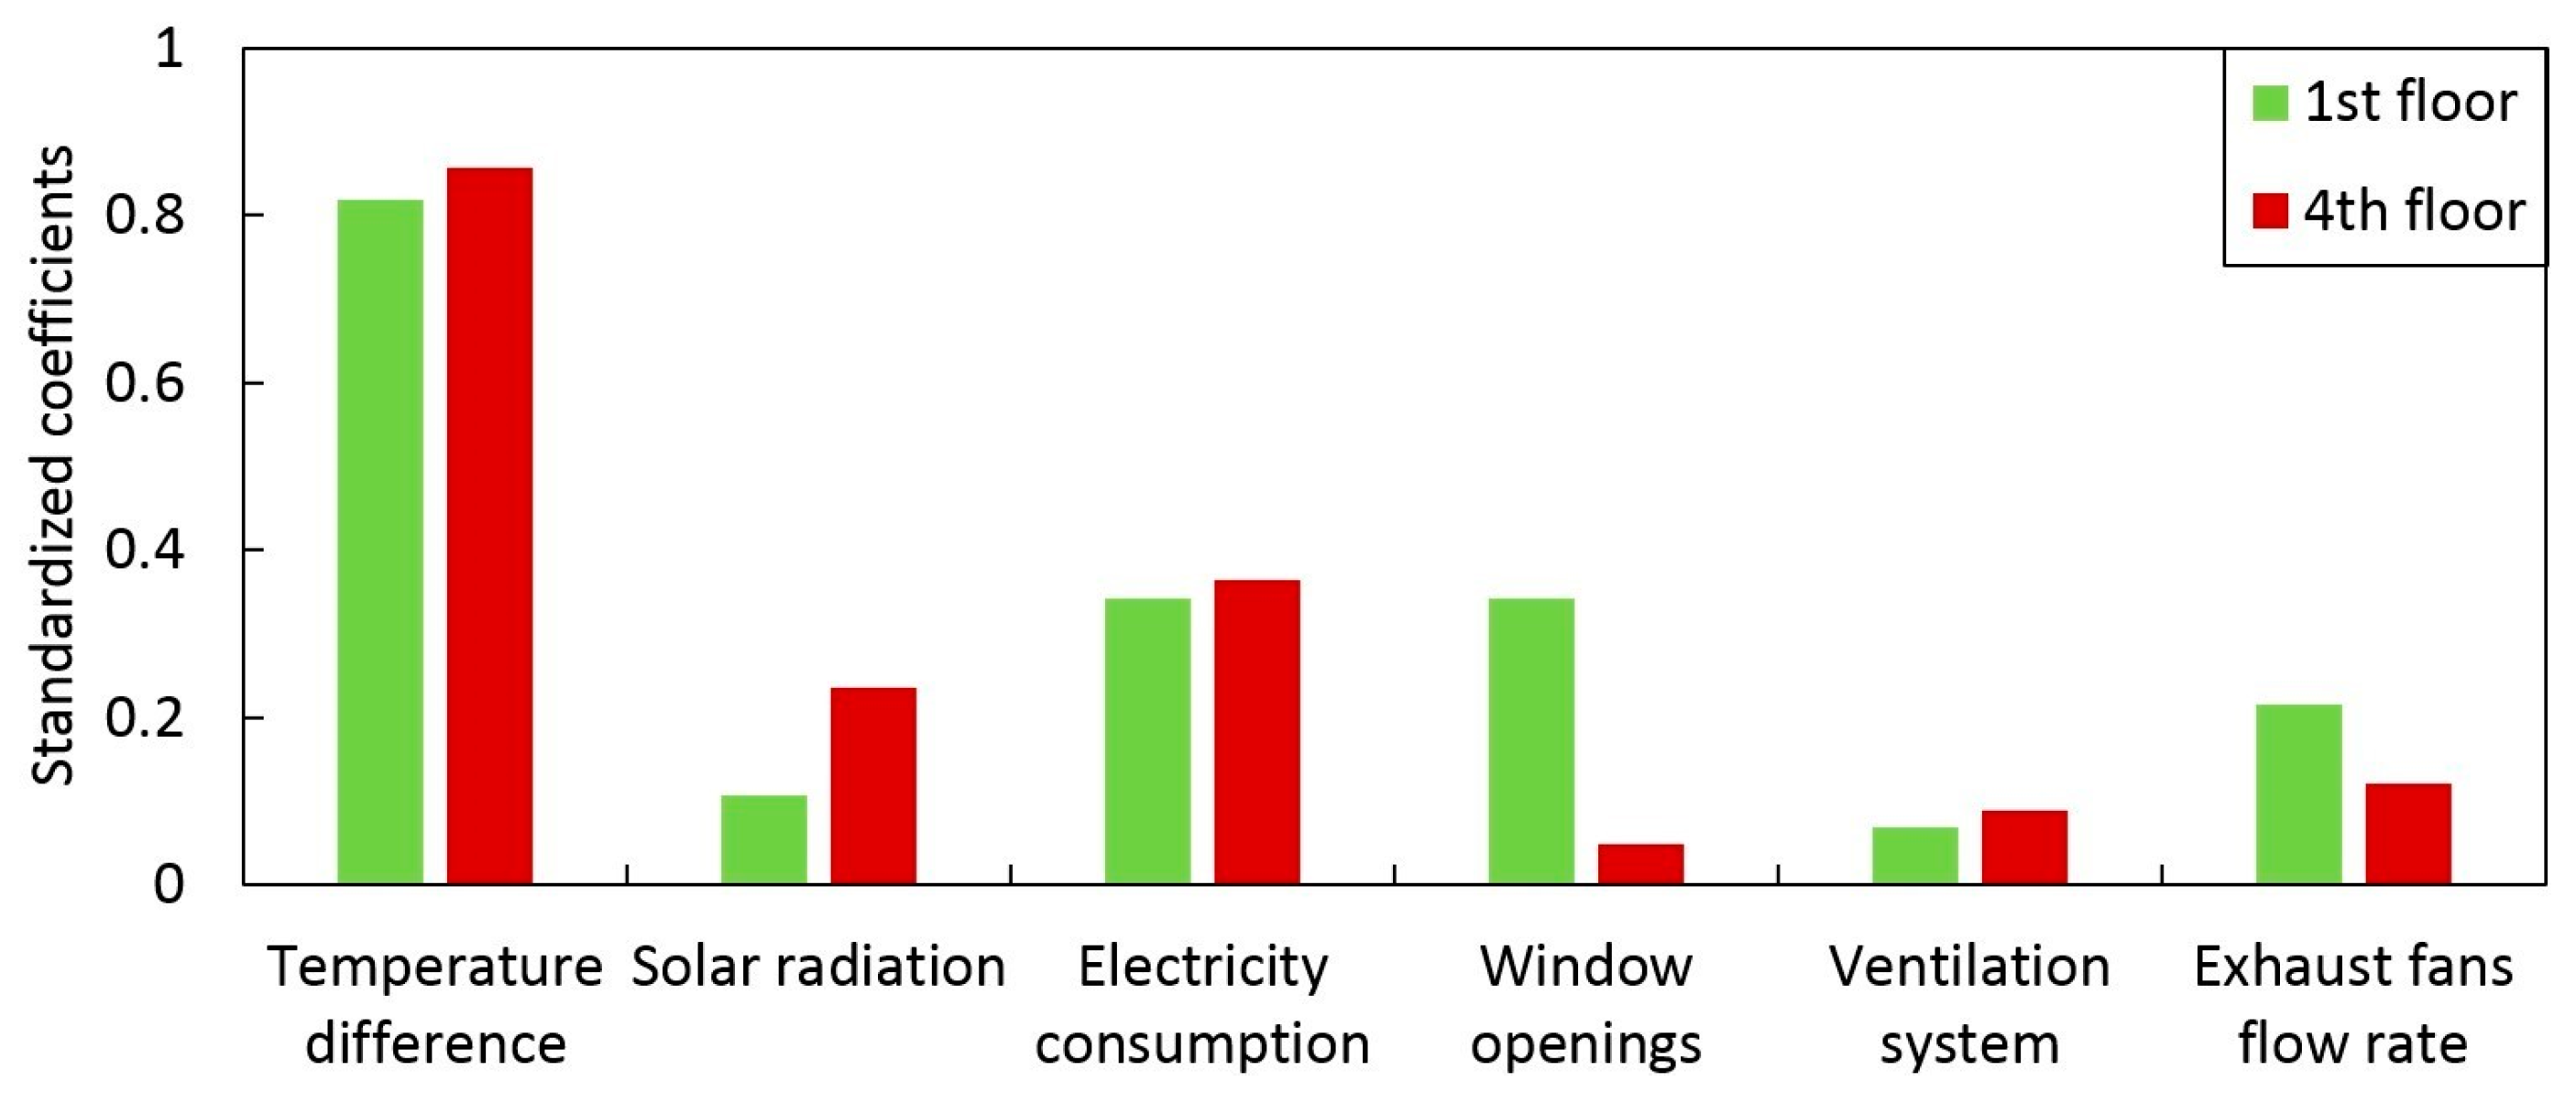
Average values for the standardized regression coefficients found across the eight dwelling models are reported in
Figure 5. These coefficients can be seen as a measure of the sensitivity of the instantaneous heating demand to the variable considered. Apartments from the first floor are distinguished from those on the fourth floor since differences were seen regarding their regression coefficients. Predictors affecting the infiltration rate of the dwelling (window openings and use of exhaust fans) appears less important for dwellings on the fourth floor than for dwellings on the first floor. This can be explained by the stack effect around the building, which cause cold air to enter the building from the bottom.
The use of fans is the fourth most influencing factor for the heating demand, behind the difference of outdoor-indoor temperatures, the electricity consumption and the openings of windows. This demonstrates that the use of exhaust fans does indeed have an impact on heat consumption in residential dwellings. To assess how big of an impact, a simulation was made from the regression models in which no fans would be used (but the electricity consumption would stay the same). This simulation showed that the heating need would be reduced 5.75 kWh/m2, i.e., a reduction of 14% of the actual heating demand.
With the estimated electricity consumption of 6.77 kWh/m2, this means that the use of exhaust fans generated an increase of 12.52 kWh/m2 of energy consumption in 2018. Knowing that the total energy use was 132.1 kWh/m2, one can say that exhaust fans were responsible for 9.5% of the total energy use of the building when considering the electric heater of the dryer and 4.9% of the total energy use when not considering it.
4. Conclusions
This study analyzes how occupants in a multi-residential buildings use their exhaust devices and how this use of exhaust fans influences the energy consumption of their dwellings. Extracting air obviously requires consumption of electricity (15% of the total electricity consumption in the case study building), but it also increases the needs of heating as infiltration rate is potentially accentuated (exhaust fans were estimated to account for 14% of the heating demand).
Although this was not directly observable by looking at the relation between the indoor and outdoor temperatures and the heating demand, regression analysis clearly shows that the use of exhaust fans has a role to play in the thermal balance of a building. Consequently, it is important for building professionals to understand how the occupants interact with such devices. Design and control strategies should consider the impact of these appliances.
Monitored data show a variability in use of exhaust fans when comparing the behavior of occupants across several households. This exhibits that it is not trivial to forecast the use of exhaust devices when designing a residential building. Occupant behavior models based on advanced methodologies, such as Markov chain, could be required to appropriately simulate the behavior of occupants regarding the extraction of pollutants and humidity in dwellings.


