Abstract
The methodology presented in this paper aims to detect pathological regions affected by one or more of the three clinically defined types of Diabetic Macular Edema (DME). Using representative samples extracted from Optical Coherence Tomography (OCT) images, three representative classifiers are trained to analyze new input images and create an intuitive visualization of the detection results. The trained models provided a satisfactory performance for all three defined types of DME, and the visual feedback can effectively assists clinical experts in the diagnosis of this representative and extended disease.
1. Introduction
In ophthalmology, Optical Coherence Tomography (OCT) imaging devices provide a non-invasive way to obtain the cross-sectional representation of the tissues that compose the retina. This imaging modality is used in many medical diagnostic procedures to identify a broad range of eye fundus-related diseases, both eye-specific and systemic to the body.
Diabetic Macular Edema (DME) is considered one of the main ocular pathologies related to the vision loss. It consists of abnormal fluid regions located in the macular area. Based on the OCT imaging modality, three types of structural patterns were clinically established for this pathology: Diffuse Retinal Thickening (DRT), Cystoid Macular Edema (CME) and Serous Retinal Detachment (SRD). Currently, the diagnostic process is carried out manually by clinical experts in a complex and tedious process that is conditioned by subjective factors. Thus, a methodology that automatically performs the analysis of OCT images is of great interest in the ophthalmological field.
2. Methodology
The developed system automatically identifies and characterizes the three associated pathological types of DME, generating color maps that facilitate the visual inspection of the specialist [1]. To achieve this, the system firstly identifies the layers of the retina that make up the boundaries of the region of interest. Within this region, representative samples were extracted and, after being selected the most relevant features by means of a feature selection strategy, used to train specific models for each type of DME [2]. Finally, the models are used to create intuitive color maps [3] representing the three DME types, thus facilitating the clinical work.
3. Results
The proposed system was validated using 96 OCT images that were labeled by an expert. With this ground truth, we have selected representative samples to create the training and test sets for each pathological type. In total, we extracted 1.811 representative samples. The CME dataset contains 968 samples, the DRT dataset 559 samples and the SRD dataset 284 samples; all of them including both pathological and healthy patterns.
The feature selection process resulted in the most relevant being Gabor filters, Histogram of Oriented Gradients and Local Binary Patterns. Regarding the trained models, the Linear Discriminant Classifier reached the best test accuracy of 90.49% with the CME dataset. On the other hand, the k Nearest Neighbors with was the chosen model for the DRT dataset with an 93.23% of test accuracy. Finally, the Parzen classifier is the model that achieved the best accuracy for the SRD dataset with an 88.87% of test accuracy. Using these models, we can generate a color map for each of the different pathological detections and effectively assists clinical experts with a merged intuitive visualization (Figure 1).
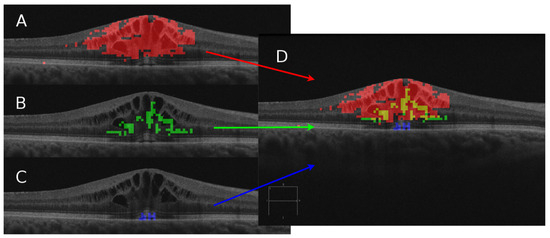
Figure 1.
The three individual DME detections and the final merged pathological map. (A) CME in red. (B) DRT in green. (D) SRD in blue. (D) Global color map.
Author Contributions
Conceptualization, J.N. and M.O.; methodology, I.O., P.L.V. and J.d.M.; software, I.O. and P.L.V.; validation, I.O., P.L.V. and J.d.M.; formal analysis, I.O. and P.L.V.; investigation, I.O., P.L.V. and J.d.M.; resources, J.N. and M.O.; data curation, I.O.; writing–original draft preparation, I.O.; writing–review and editing, P.L.V. and J.N.; visualization, I.O.; supervision, P.L.V. and J.N.; project administration, J.N. and M.O.; funding acquisition, J.N. and M.O.
Funding
This research was funded by Instituto de Salud Carlos III grant number DTS18/00136, Ministerio de Ciencia, Innovación y Universidades grant numbers DPI 2015-69948-R and RTI2018-095894-B-I00, Xunta de Galicia through the accreditation of Centro Singular de Investigación 2016–2019, Ref. ED431G/01, Xunta de Galicia through Grupos de Referencia Competitiva, Ref. ED431C 2016-047 and Ministerio de Educación y Formación Profesional grant number 18CO1/006199.
Conflicts of Interest
The authors declare no conflict of interest.
References
- Otero, I.; Vidal, P.L.; Moura, J.; Novo, J.; Rouco, J.; Ortega, M. Computerized tool for identification and enhanced visualization of Macular Edema regions using OCT scans. In Proceedings of the European Symposium on Artificial Neural Networks, Computational Intelligence and Machine Learning, Bruges, Belgium, 24–26 April 2019; pp. 565–570. [Google Scholar]
- de Moura, J.; Vidal, P.L.; Novo, J.; Rouco, J.; Ortega, M. Feature definition, analysis and selection for cystoid region characterization in Optical Coherence Tomography. In Knowledge-Based and Intelligent Information & Engineering Systems, Proceedings of the 21st International Conference KES-2017, Marseille, France, 6–8 September 2017; Elsevier, 2017; pp. 1369–1377. Available online: https://www.sciencedirect.com/science/article/pii/S1877050917313844 (accessed on 31 July 2019).
- Vidal, P.L.; de Moura, J.; Novo, J.; Penedo, M.G.; Ortega, M. Intraretinal fluid identification via enhanced maps using optical coherence tomography images. Biomed. Opt. Express 2018, 9, 4730–4754. [Google Scholar] [CrossRef] [PubMed]
Publisher’s Note: MDPI stays neutral with regard to jurisdictional claims in published maps and institutional affiliations. |
© 2019 by the authors. Licensee MDPI, Basel, Switzerland. This article is an open access article distributed under the terms and conditions of the Creative Commons Attribution (CC BY) license (https://creativecommons.org/licenses/by/4.0/).