Proceeding Paper

Double-Shot 3-D Displacement Field Measurement Using Hyperspectral Interferometry †

Wolfson School of Mechanical, Electrical and Manufacturing Engineering, Loughborough University, Loughborough, Leicestershire LE11 3TU, UK
*
Author to whom correspondence should be addressed.
Presented at the 18th International Conference on Experimental Mechanics (ICEM18), Brussels, Belgium, 1–5 July 2018.
Proceedings 2018, 2(8), 518; https://doi.org/10.3390/ICEM18-05406
Published: 28 June 2018
(This article belongs to the Proceedings of The 18th International Conference on Experimental Mechanics)

Abstract

:
A combination of a Michelson interferometer, a micro-optic element and a hyperspectral imager is used with broadband illumination to measure depth-resolved out-of-plane displacements without any scanning. Reference and deformed states of a transparent sample are recorded in single shots and used to evaluate the displacement field at different interfaces.

1. Introduction

Optical Coherence Tomography (OCT) is an established technique than has evolved into a multitude of variants that can provide volume reconstructions of different parameters within the volume of semitransparent scattering materials and tissues (such as scattering potential, phase, optical axis orientation, birefringence, velocity, etc. [1]). Two common approaches are time- and spectral-domain optical coherence tomography (TD-OCT and SD-OCT). TD-OCT (closely related to Coherent Scanning Interferometry or White Light Interferometry) is usually based on a conventional Michelson interferometer with a broadband light source. Through thickness information is obtained by axially sweeping the reference mirror and observing best fringe contrast vs position. SD-OCT obtains depth information from the spatial frequency of interference fringes along the wavenumber axis of a spectrometer when broadband illumination is used, or from the temporal frequency of interference fringes if a tunable laser is used instead. Other conventional microscopy techniques (such as confocal or light sheet) can be combined with Digital Volume Correlation (DVC) to evaluate displacement fields from 3-D scans of the sample before and after loading. All these methods are dependent on at least one form of scanning to record all the necessary spatial and spectral information over an area of the sample, which increases acquisition time and sensitivity to vibrations and temperature changes.
Hyperspectral Interferometry (HSI) is a recently-proposed technique for measuring 3-D point clouds from an opaque object in a single shot [2,3,4]. Single shot acquisition with pulsed illumination can make the technique sufficiently rugged for use on a production line. We describe here an extension of the technique which allows the measurement of both structure and displacement fields, through the thickness of a transparent material. Only a pair of single shot acquisitions is required, one for the reference and one for the deformed state, respectively.

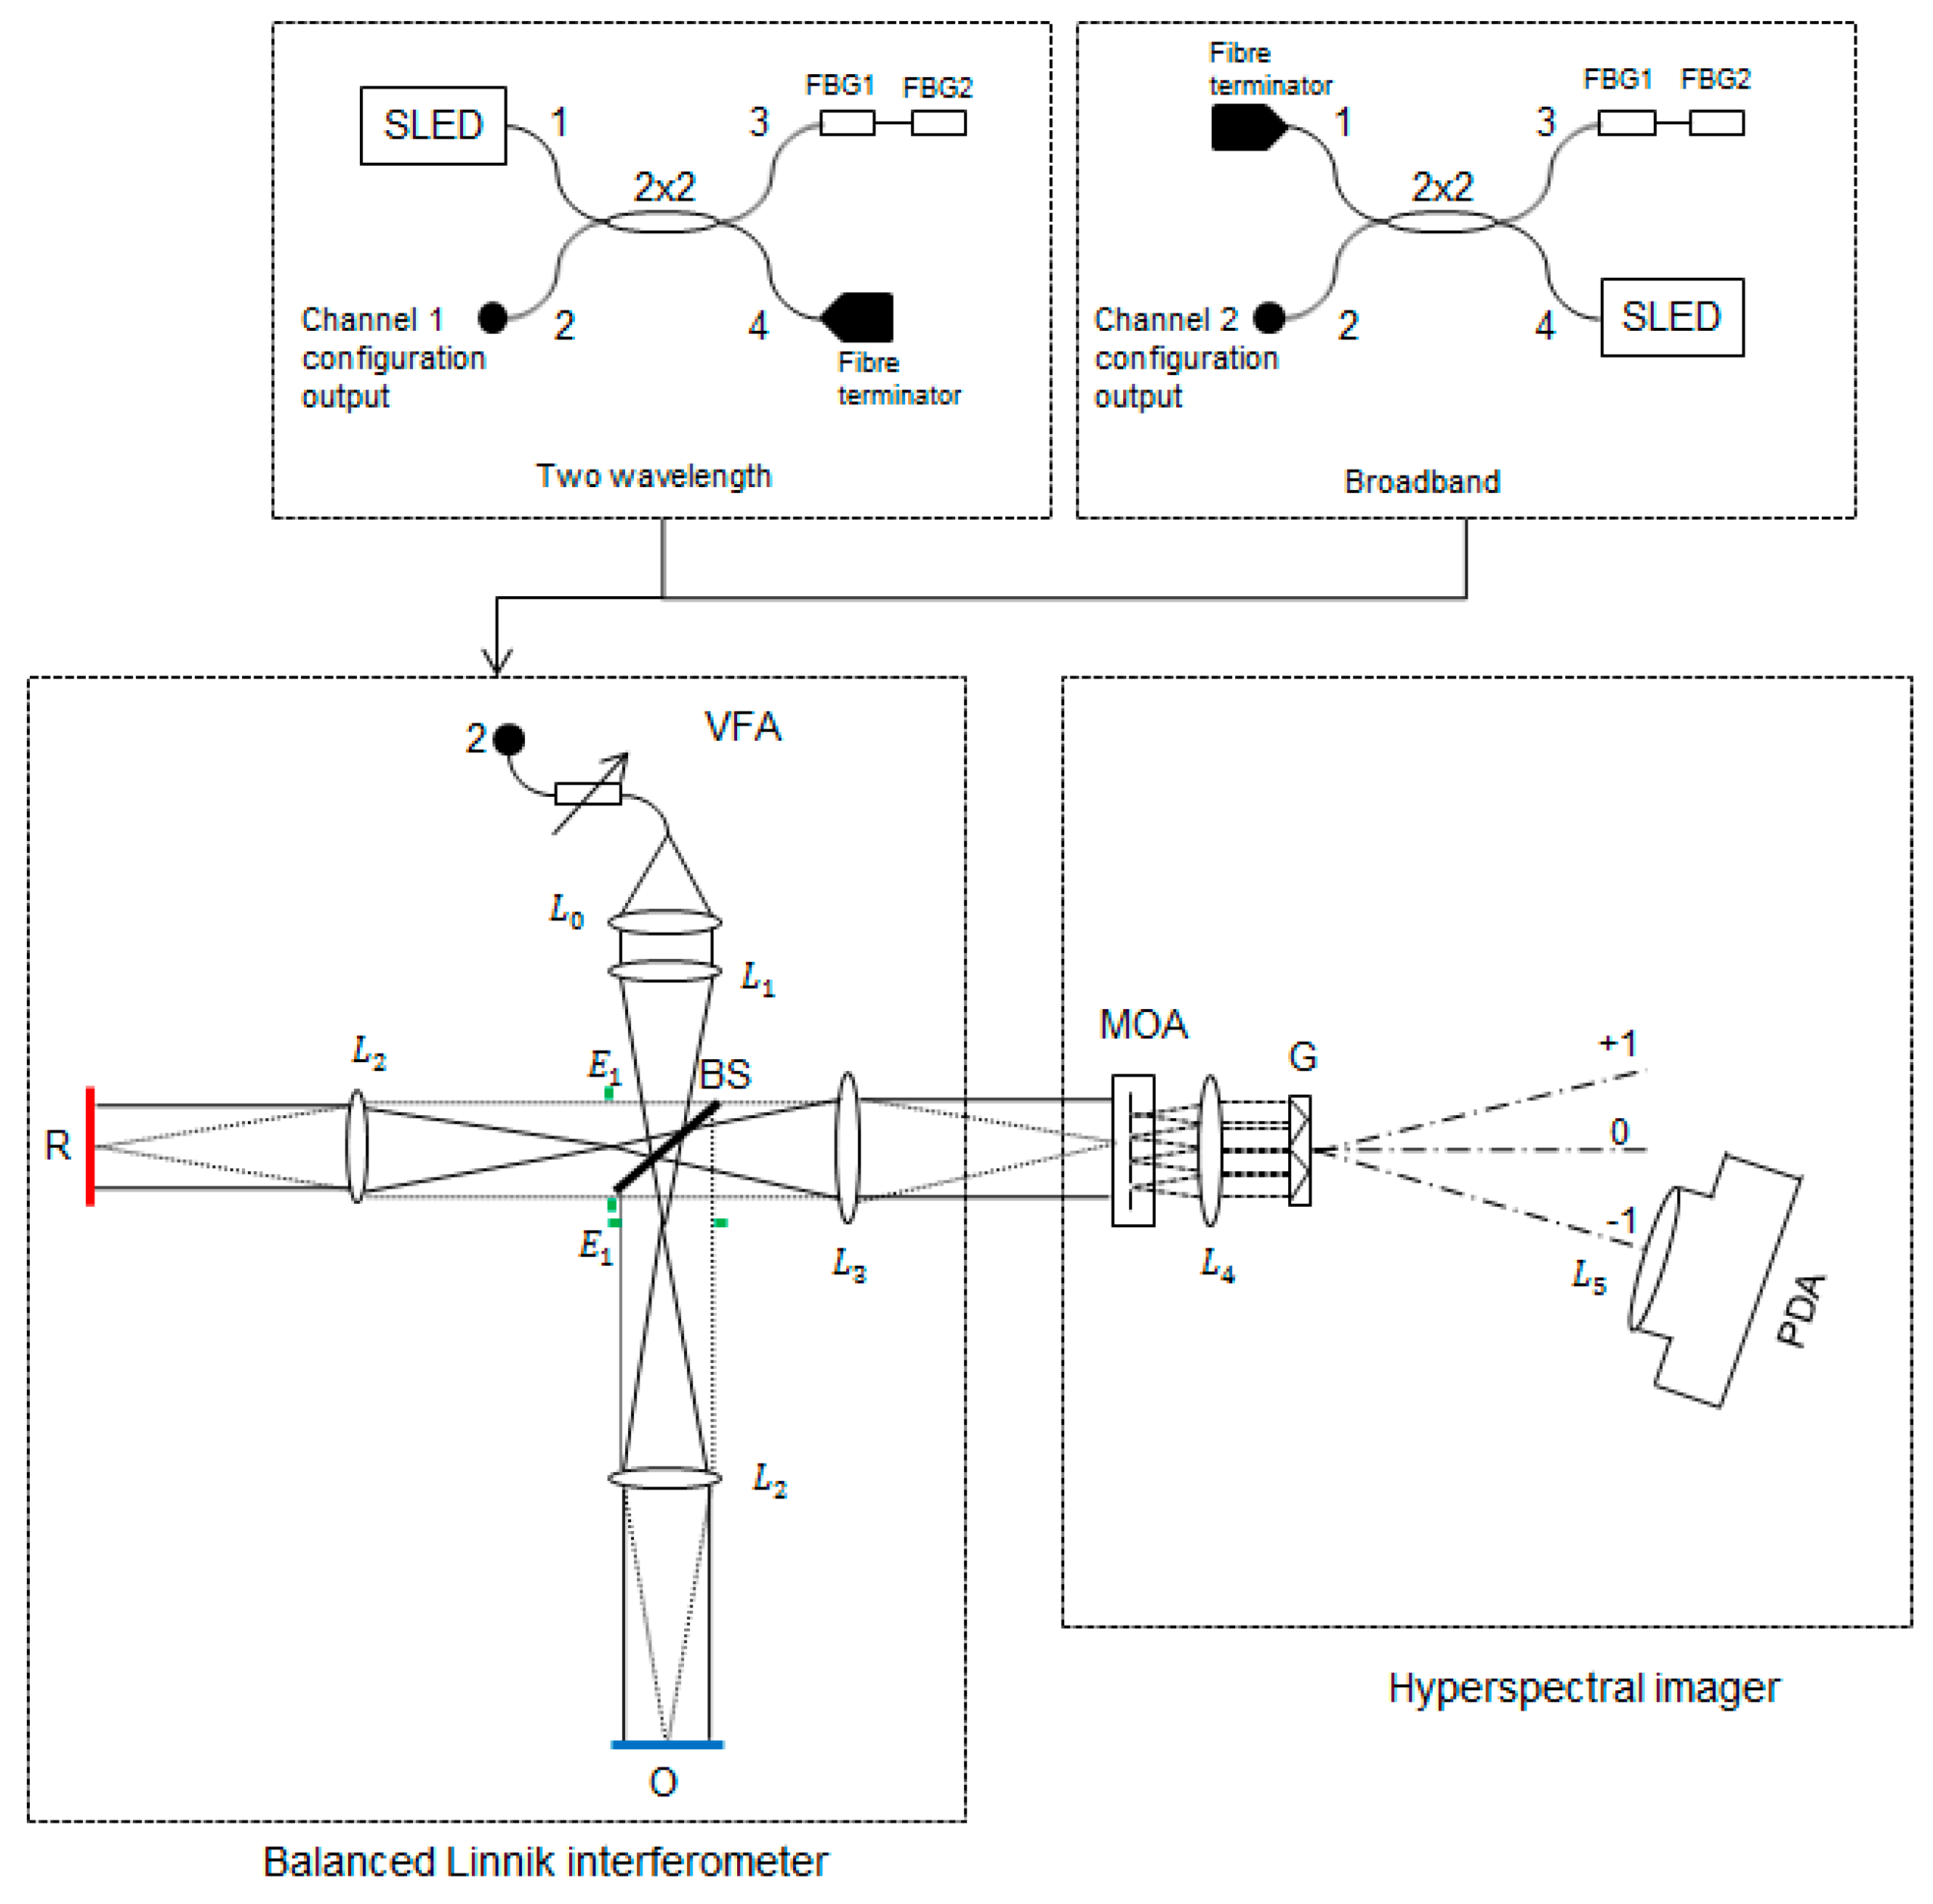
2. Materials and Methods
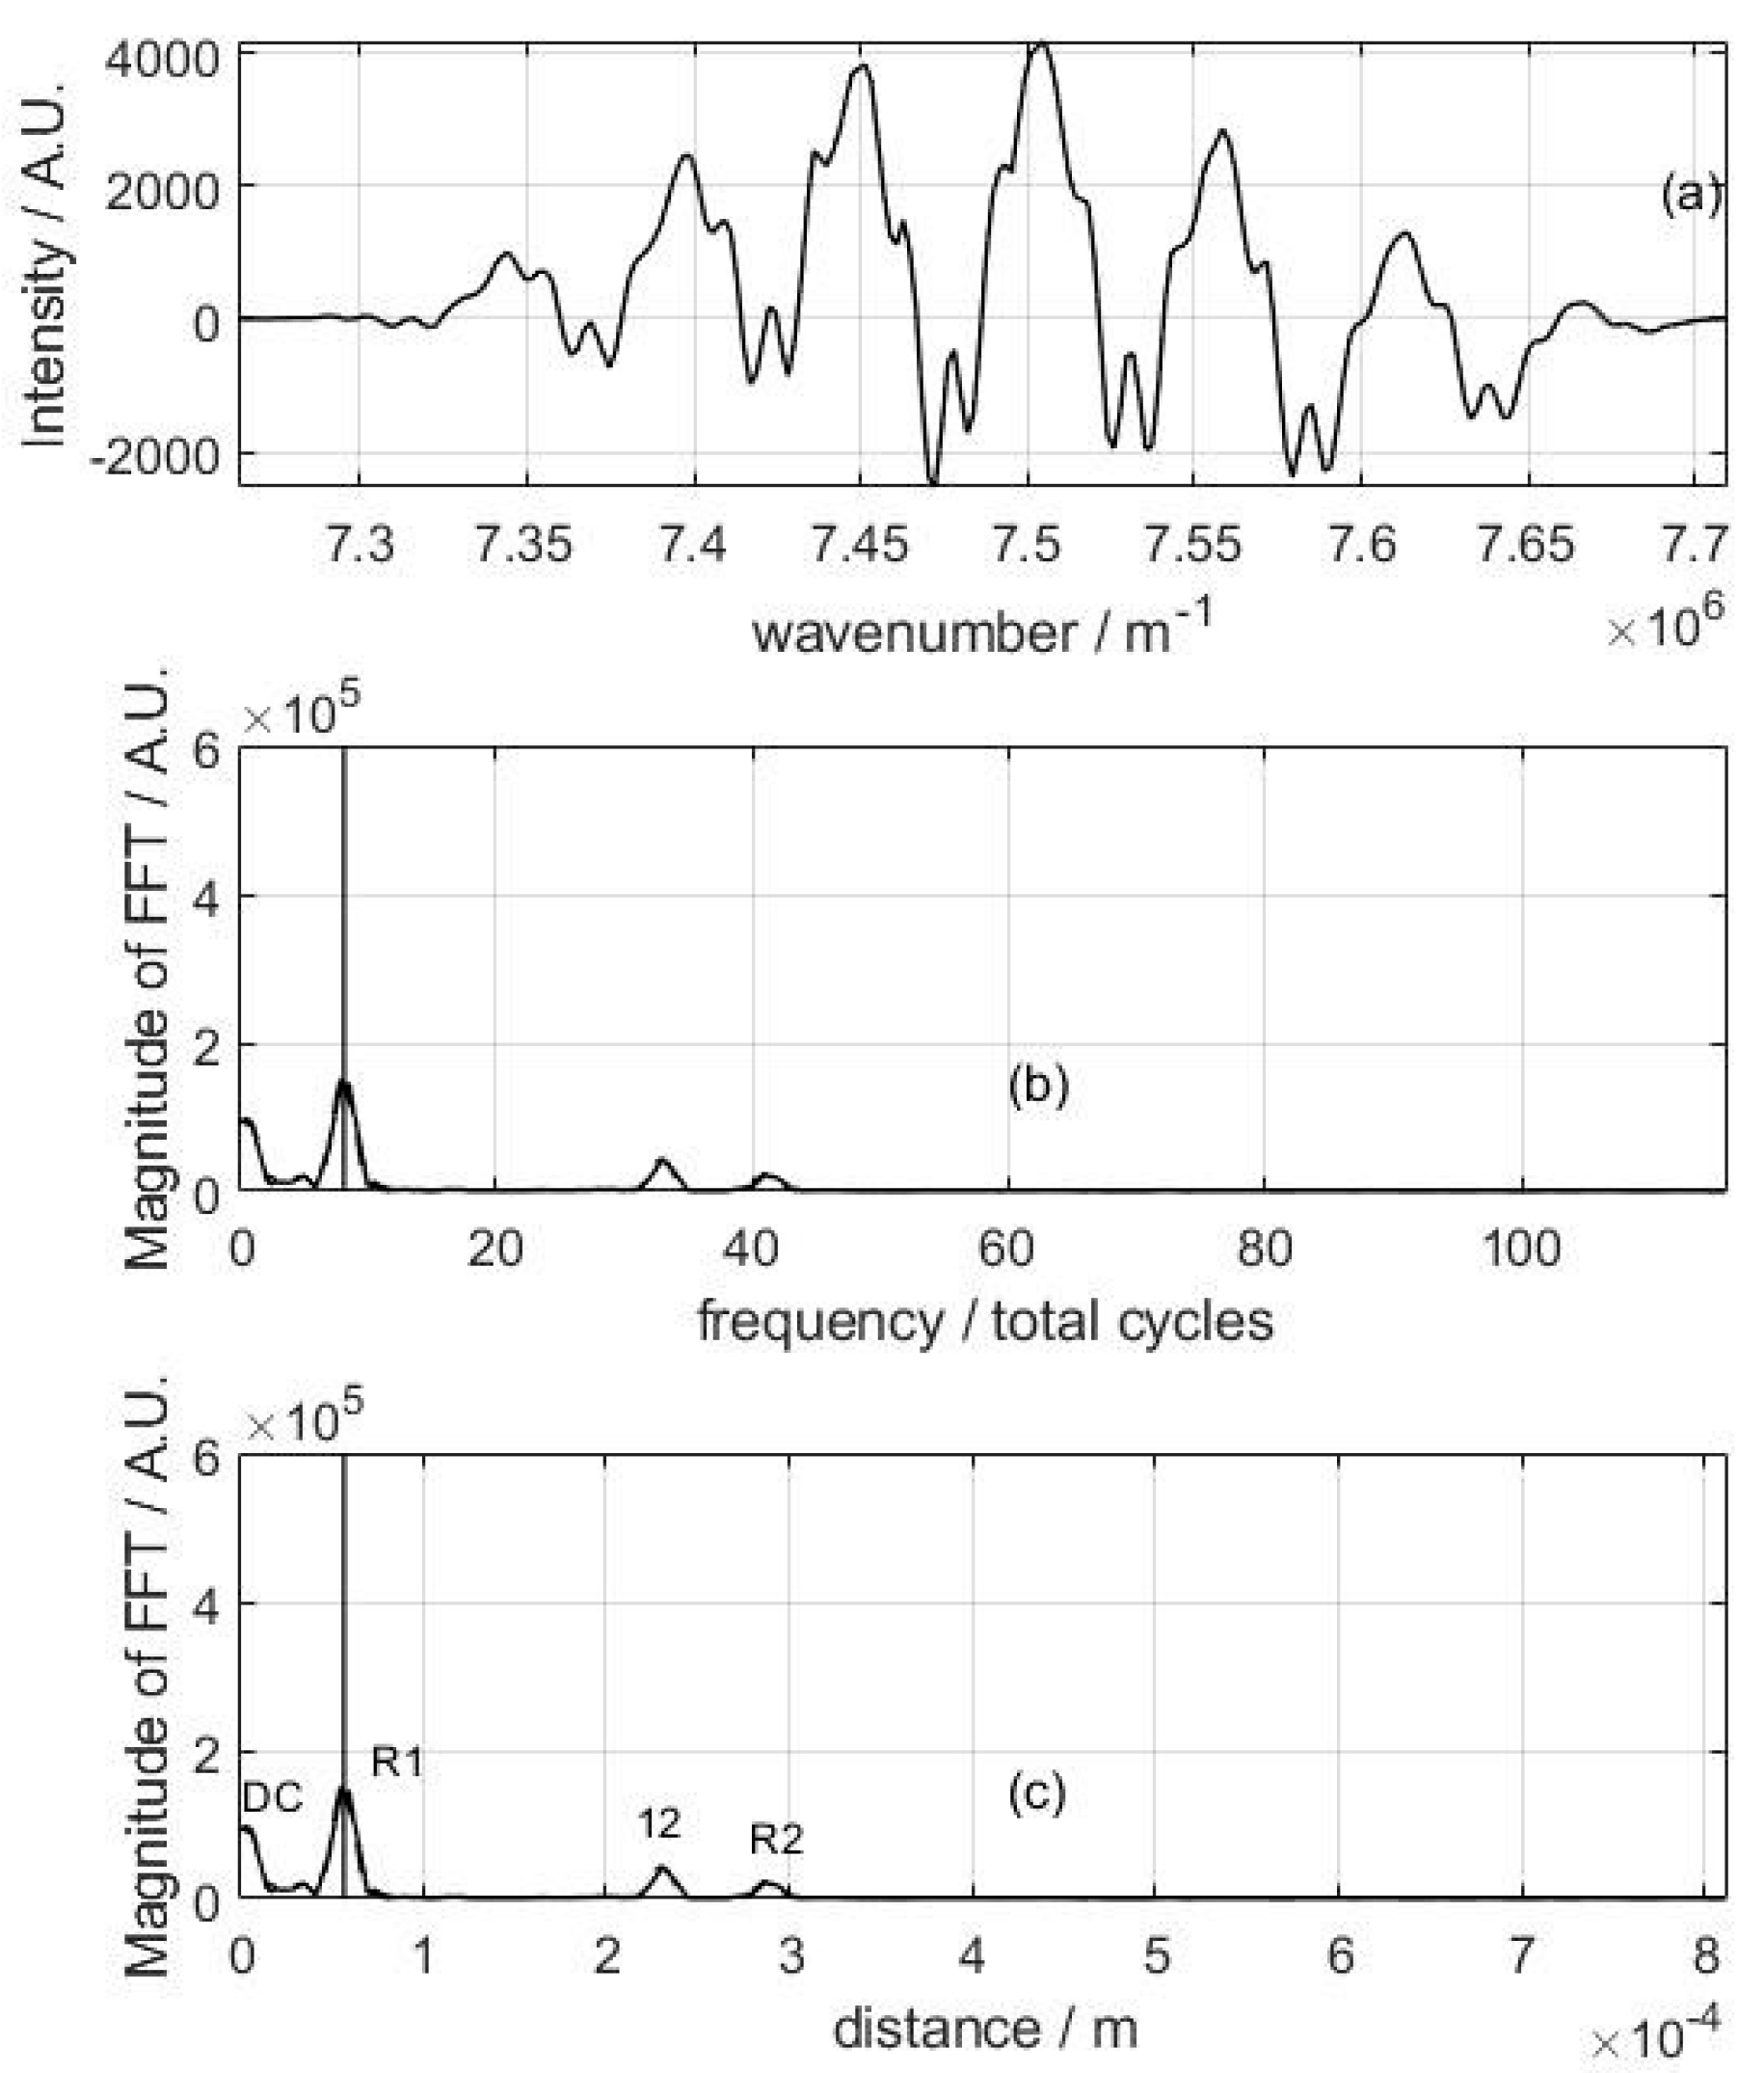
The system used here is shown in Figure 1. It combines a broadband source, a Linnik interferometer, and an imaging spectrometer originally developed for astronomy applications [5], and is similar to the configuration described in [4]:
The system samples, with an array of 50 × 50 channels at the input of the Hyperspectral imager, the image plane of an objective lens that captures back-scattered light from the sample. Each of the 50 × 50 micro optical elements has a pitch of 120 μm, defining the spatial resolution of the system in X-Y and resulting in an effective field of view of 5.88 × 5.88 mm. In the spectrometer, each channel combines light from a reference wave, and is dispersed by a grating so as to produce a 1-D interference signal I(k), where k denotes wavenumber. All the spatial and spectral information required to reconstruct from a specular medium the 3-D internal microstructure and one component of a given displacement field is thus recorded in a single shot, using a 2-D photodetector array.

3. Results

Figure 2a shows an example of I(k), for one channel in the case of a gold coated mirror. The signal consists of a single frequency modulated by a spectral envelope; the frequency encodes distance to the corresponding region of the sample for this particular channel which is revealed by its Fourier transform (Figure 2b,c). As a simple example of the ability of the system to measure depth-resolved displacement fields, a 160 μm thick glass cover-slip was subject to a small out-of-plane tilt. Figure 2 shows I(k) for this sample. Unlike the case of the single reflective surface in Figure 2, the interference signal is now a superposition between the reference beam and the reflections on the front and back glass-air interfaces. The interference signal is more complex as there are several optical path differences corresponding to those interfaces, but the information from front and back surfaces reflections is again separated by Fourier analysis (see Figure 2). The R1 and R2 peaks in Figure 3c) correspond to the front and back surfaces of the glass; the apparent separation between them (~240 μm) is increased by a factor equal to the refractive index of the glass (n = 1.5).
Depth-resolved displacements are measured by the use of the phase information in the Fourier transform of I(k), in the same way as in phase contrast Wavelength Scanning Interferometry [6]. By comparing two states before and after deformation, phase changes are used to determine 3-D displacement fields with out-of-plane sensitivity. As the data for a given deformation state is recorded in a single image, this allows for potential sub-surface displacement and strain mapping of moving targets, unlike the case with WSI where several seconds may be needed to perform a scan, leading to phase jitter noise and vibration artefacts.
The phase at the R1 and R2 peaks (see Figure 3c) was measured from the real and imaginary parts of the Fourier transform signal, both before and after the small tilt. The front surface was located 50 µm away from the position of zero optical path difference; this allowed the cross correlation term corresponding to the back surface to be separated from the autocorrelation term that arises from the interference between front and back surface reflections (peak 12 in Figure 3c). Figure 4 shows the wrapped phase obtained for the front and back surfaces of the glass cover slip before and after tilt. The unwrapped phase difference was then evaluated for each surface, to obtain the out-of-plane displacement fields shown in Figure 5.

4. Discussion and Conclusions

We have demonstrated the ability of Hyperspectral Interferometry to measure depth-resolved displacement fields through transparent media, only requiring two single shots for reference and deformed states to acquire all the necessary spatial and spectral information. The absence of time consuming scanning of any type makes the system robust against environmental disturbances such as vibrations or convection and enables the study of transient phenomena. Short exposure times or pulsed illumination would enable, for instance, the study of propagation of cracks within laminates.

Author Contributions

T.V.R. built the optical setup, performed the experiments and data analysis; P.D.R. and J.M.H. conceived the instrument, the data analysis methodology and supervised the project.

Acknowledgments

The authors would like to thank Renishaw PLC and the EPSRC Centre for Doctoral Training in Embedded Intelligence for their support, EP/L014998/1.

Conflicts of Interest

The authors declare no conflict of interest.

References

  1. Drexler, W.; Fujimoto, J.G. Optical Coherence Tomography; Springer: Berlin/Heidelberg, Germany, 2015. [Google Scholar]
  2. Huntley, J.M.; Widjanarko, T.; Ruiz, P.D. Hyperspectral interferometry for single-shot absolute measurement of two-dimensional optical path distributions. Meas. Sci. Technol. 2010, 21, 075304. [Google Scholar] [CrossRef]
  3. Widjanarko, T.; Huntley, J.M.; Ruiz, P.D. Single-shot profilometry of rough surfaces using Hyperspectral Interferometry. Opt. Lett. 2012, 37, 350–352. [Google Scholar] [CrossRef] [PubMed]
  4. Ruiz, P.D.; Huntley, J.M. Single-shot areal profilometry using hyperspectral interferometry with a microlens array. Opt. Express 2017, 25, 8801–8815. [Google Scholar] [CrossRef] [PubMed]
  5. Bacon, R.; Adam, G.; Baranne, A.; Courtes, G.; Dubet, D.; Dubois, J.P.; Emsellem, E.; Ferruit, P.; Georgelin, Y.; Monnet, G.; et al. 3D spectrography at high spatial resolution. I. Concept and realization of the integral field spectrograph TIGER. Astron. Astrophys. Suppl. Ser. 1995, 113, 347–357. [Google Scholar]
  6. Ruiz, P.D.; Huntley, J.M.; Wildman, R.D. Depth-resolved whole-field displacement measurement using Wavelength Scanning Electronic Speckle Pattern Interferometry. Appl. Opt. 2005, 44, 3945–3953. [Google Scholar] [CrossRef] [PubMed]
Figure 1. Optical setup, showing: SLD: Super-luminescent light emitting diode; FBG1, FBG2: Fibre Bragg gratings; Lc: collimator; BS: beam splitter; O: object; R: reference mirror; L0, L1, L2, L3, L4 and L5: NIR achromatic lenses; E1: aperture stop; MOA: micro-optics array; G: diffraction grating and PDA: photodetector array. At the top of the imaging interferometer box, the ‘two wavelengths’ and ‘broadband’ illumination configurations are shown.
Proceedings 02 00518 g001
Figure 2. Spectral interference profile for one channel when a gold coated mirror is measured: (a) Intensity of the interference signal; (b) Fourier transform of (a), from which the peak position (vertical line) is evaluated; (c) as (b) but after scaling frequency to distance. (From [4]).
Proceedings 02 00518 g002
Figure 3. Spectral interference profile for one channel when a glass cover slip is measured. (ac) as for Fig. 1. R1 and R2 denote the front and back surfaces of the cover slip, respectively; 12 denotes the autocorrelation term due to interference between front and back reflections.
Proceedings 02 00518 g003
Figure 4. Wrapped phase corresponding to the front and back surfaces of a glass cover slip before and after a 1 mrad tilt. Axis labels denote channel indices. Black and white correspond to −π and +π, respectively.
Proceedings 02 00518 g004
Figure 5. Example out-of-plane displacement fields from both surfaces of microscope cover slip due to out-of-plane tilt in meters. An arbitrary separation of 50 µm is included between the two plots to aid visualisation.
Proceedings 02 00518 g005
Publisher’s Note: MDPI stays neutral with regard to jurisdictional claims in published maps and institutional affiliations.

