Proceeding Paper

Investigating Hydrofracture Evolution of Quasi-Brittle Material Using a Post-Peak Control Technique Associated with Speckle-Shearing Interferometry †

1
Department of Civil and Construction Engineering, National Taiwan University of Science and Technology, Taipei 10607, Taiwan
2
Department of Civil Engineering, National Taipei University of Technology, Taipei 10608, Taiwan
*
Author to whom correspondence should be addressed.
Presented at the 18th International Conference on Experimental Mechanics (ICEM18), Brussels, Belgium, 1–5 July 2018.
Proceedings 2018, 2(8), 452; https://doi.org/10.3390/ICEM18-05326
Published: 12 June 2018
(This article belongs to the Proceedings of The 18th International Conference on Experimental Mechanics)

Abstract

:
This paper presents the experimental results obtained with a post-peak loading device of hydraulic fracture controlled by setting circumferential deformation of a specimen to be a closed-loop feedback signal during servo-water-driven and monitored with the optical technique of speckle-shearing interferometry (SSI). The macro-scale complete loading curve obtained by the post-peak loading system indicate the stiffness, peak strength and post-peak behavior of quasi-brittle material subjected to borehole water pressure. The micro-scale out-of-plane displacement (OPD) obtained by SSI corresponding to complete loading curve was exhibited where the internal crack tip was located. The complete hydrofracture evolution from displacement continuity to displacement discontinuity was investigated. The test results provide a better understanding of the hydraulic fracture mechanism which is helpful for the development of theoretical and numerical solutions related to hydraulic fractures.

1. Introduction

Figure 1 shows the conventional loading history of hydraulic fracture testing [1] and demonstrates that our understanding of the post-peak deformation in the hydraulic fracture test is almost non-existent. However, Chen [2] conducted hydraulic fracture testing of rock-like material coupled with acoustic emission by using a post-peak control technique, and indicated that the AE events occurred mainly at the post-peak stage. Therefore, it is necessary to investigate the post-peak hydrofracture evolution.
To investigate the hydrofracture evolution, advanced techniques such as video camera recording, computed tomography (CT) scanning, and fluorescent methods were conducted in hydraulic fracture experiments [3,4,5,6]. However, a review of the above literature reveals that a video camera can only be used to capture the interactions of cracks and fluids in transparent materials, such as polymethyl methacrylate and glass; both CT scanning and fluorescent methods can rebuild a final fracture pattern, but the processes of crack initiation and propagation cannot be observed and recorded continually. Therefore, in this study, speckle-shearing interferometry (SSI) was employed in hydraulic fracture test with post-peak control system developed by Chen [2] to continually monitor the entire fracture evolution in real time. Note that artificial specimens made of type I Portland cement, quartz sand, and water, were used as quasi-brittle samples.

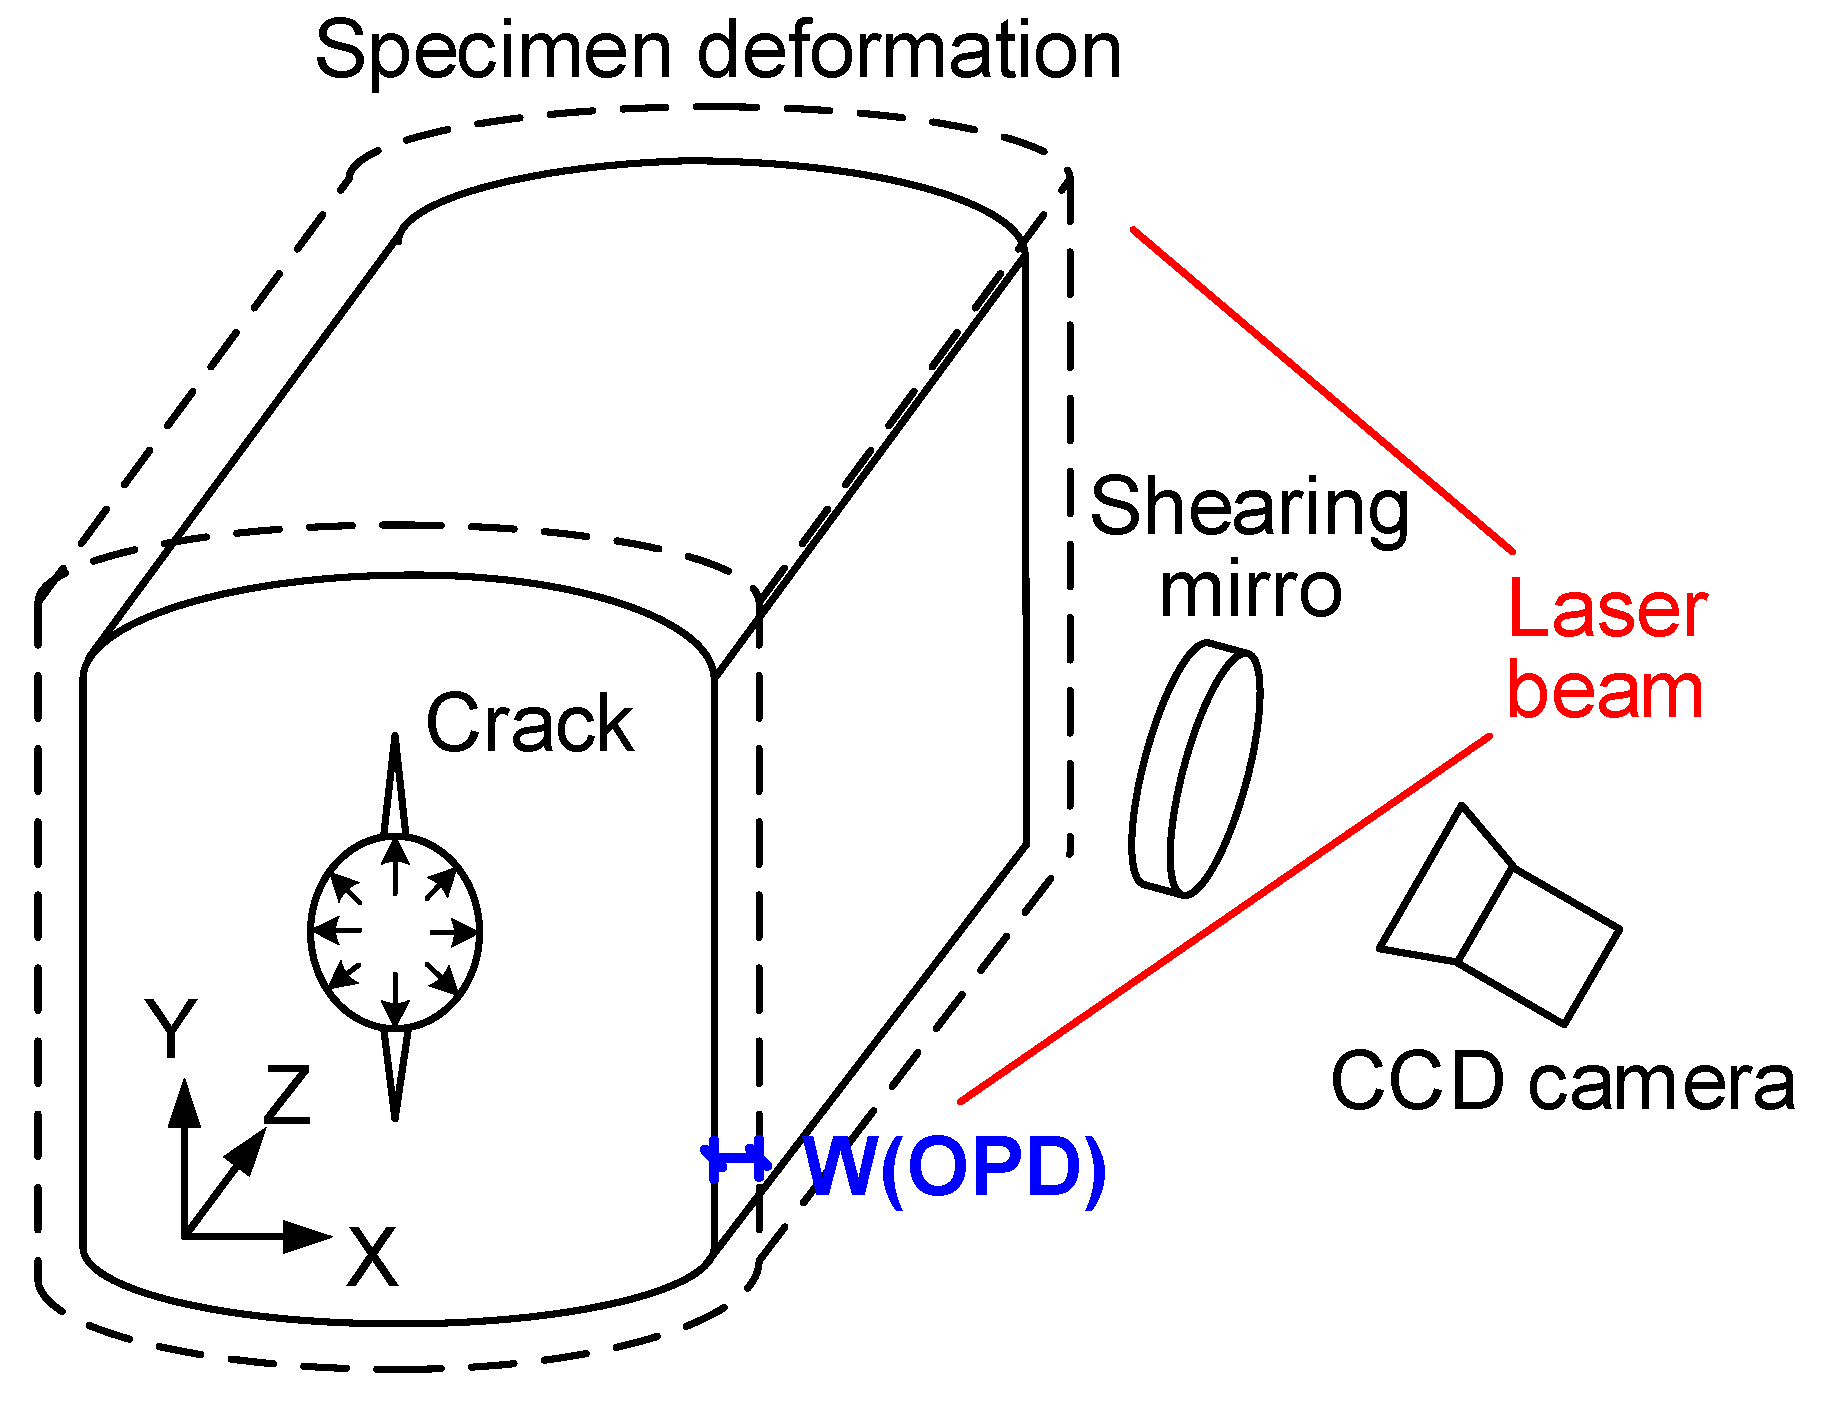
2. Speckle-Shearing Interferometry

In the early 1970s, Butters and Leendertz [7] integrated holographic interferometry with a camera and computer to invent electronic speckle pattern interferometry (ESPI), which eliminates the need for film development because it acquires images through a camera and stores them in a computer. This technique represents a breakthrough in the application of optical theories in displacement measurement. Afterwards, Leendertz and Butters [8] used ESPI and two lenses as a shearing mechanism to measure displacement gradient (strain); on that basis, they proposed SSI.
SSI has been used to detect defects in oil and gas pipelines, to measure corrosion- or fatigue-induced cracks on boiler tubes, to perform vibration analysis and damage identification on cantilevered aluminum plates, to test residual stress in composite structures, and to inspect faults in aircraft.

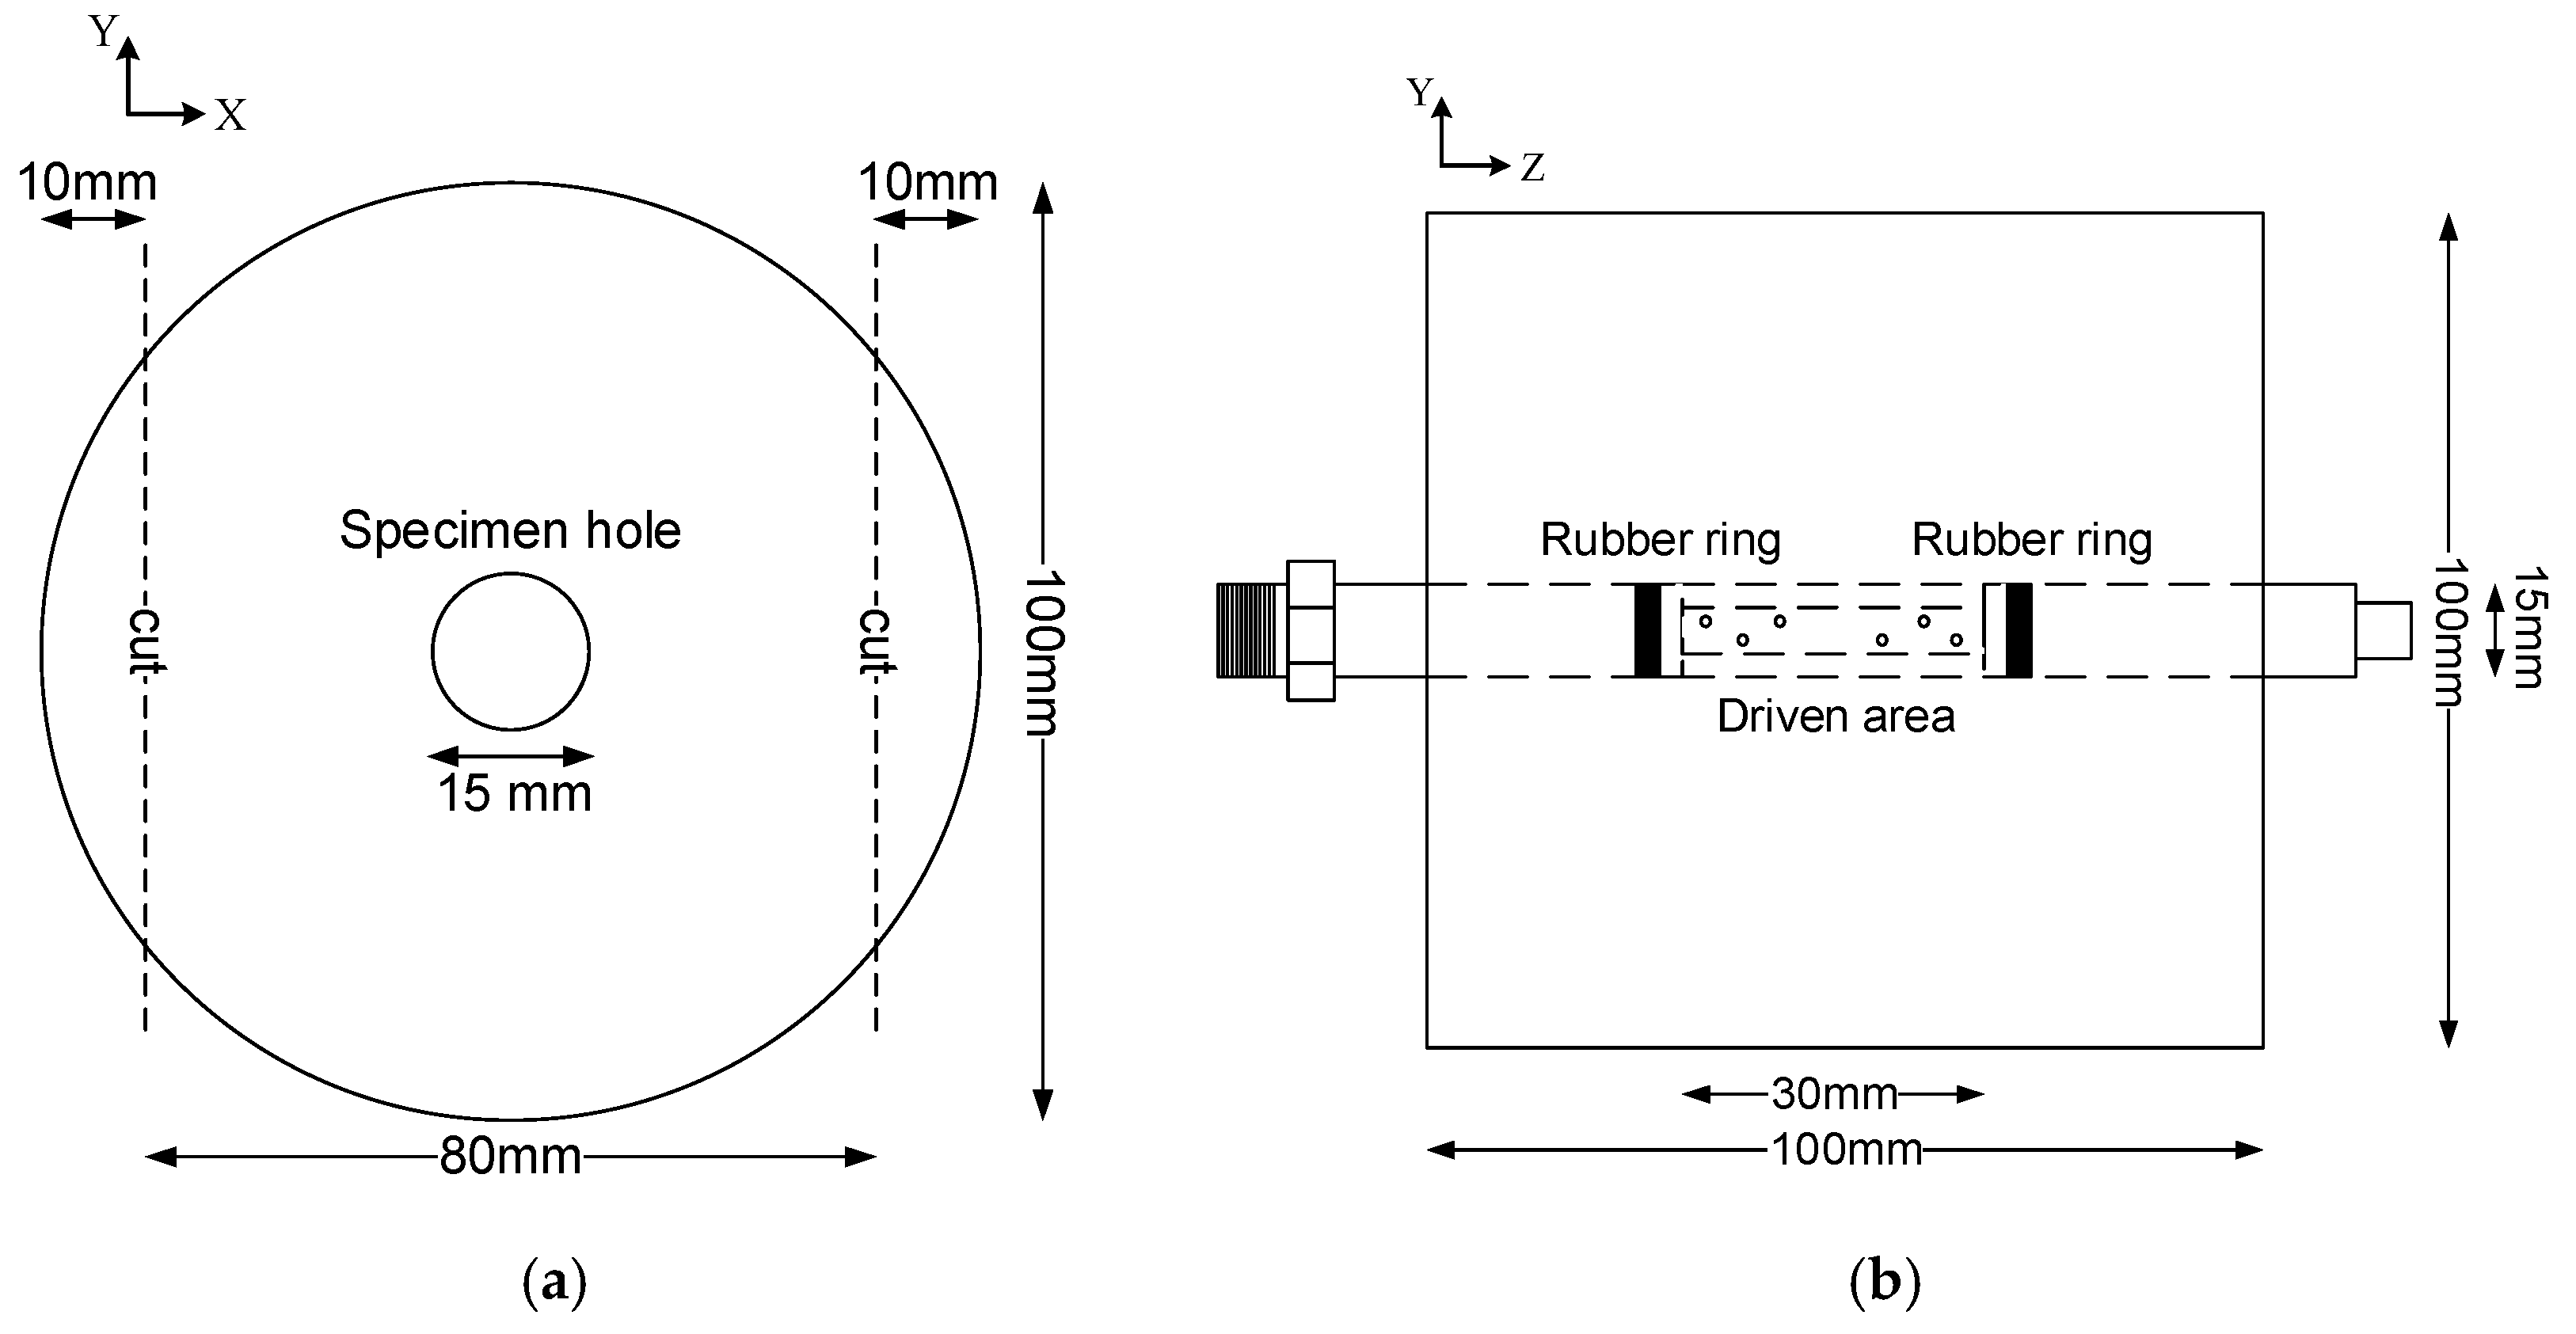
3. Test material and Specimen Preparation

Quasi-brittle material were produced from cement-based mortar. The matrix used was type I Portland cement. A fine aggregate of quartz sand with uniform granules (average diameter was 1.02 mm) was used. Water was purified by reverse osmosis. The ratio of cement, sand, and water was 1:2.75:0.5, and the mixture was cured for more than 28 days.
Figure 2 shows a hollow cylindrical specimen that measured 100 mm long, with an outer diameter of 100 mm and an inner diameter of 15 mm. The opposite sides of the specimen were cut to optimize the SSI measurements, as shown in Figure 2a.

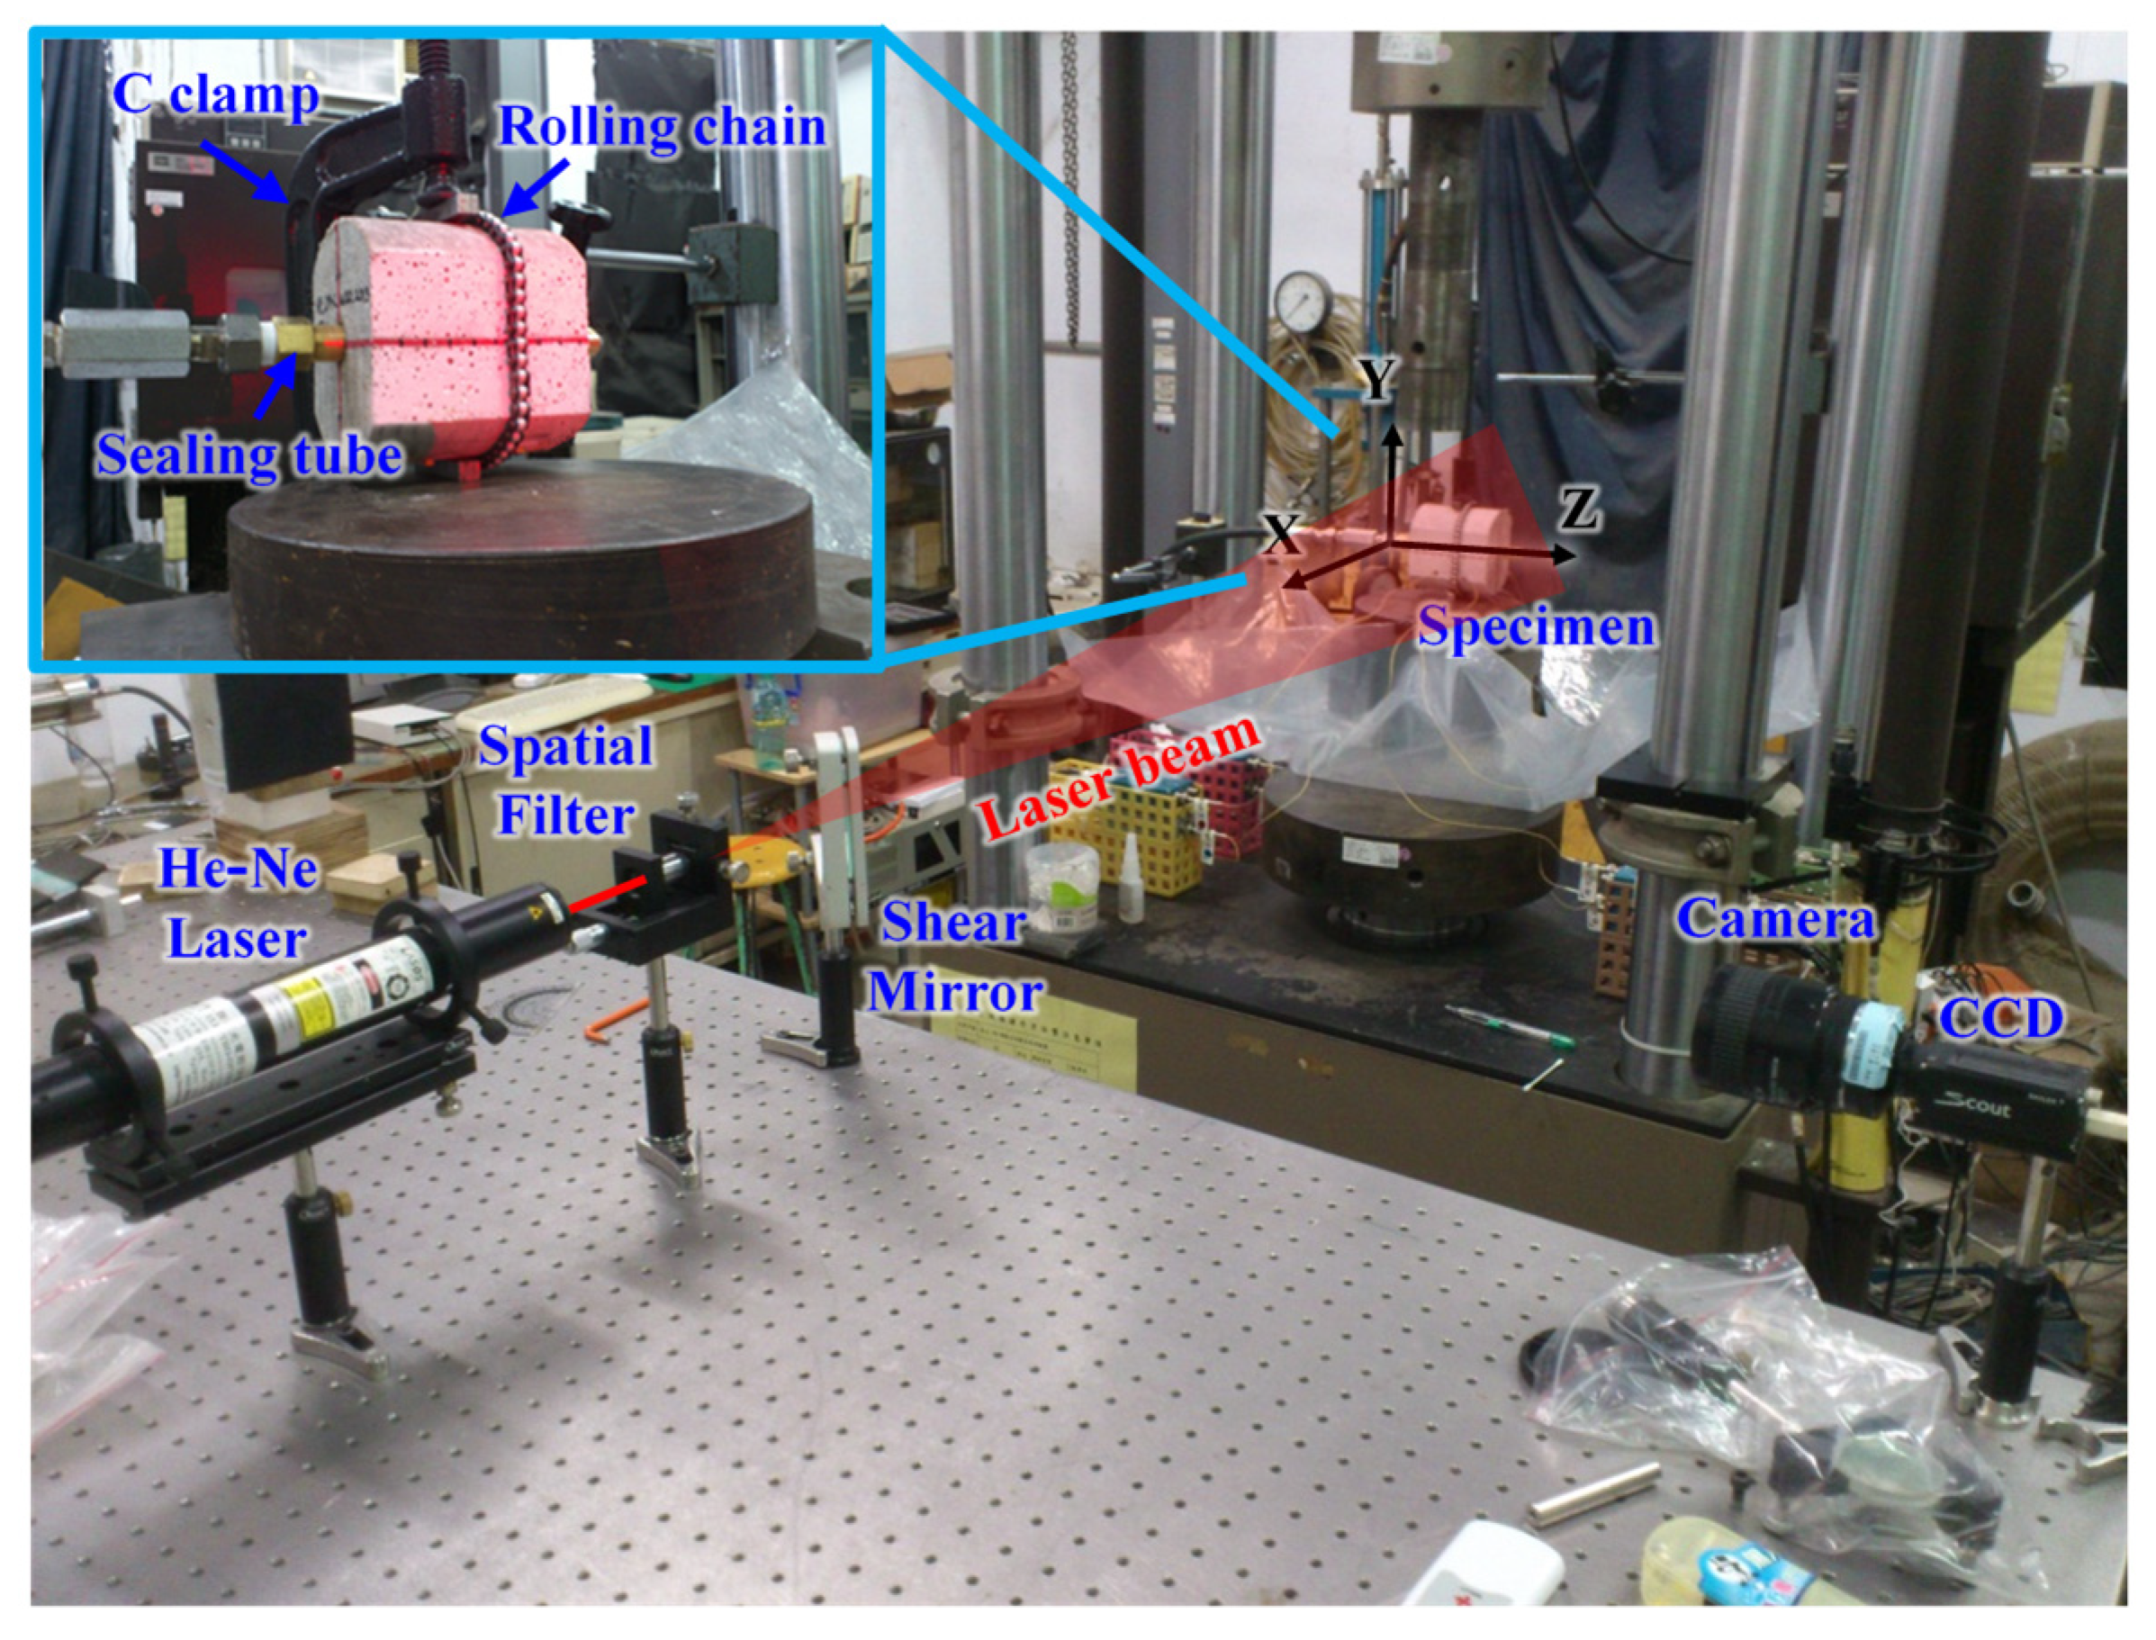
4. Experimental Setup of Hydraulic Fracture and SSI

4.1. Hydraulic Fracture Apparatus with Post-Peak Control System

To enable the investigation of post-peak behavior, a hydraulic fracture device was built with a feedback signal control that prevented unstable crack growth (Figure 3). This device included a pumping machine, a sealing tube, and an axial extensometer. The pumping machine provided the fluid loading through the sealing tube for each test specimen. The sealing tube was placed inside the specimen, as shown in Figure 2. A driven region within the 30-mm-long central part of the tube was sealed by double rubber rings. The changes of specimen circumference during the test were recorded by an axial extensometer installed through a roller chain, as shown in Figure 3. The circumference change information of the specimen was used as a feedback signal to automatically control the pressure of the water. Thus, the injected water pressure was controlled by circumferential deformation; as a result, a complete loading process was obtained.

4.2. Optical Equipment

The optical apparatus for SSI (Figure 4) included the following devices: (1) He-Ne laser, (2) spatial filter, (3) shearing mirror, (4) camera, and (5) charge-coupled device (CCD). The He-Ne laser had an output power of 15 mV and a wavelength of 0.6328 μm. The spatial filter used lenses and pinholes to filter and diffuse the laser beam. The shearing mirror split the incident laser beams to produce the interference. The camera was a Micro Nikon 60 mm F2.8D, fitted with a macro lens produced by Nikon, Tokyo, Japan. The CCD was a Basler (A601F, Basler AG, Ahrensburg, Germany), a digital CCD that transferred image data from a frame grabber to a computer. All of the aforementioned devices were placed on an optical table that filtered high-frequency shocks to ensure the acquisition of interference images of high quality for analysis.

5. Results and Discussion

By incorporating the nondestructive SSI technique into the monitoring system the hydraulic fracture equipment with a post-peak control system provided data on fluid/brittle material interaction during the crack formation. With full control over the stabilized crack growth, the entire loading curve of macro-scale and OPD observations of micro-scale were obtained. Its deformation field, measurement field and defined coordinate system are shown in Figure 5.

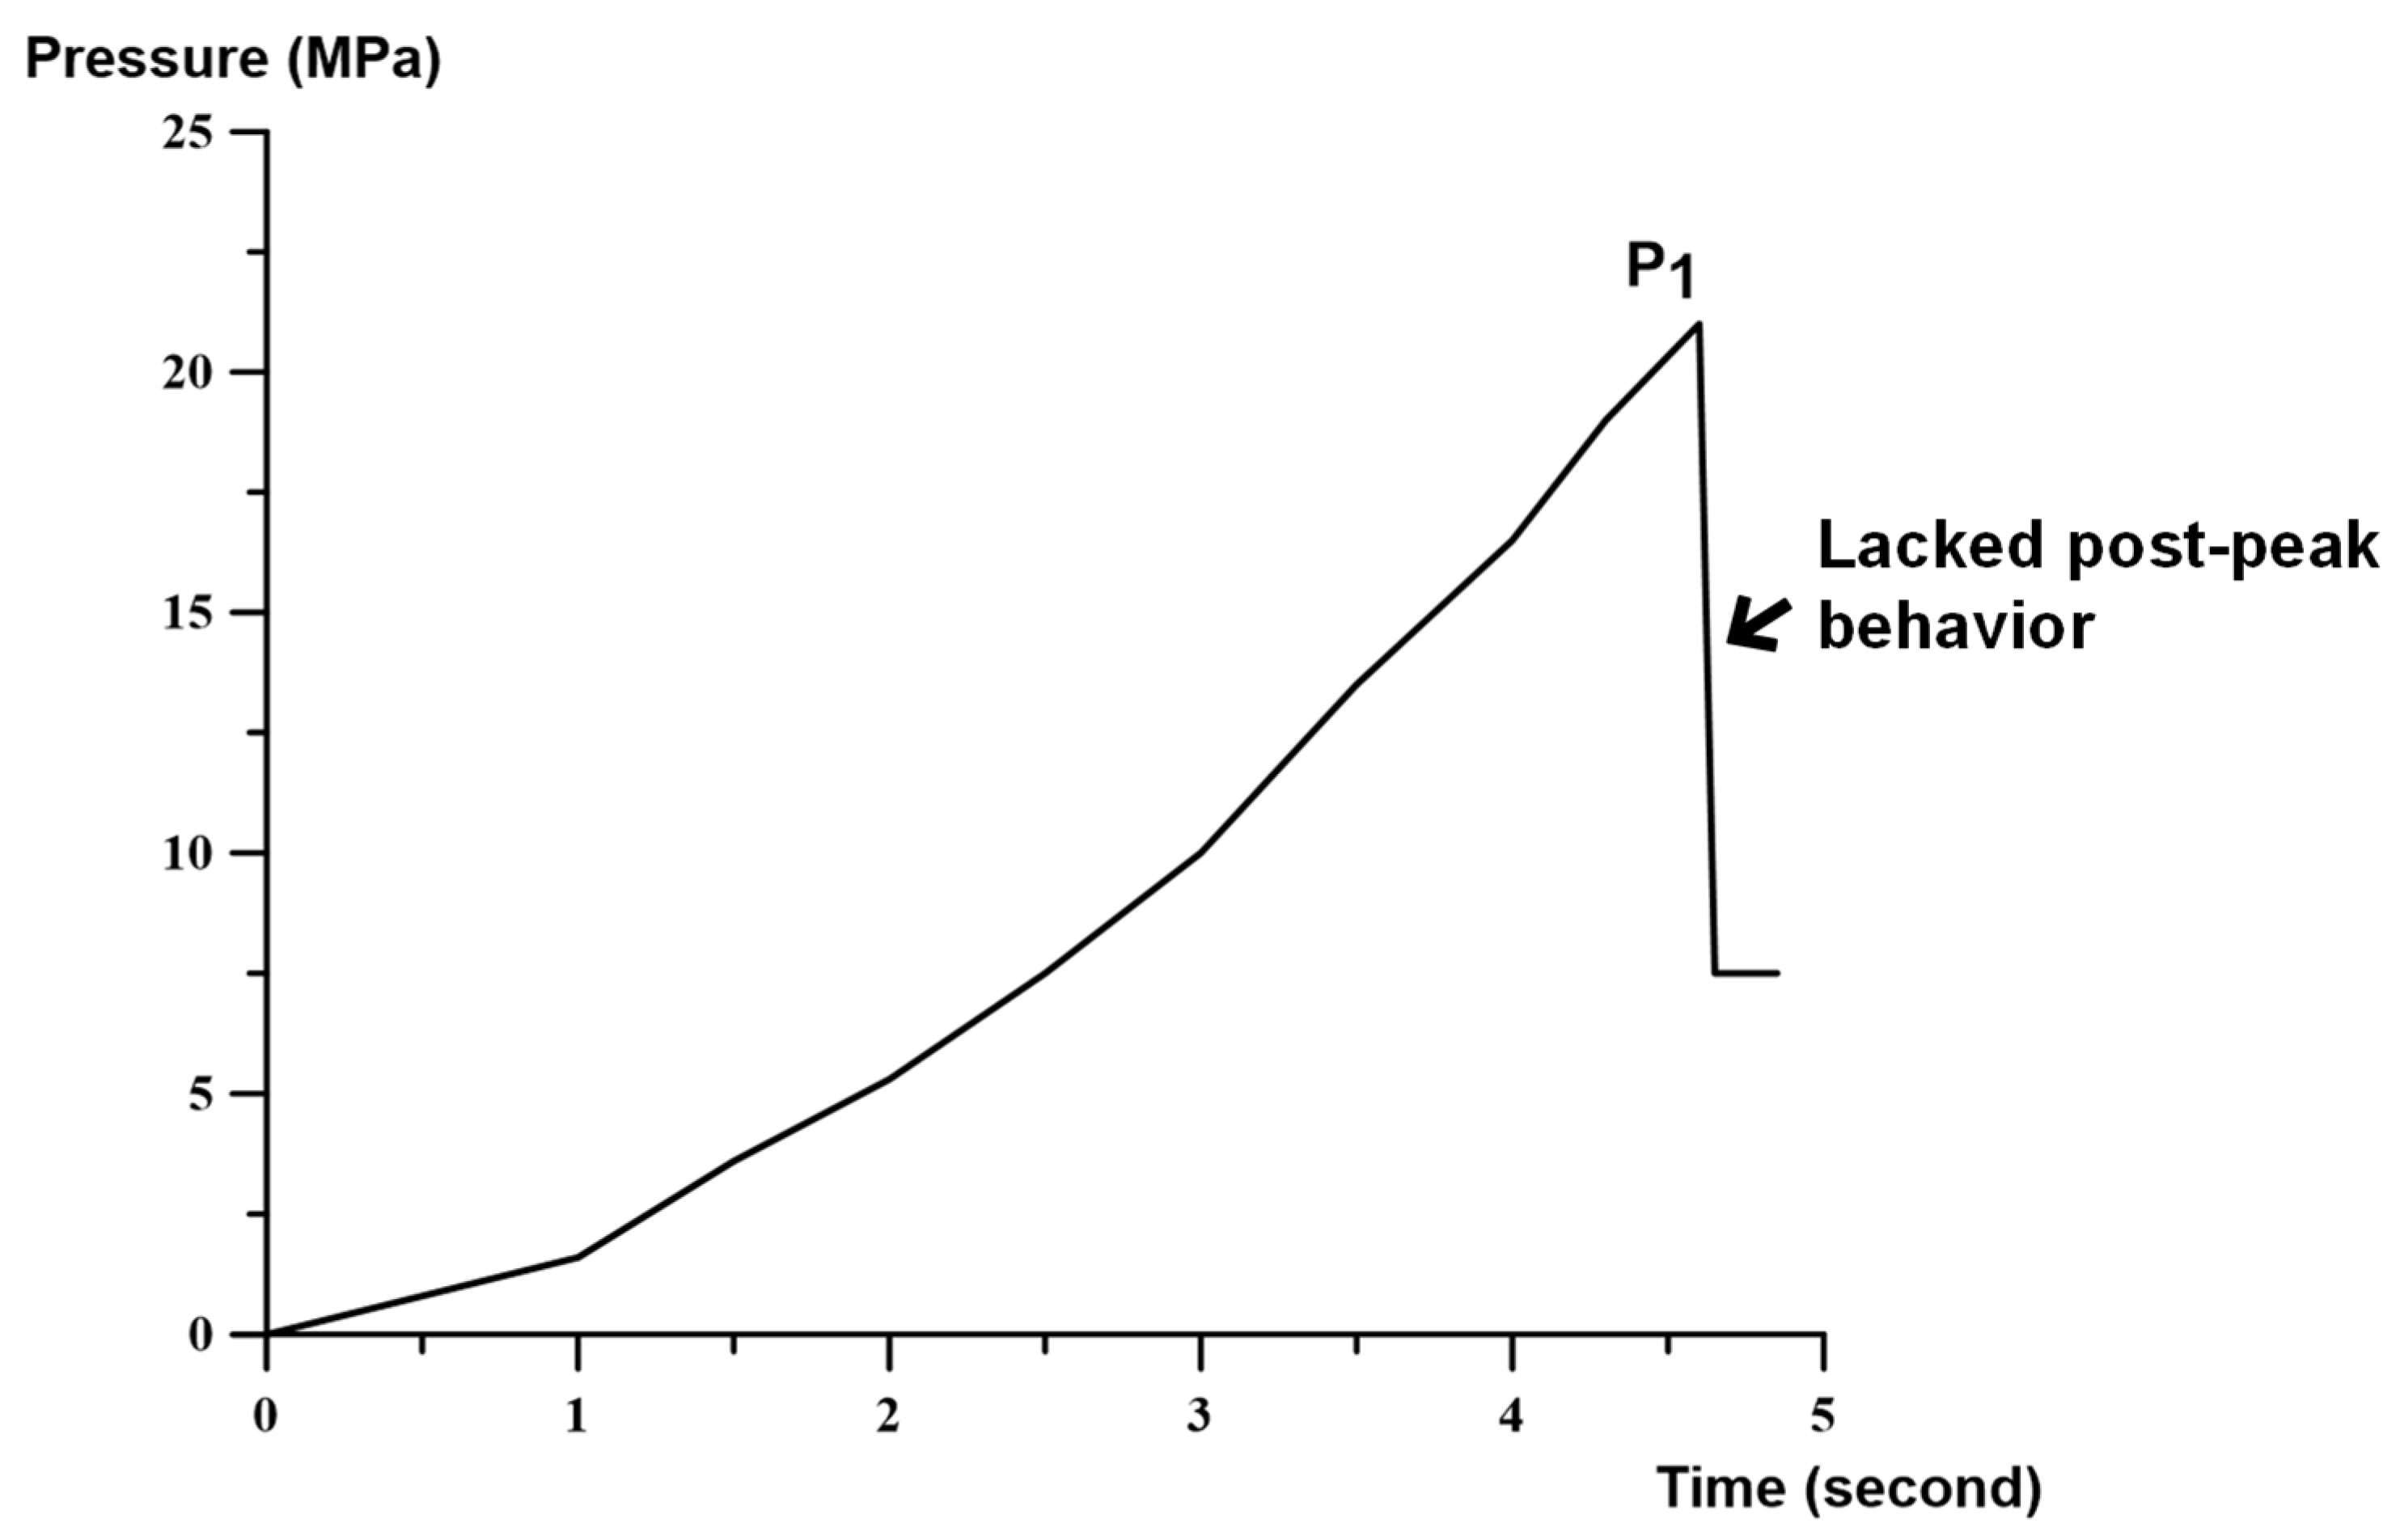
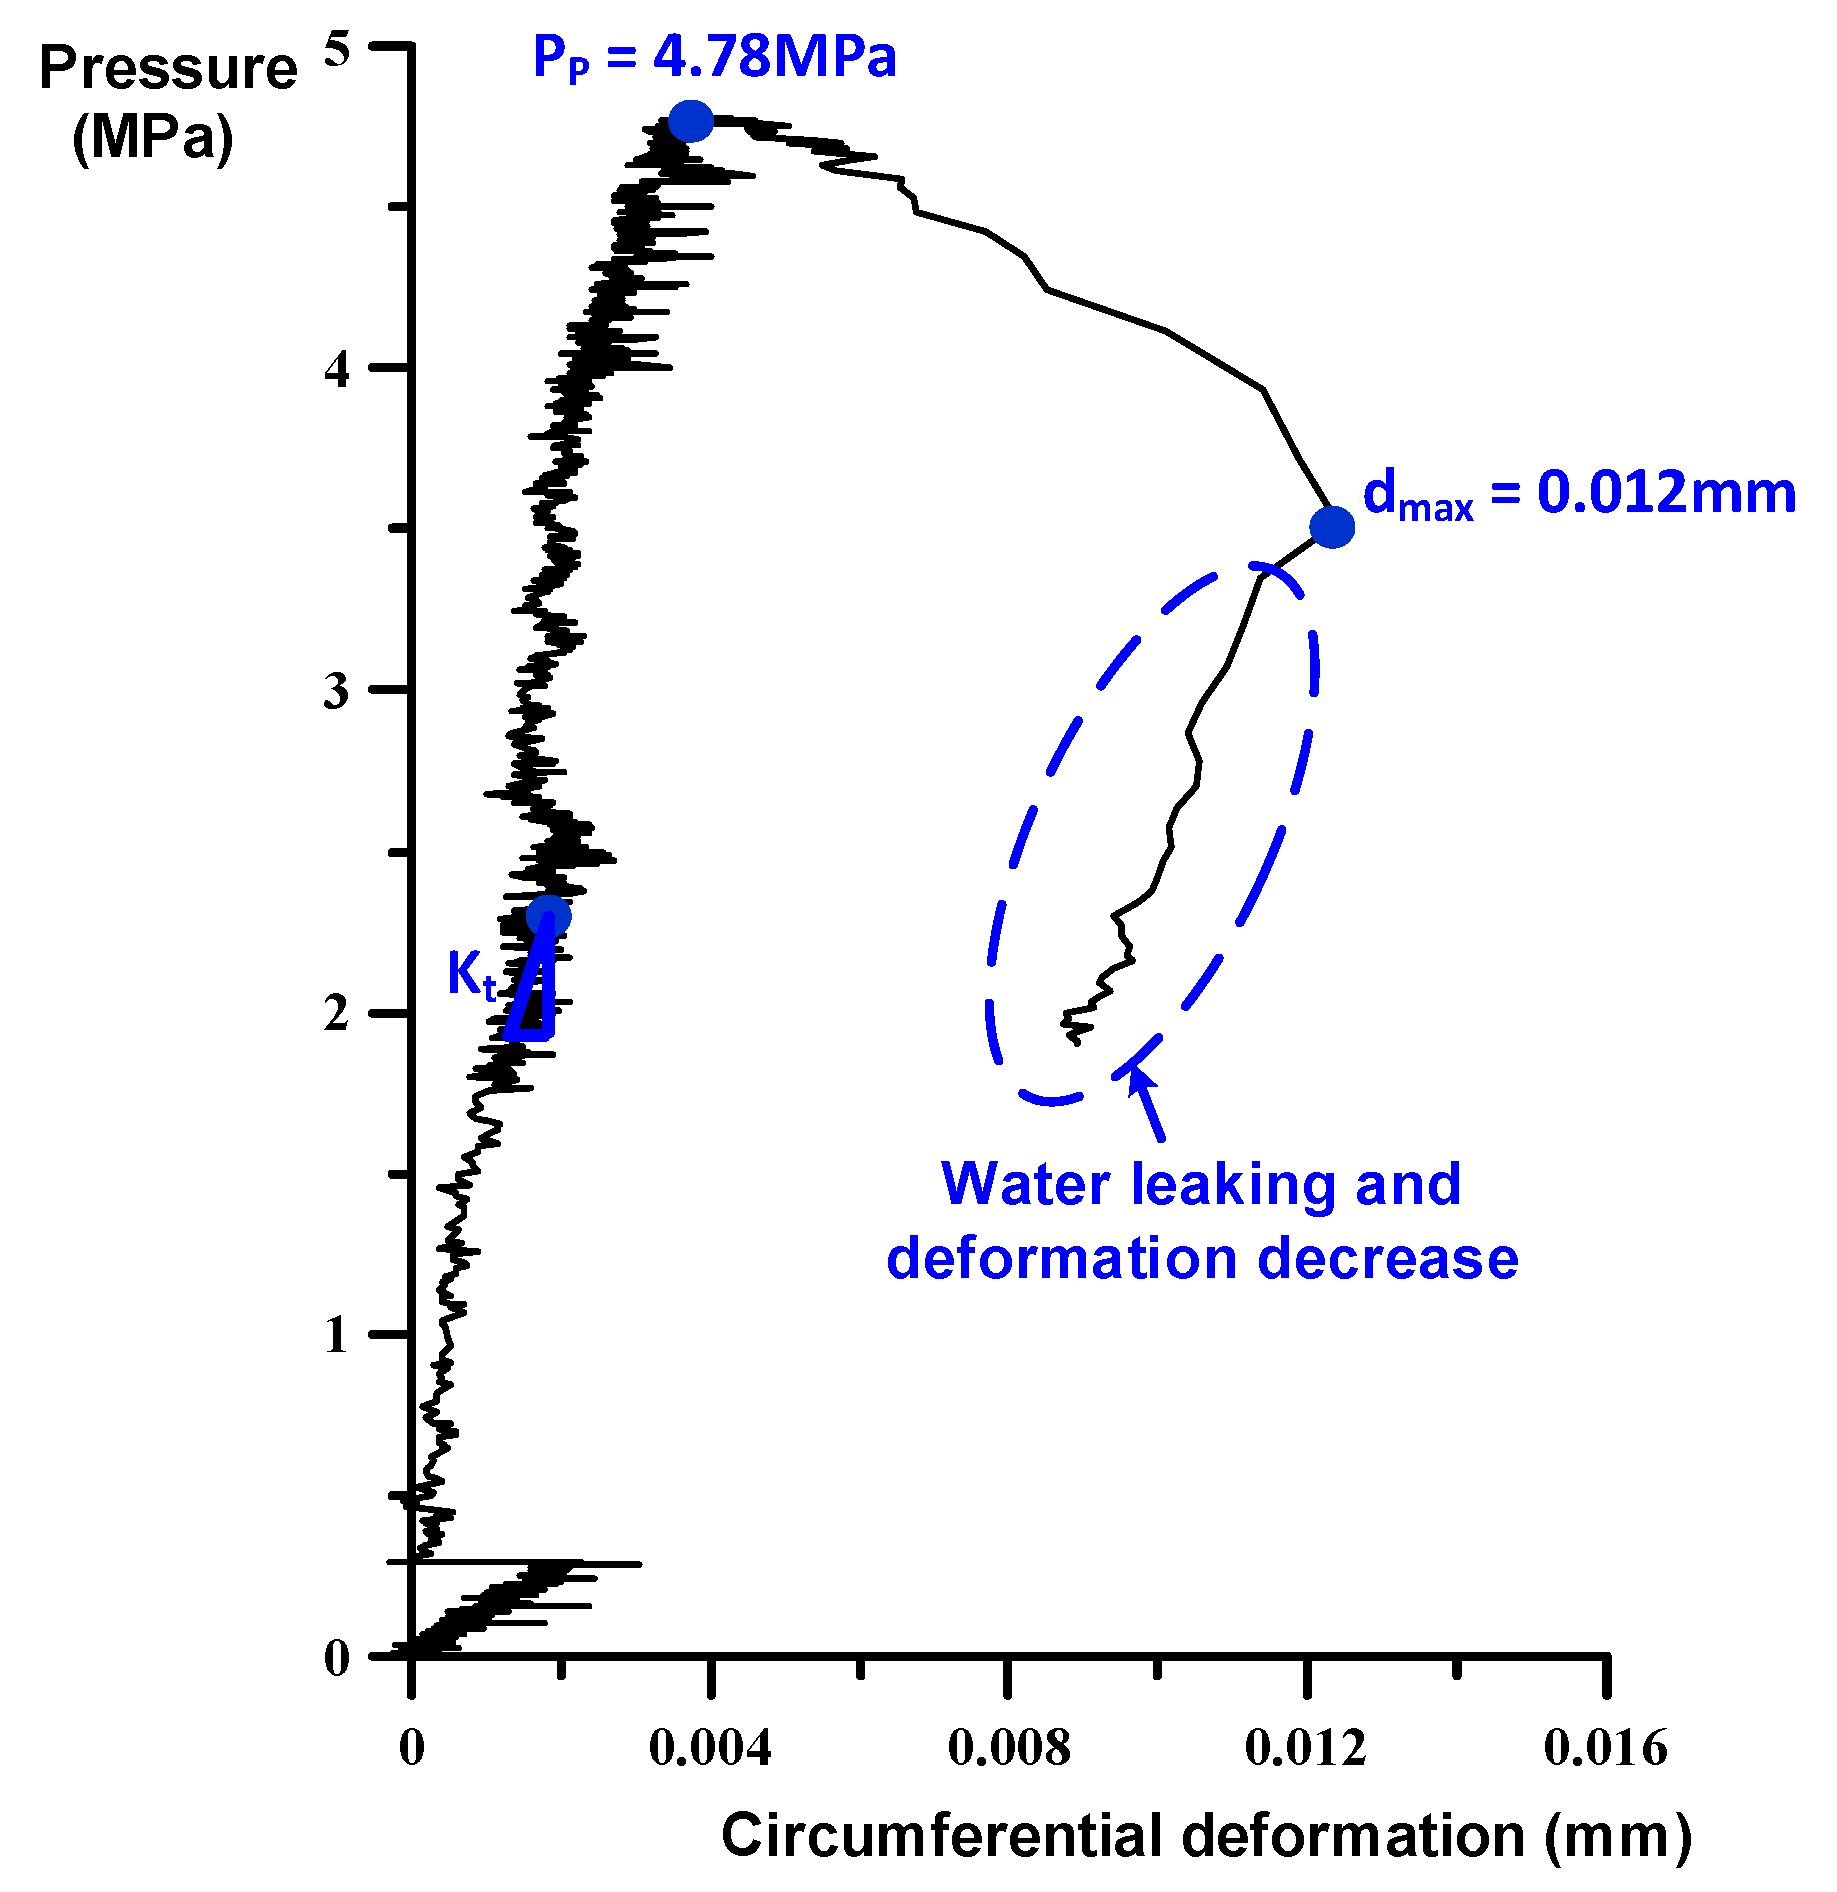
5.1. Entire Loading Curve

The complete pre- and post-peak loading process is shown in Figure 6. This curve is graphed in terms of loading pressure versus circumferential deformation. The behavior of deformation during water injection, as shown in Figure 6, is that of a specimen expanding with increasing loading pressure before peak pressure is reached. After peak pressure has been reached, the specimen continues to expand, although the loading pressure decreases. When the maximum circumferential deformation is reached, the specimen is totally cracked and water is leaking through the crack.

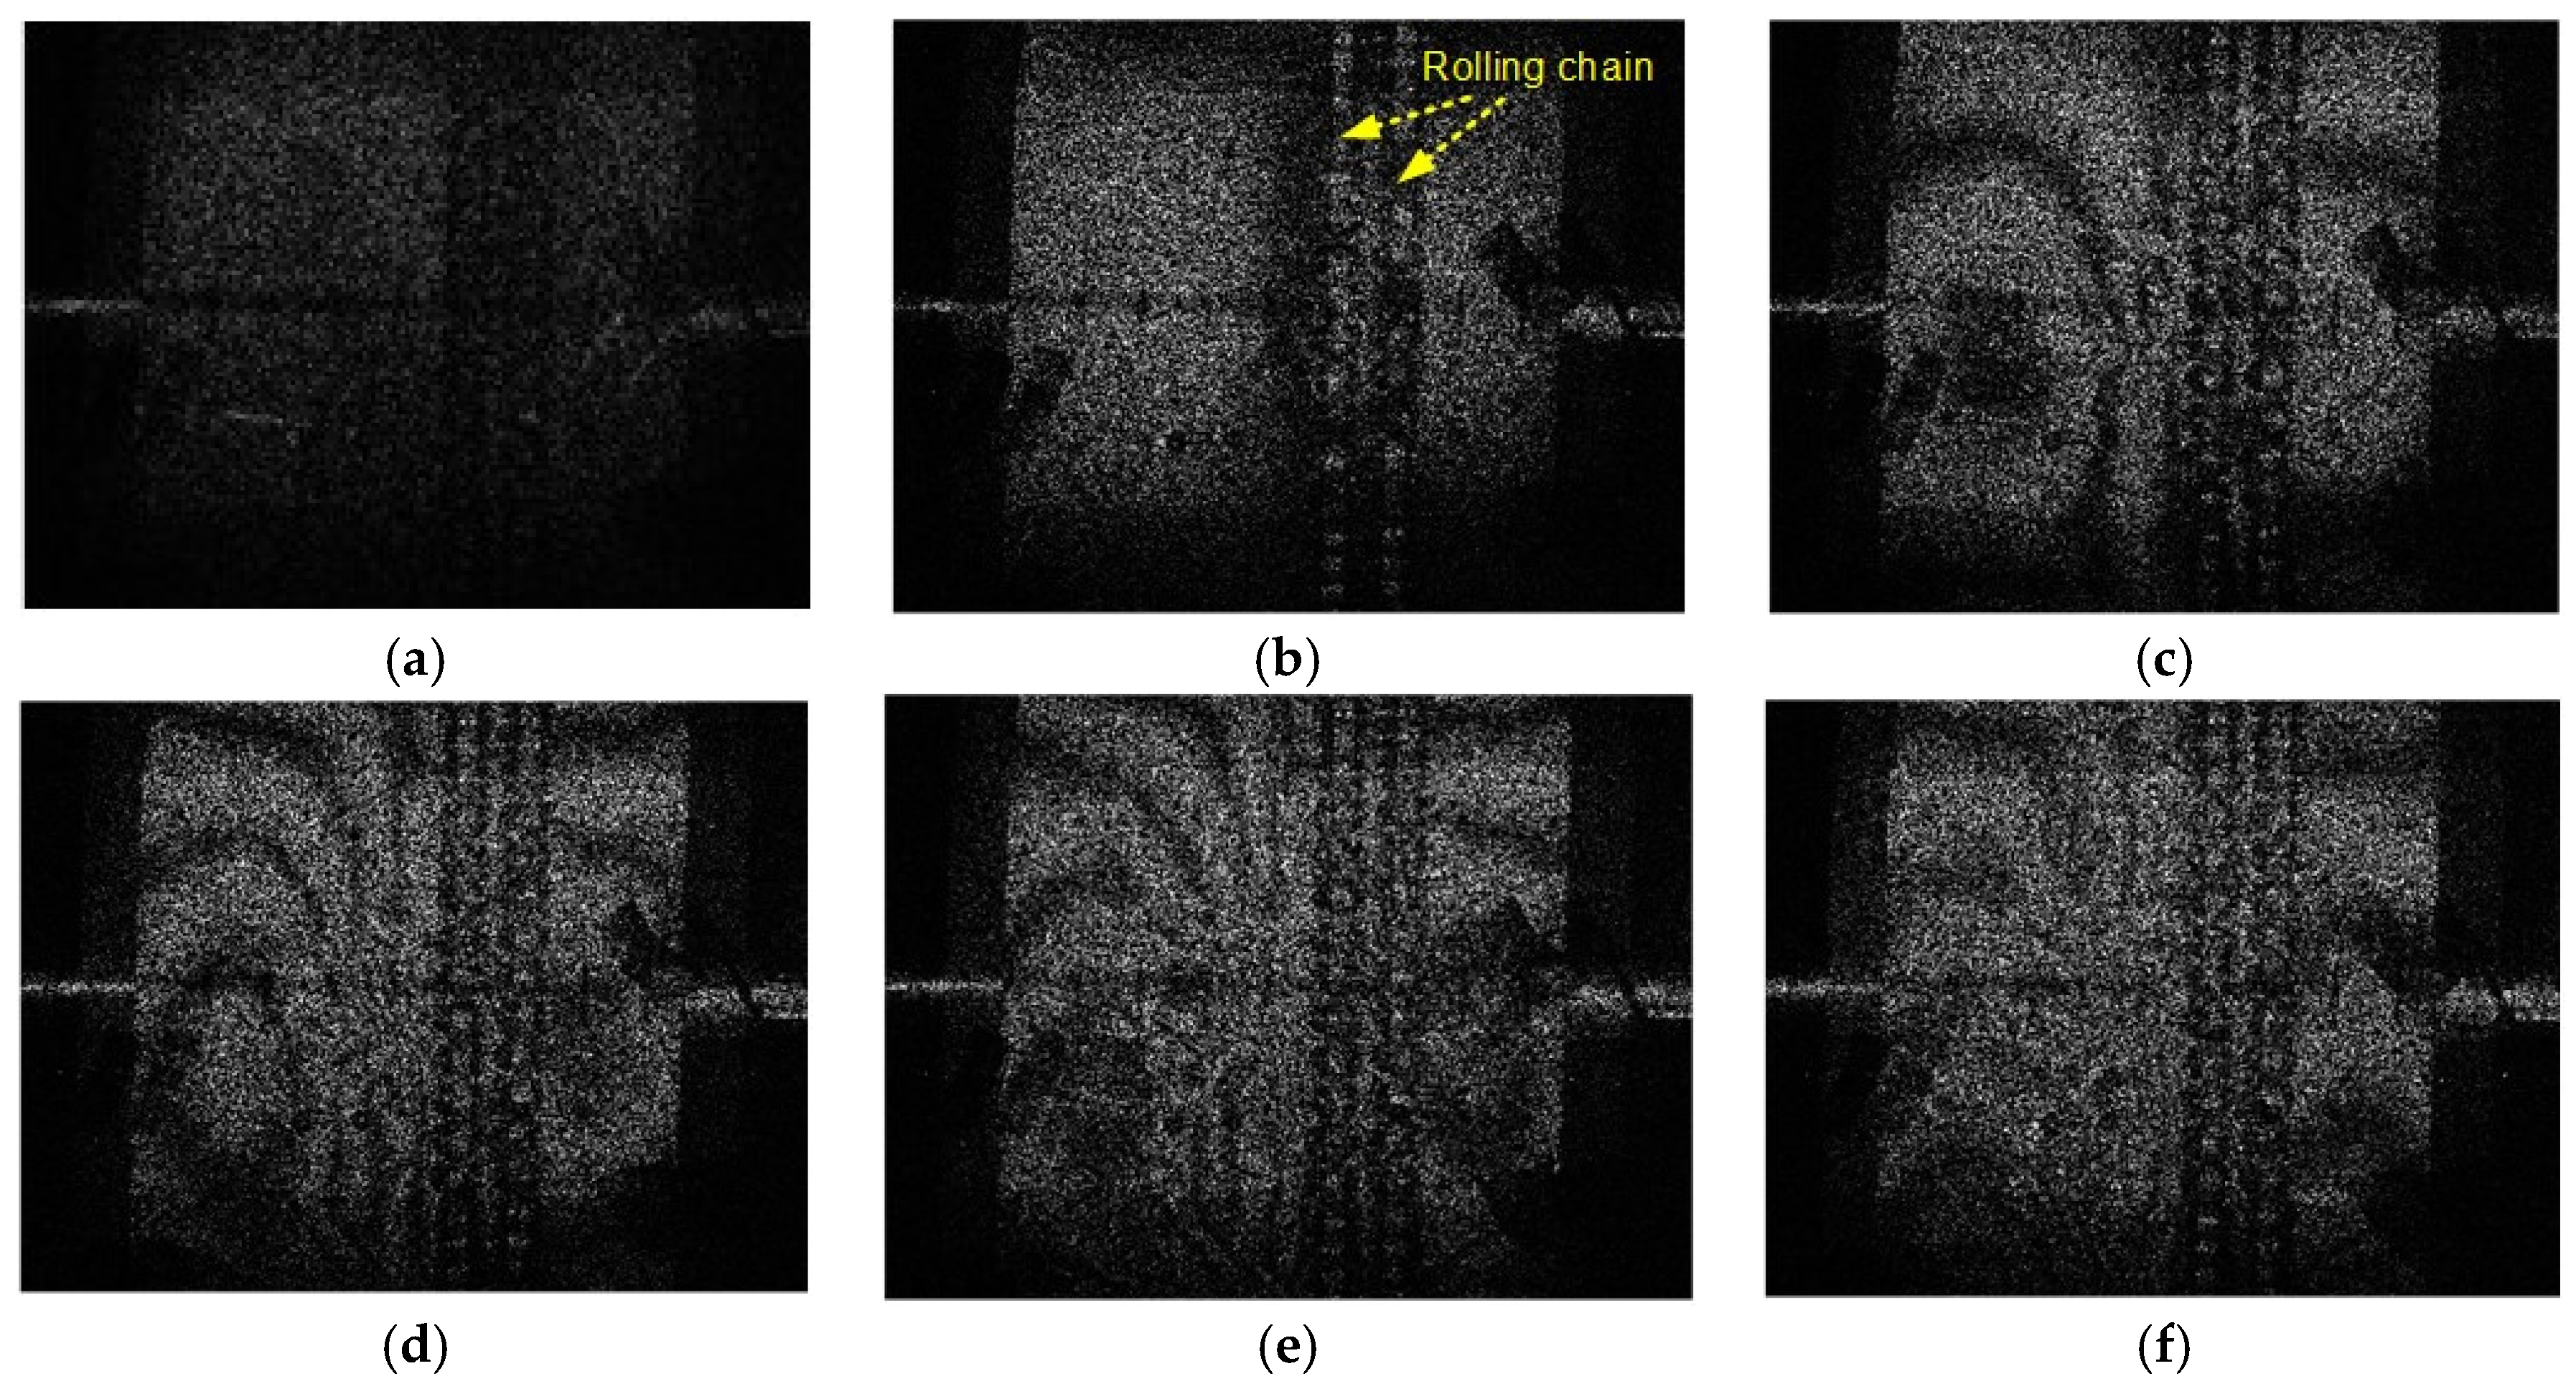
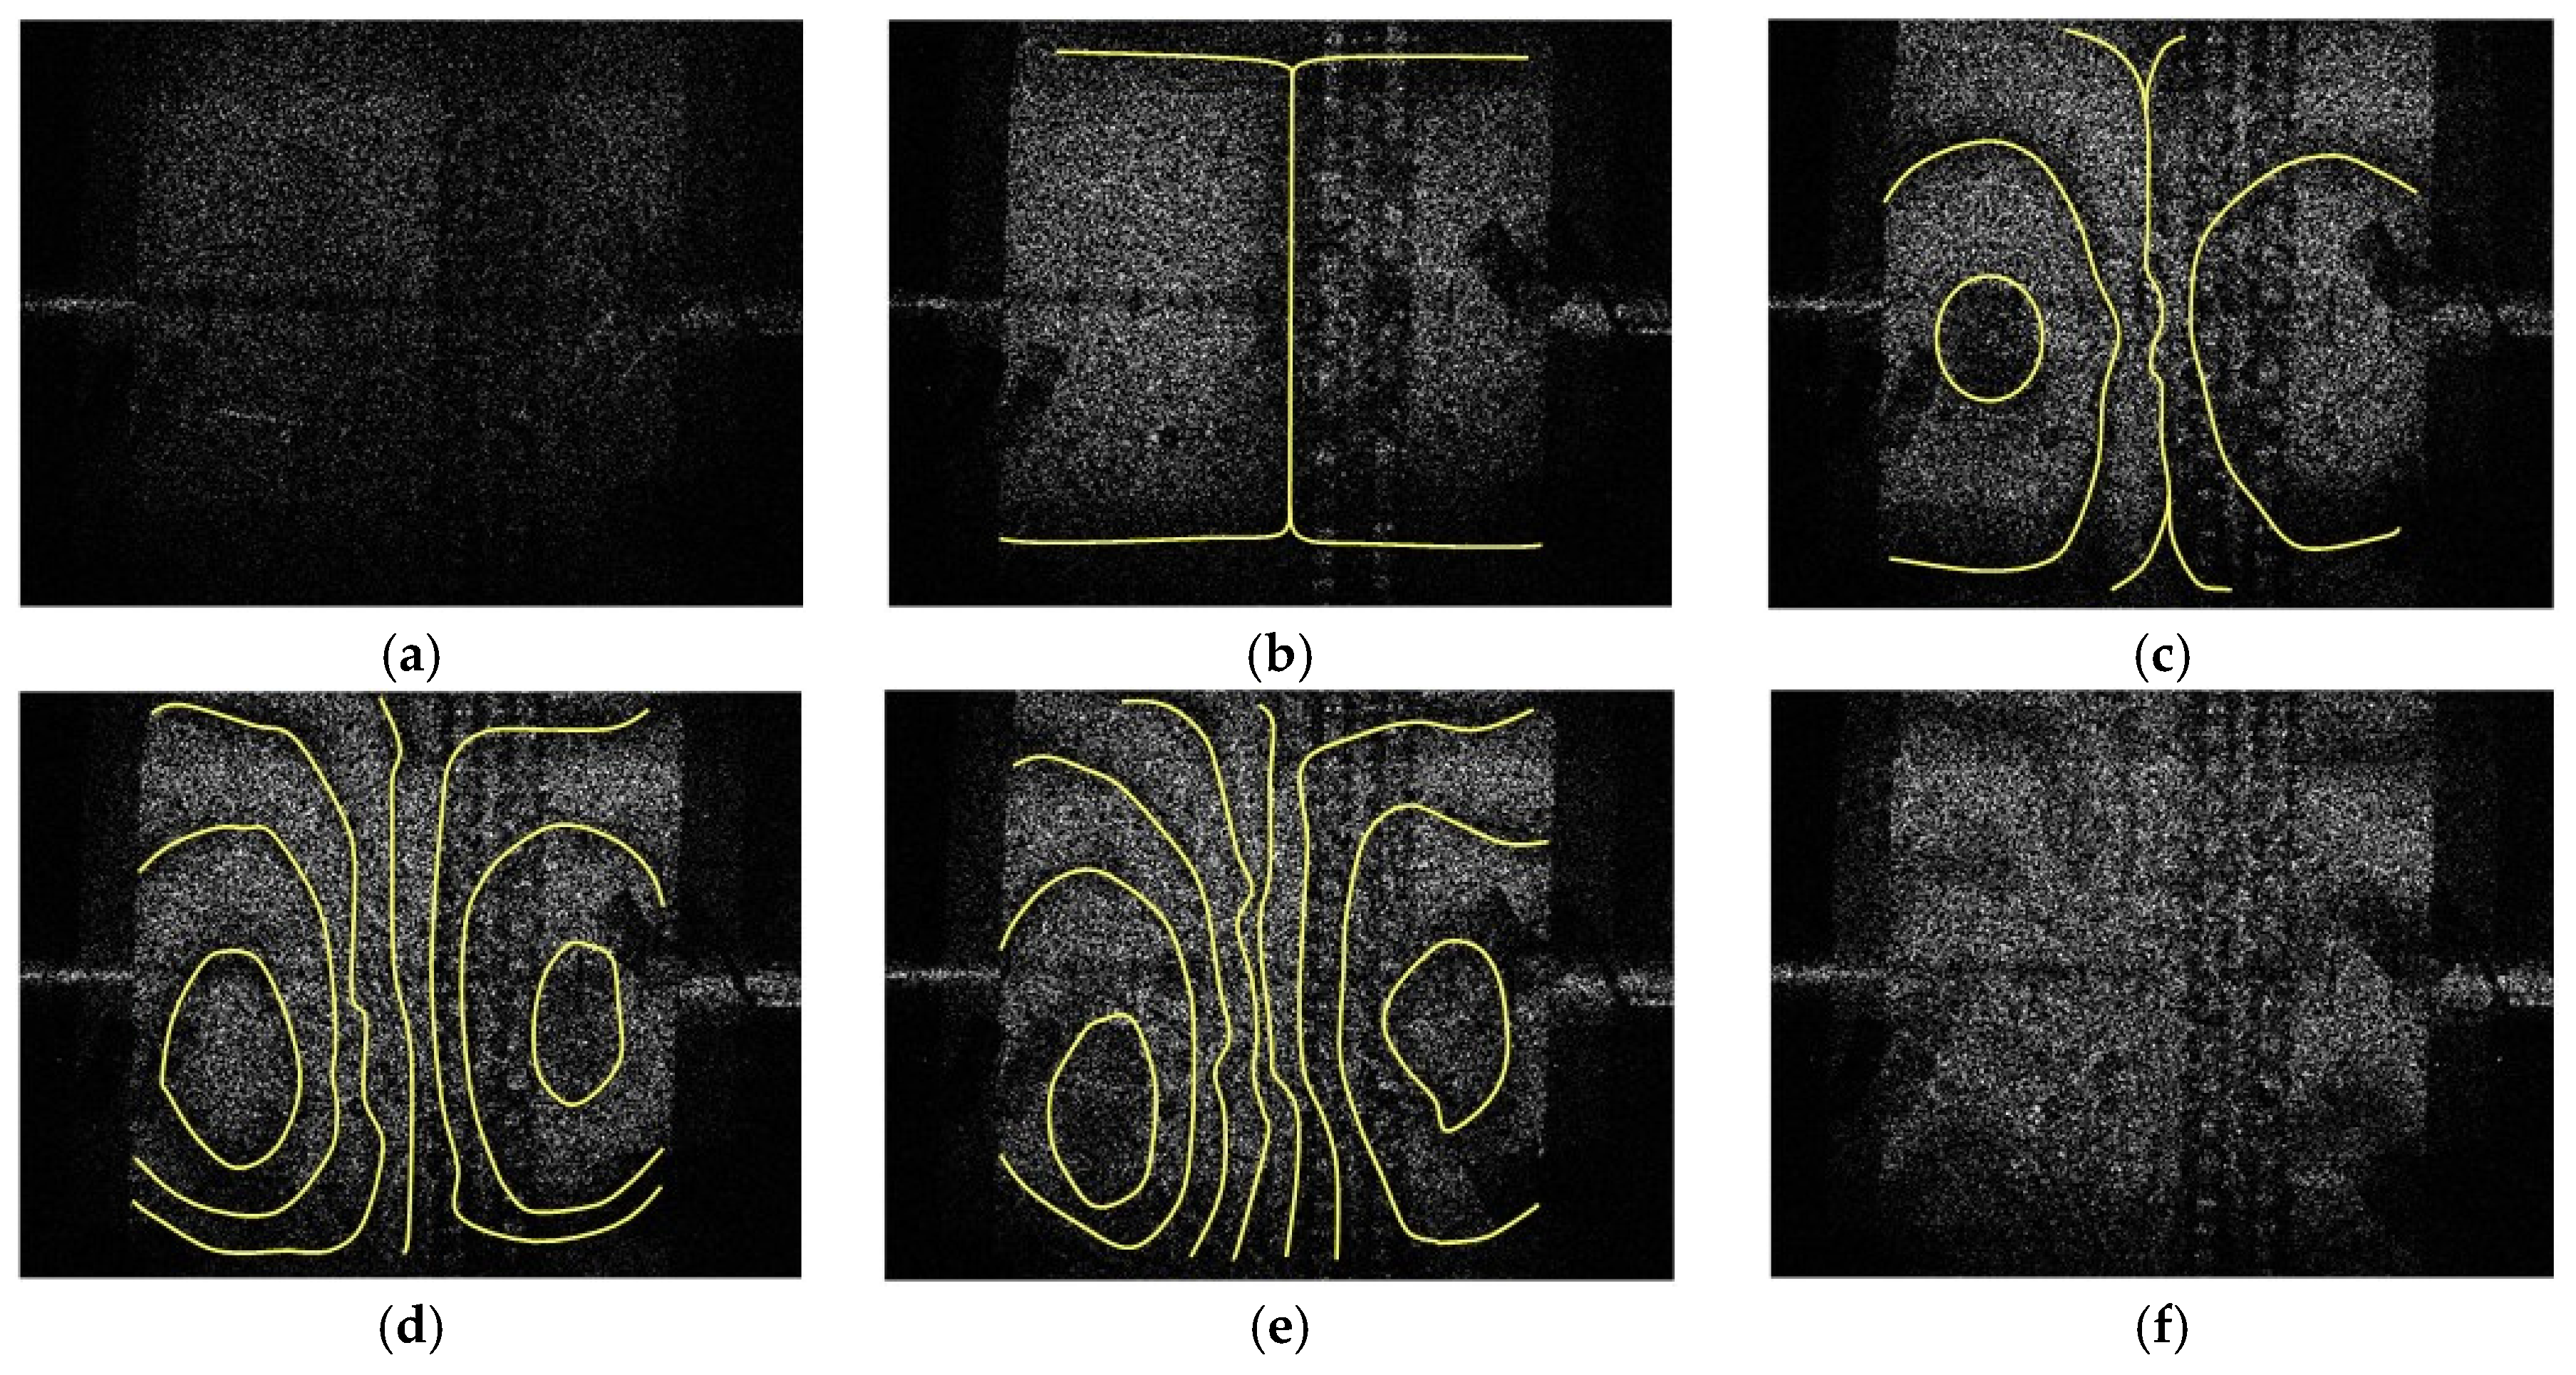
5.2. Fringe Pattern Evolution

The interference fringe patterns represent the distribution of OPD. The fringe evolution is related to the loading process. In our experiment, since a complete loading history was obtained, the whole development of the OPD could be investigated. The relationship between the loading processes and the development of interference fringes are shown in Figure 7. The load level, LL, is defined as water pressure divided by peak water pressure (normalized water pressure). In addition, Figure 8 presents the same evolution of the same patterns with relevant contours highlighted in yellow to clearly present the evolution process.
At pre-peak LLs, the specimen exhibited only speckles without any fringes (Figure 7a and Figure 8a). Interference fringes did not appear on the specimen until the LL peaked (Figure 7b and Figure 8b). The fringes started to form at the center of the specimen, indicating that the specimen showed noticeable displacement at the peak LL. As such, the hydraulic fracture of brittle cement mortar material exhibited no remarkable damage before the peak. Chen [2] conducted hydraulic fracture tests in conjunction with acoustic emissions on cement mortar. They also investigated the complete loading process, and indicated that most of the AE events (micro-crack) were detected at the post-peak stage; the localization of AE (defined as the rapid increase in the accumulation of AE events) occurred after, but near, the peak. This finding explains the phenomenon observed in this study.
At the post-peak LLs, the fringes increased and gradually concentrated toward to the center of the specimen with LL decrease (Figure 7c–f and Figure 8c–f). According to the principle of SSI, more concentrated fringe position represents that a larger OPD occurred. Accordingly, the largest OPD occurred at the center of the specimen, where crack initiated and propagated. Moreover, the crack propagation within the specimen may influence the OPD growth. Therefore, the interpretation of fringe pattern corresponding to fracture evolution should be analyzed as future work.

Author Contributions

L.-H.C. and Y.-C.C. conceived and designed the hydraulic fracture experiment; S.-T.L. designed the speckle-shearing interferometry system; W.-C.C. performed the experiments, analyzed the data and wrote the paper.

Acknowledgments

The authors acknowledge the funding supplied by the Ministry of Science and Technology of Taiwan (NSC 98-2221-E-027-073-MY2).

References

  1. Wu, R. Some Fundamental Mechanisms of Hydraulic Fracturing. Ph.D. Dissertation, Georgia Institute of Technology, Atlanta, GA, USA, 17 November 2005. [Google Scholar]
  2. Chen, L.-H.; Chen, W.-C.; Chen, Y.-C.; Benyamin, L.; Li, A.-J. Investigation of Hydraulic Fracture Propagation Using a Post-peak Control System Coupled with Acoustic Emission. Rock Mech. Rock Eng. 2015, 48, 1233–1248. [Google Scholar] [CrossRef]
  3. Bunger, A.P.; Gordeliy, E.; Detournay, E. Comparison between Laboratory Experiments and Coupled Simulations of Saucer-shaped Hydraulic Fractures in Homogeneous Brittle-elastic Solids. J. Mech. Phys. Solids 2013, 61, 1636–1654. [Google Scholar] [CrossRef]
  4. Guo, T.; Zhang, S.; Qu, Z.; Zhou, T.; Xiao, Y.; Gao, J. Experimental Study of Hydraulic Fracturing for Shale by Stimulated Reservoir Volume. Fuel 2014, 128, 373–380. [Google Scholar] [CrossRef]
  5. Liu, P.; Ju, Y.; Ranjith, P.G.; Zheng, Z.; Chen, J. Experimental Investigation of the Effects of Heterogeneity and Geostress Difference on the 3D Growth and Distribution of Hydrofracturing Cracks in Unconventional Reservoir Rocks. J. Nat. Gas Sci. Eng. 2016, 35, 541–554. [Google Scholar] [CrossRef]
  6. Yushi, Z.; Shicheng, Z.; Tong, Z.; Xiang, Z. Experimental Investigation into Hydraulic Fracture Network Propagation in Gas Shales using CT Scanning Technology. Rock Mech. Rock Eng. 2015, 49, 33–45. [Google Scholar] [CrossRef]
  7. Butters, J.N.; Leendertz, J.A. Holographic and Video Techniques Applied to Engineering Measurement. Meas. Control 1971, 4, 349–354. [Google Scholar] [CrossRef]
  8. Leendertz, J.A.; Butters, J.N. An Image-shearing Speckle-pattern Interferometer for Measuring Bending Moments. J. Phys. E Sci. Instrum. 1973, 6, 1107. [Google Scholar] [CrossRef]
Figure 1. Conventional loading history of a hydraulic fracture test adapted from Wu [1].
Proceedings 02 00452 g001
Figure 2. Schematic diagram of the specimen and sealing tube layout: (a) Top view; (b) Side view.
Proceedings 02 00452 g002
Figure 3. Schematic diagram of post-peak control hydraulic fracture system.
Proceedings 02 00452 g003
Figure 4. Optical field setup of SSI and defined coordinate system.
Proceedings 02 00452 g004
Figure 5. Schematic diagram of deformation and measurement field of experiment.
Proceedings 02 00452 g005
Figure 6. Entire loading curve including the pre- and post-peak loading stage.
Proceedings 02 00452 g006
Figure 7. Evolution of a fringe pattern from pre-peak LL = 50% to post-peak LL = 50%: (a) LL = 50%; (b) LL = 100%; (c) LL = 98% (post-peak); (d) LL = 94% (post-peak); (e) LL = 90% (post-peak); (f) LL = 50% (post-peak).
Proceedings 02 00452 g007
Figure 8. Highlighted evolution of the fringe pattern: (a) LL = 50%; (b) LL = 100%; (c) LL = 98% (post-peak); (d) LL = 94% (post-peak); (e) LL = 90% (post-peak); (f) LL = 50% (post-peak).
Proceedings 02 00452 g008
Publisher’s Note: MDPI stays neutral with regard to jurisdictional claims in published maps and institutional affiliations.

