Abstract
The aim of this study was to investigate the air drag, frontal area and coefficient of drag of cross-country skiing classical and free style techniques. One highly skilled cross-country skier performed skiing-like classical and free style techniques on a force plate in a wind tunnel. The skier was also photographed from the front in order to analyze the projected frontal area, which was determined from digital images using Matlab. From the results of the air drag and the frontal area measurements, the drag coefficient was also calculated. The results can be used by researchers to calculate the theoretical effect of air drag on cross-country skiing performance.
1. Introduction
In cross-country skiing (xc-skiing), the forces the skier must overcome are the frictional and gravitational forces and the aerodynamic drag [1,2,3,4,5]. The aerodynamic drag is expressed as
where FD is the air drag in the athlete’s direction of travel, CD is a drag coefficient which depends on the geometry of the athlete and equipment and the nature of the surface, A is the projected frontal area, ρ is the air density, v is the resulting headwind due to the athlete’s travelling speed and is a head or tail wind if or 180 degrees.
Although extensive research has been conducted on xc-skiers, not many studies have been published in the field of air drag. Thus, the aim of this study was to investigate the air drag, frontal area and drag coefficient of different xc-skiing classical and free style techniques.
2. Materials and Methods
2.1. Measurements of Air Drag
One male xc-skier (age 25 years old, body height and weight 1.85 m and 80.2 kg, VO2 max 6.3 L/min) who competes at a high international level participated in the experiments, which were part of a project approved by the Regional Ethical Review Board in Umeå, Sweden (Reg. No. 2016/282-31).
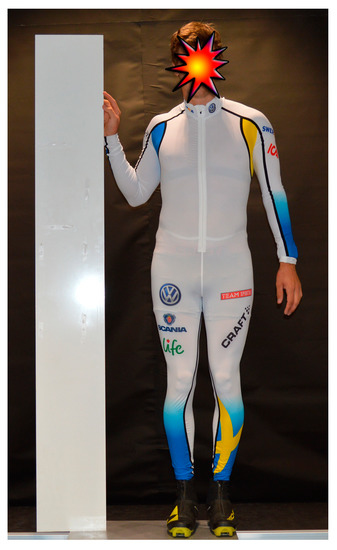
The experiments were carried out with the skier imitating postures during different phases of a few xc-skiing techniques while standing on a force plate (Kistler 9281EA, Kistler Instrumente AG, Winterthur, Switzerland) in a wind tunnel [6]. During the measurements, the skier wore a Swedish national racing suit that was used in the competition season 2016–2017 (Craft Sportswear, Sweden, 82% Polyester, 18% Elastane) and used regular racing poles and boots, see Figure 1. The following xc-skiing techniques were studied: classical style; diagonal stride (DS), double poling with a leg kick (DPkick) and double poling (DP); Free style; gear 3 (G3), gear 4 (G4) and gear 5 (G5).

Figure 1.
The figure shows the cross-country skier dressed in the racing suit and ski boots, holding the white board used as calibrating area for the image analysis.
Xc-skiing normally entails dynamic motion of the body segments during the regular push-off and re-pendling phases, which are specific for each skiing technique. However, in this study air drag for three to five different static positions were measured representing the normal range of motion for each technique. The selected number of static positions depended on the complexity of each technique, e.g., free style gear 4 was represented by four different positions, see Figure 2 G4a–G4d, while the less complex range of motion of the gear 5 technique was represented by only three positions.

Figure 2.
Pictures (G4a–G4d) present sagittal plane images of the skier performing the selected four static positions representing the free style gear 4 technique. Picture (G4e) is similar to picture (G4a) and completes the range of motion.
The FD of each static position was measured (10 Hz) over 20 s, wherein 5th to 15th s were analyzed, and a mean and standard deviation (SD) were compiled for each technique based on all represented static positions. The air velocities used during the measurements of the free style techniques were based on published data from outdoor skiing [7]: G3 6 m/s; G4 8 m/s; G5 9 m/s. Since xc-skiers racing speed is lower in classical style races than in free style races, slightly lower air velocities were chosen for the classical techniques: DS 4 m/s; DPkick 5 m/s; DP 7 m/s.
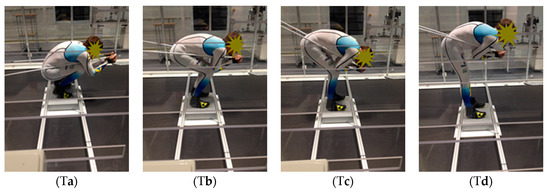
Also, four different tucked positions (Ta, Tb, Tc and Td), possible to use in downhill sliding, were evaluated using an air velocity of 14 m/s. Figure 3 shows the skier in the sagittal plane in the tested tucked positions. The positions Tb, Tc and Td are similar positions as can be seen in Spring et al. [5]. Finally, the skier was also measured when standing in a normal upright position (Norm).

Figure 3.
Pictures (Ta–Td) show the skier in the sagittal plane in the different downhill positions.
The ambient air pressure, temperature, relative humidity and density were 949.5 hPa, 16.3 °C, 55 % and 1.14 kg/m3 during the measurements.
2.2. Skier Projected Frontal Area Measurements
The projected frontal area (A) of the skier at each static position was determined from digital images, . A camera (Nikon D3200, Nikon Corporation, Tokyo, Japan) was placed in front of the skier at a distance of 3 m and a height of 0.8 m above the force plate. By arranging a background, with a different colour to the skier it was possible to mask out the pixels that belong to the skier (2). In this case, a black background was selected, because the skier’s racing suit and poles were white. By comparing each background pixel , with the image pixels , it was possible to extract the skier’s area from the image without the background. The background could have some minor different shades of black, so several background points were selected for used in the background calculation process. By allowing the background to vary in color within the selected points and adding a small deviation, it was possible to eliminate the background from the skier’s area (2).
By using an object with a predetermined area (, it is possible to correlate this area with the number of image pixels ( to get the area units ( corresponding to each pixel (3). In this case, a rectangular white board with a height and width of 1.80 and 0.25 m was used as a reference area (0.45 m2), see Figure 1.
This value, , describing the area units for each pixel, is used to determine the projected area of the skier. When the number of pixels of the skier ( is found from the background elimination process described above, the skier’s area ( can be calculated (4).
Matlab® was used to develop the application necessary to perform the steps described above. In order to improve the usage of the code, a graphical user interface was developed. This user interface allowed the selection of skier images, selection of region of interest of the skier in front of the black background, selection of calibration area, selection of pixels to be used for background elimination and, finally, the calculation of the skier’s projected area. A function where the user can manually adjust the image to remove unwanted background objects and missed skier areas was also included in the software. Finally, the CD for each position was also calculated by dividing CDA with A.
3. Results
The results of FD, CDA, A and CD for the studied classical and free style xc-skiing techniques are presented in Table 1. The measurements of FD were carried out using different air velocities for the tested techniques. The chosen air velocities were based on published data from outdoor skiing velocities in different types of terrain on which the specific techniques are normally used. Because of this, the results of FD shown in Table 1 should not be compared between the different skiing techniques.

Table 1.
Results (mean ± SD) of air drag (FD), drag area (CDA), projected frontal area (A) and coefficient of drag (CD) for different classical and free style cross-country skiing techniques. Norm is the skier standing in a normal upright posture.
4. Discussion
From the calculated CDA, interesting aerodynamic differences between the different skiing techniques can be seen. The highest CDA was found for the freestyle G3 technique (0.67 m2), with a similar value to that of standing in a normal upright position. This seems logical, since it is the technique along with the classical style DS which has a more maintained upright position throughout the range of motion, which can be seen by the results of the projected frontal area. Further, the values of CDA for the other techniques show that the lower values are found for techniques where the position is partly a deeper tuck. The lowest CDA is found for the tested continuous tucked positions, which can be used in downhill sliding, where the positions Tb and Tc have the lowest value (0.18 m2). Interestingly, the position Ta has the smallest A but the largest CD among the tested tucked positions.
In Leirdal et al. [3], the moderate position of the skier is similar to gear 5 in this study. The results in Leirdal for FD were ~17 N and ~25 N for the static and dynamic test (air velocity 10m/s), respectively, which gives a CDA of 0.28 m2 and 0.42 m2. The result for CDA in the static test is thus slightly lower compared to the result in this study, while the result of the dynamic test shows a higher value. In Spring et al. [5], the results of CDA for the skiers in the downhill tucked positions are slightly higher (0.27 and 0.30) compared to this study.
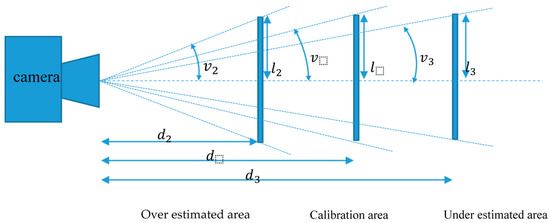
The area of the skier was calculated from a two-dimensional image, where the area was determined from a calibration area placed at a specified distance from the camera. Parts of the skier closer to the camera than the calibration plate plane will be estimated as having a larger area than the real area, and parts of the skier behind the calibration plate plane will be estimated to have an area smaller than it really is. This is illustrated in Figure 4.

Figure 4.
An illustration of how a calibration area with length,, is perceived by a camera at different distances, and . If an object is moved closer to the camera it will be detected as larger than it really is, , and if an object is moved further away from the camera it will be detected as smaller than it really is, .
The correlation between pixels and real area was done using a calibration area placed at a distance from the camera, where the length of the calibration object is . If the object is moved closer to the camera at distance , the new length will be detected as and the new angle is . This results in a length error that is described as (5).
If the object is moved further away from the camera at distance , the new length will be detected as and the new angle is . This results in a length error that is described as (6).
Consequently, the area difference will be. Our validation measurement shows that the calibration area varies up to 20% when moved 0.3 m from the calibration distance.
The skier area detection can also be done using a stereo camera. A stereo camera can give distance information for each pixel in the image. This distance information is used to adjust the area of the pixel according to the distance between the camera and the skier. Furthermore, the distance information can be used to eliminate all background image content. Future research would therefore benefit from using a stereo camera. The skier’s side area is also of interest, because the form of the skier’s body position will change the drag force induced by turbulence behind the skier. This needs to be investigated in future research. Another idea is to use video footage. Using video footage, it would be possible to calculate the values in Table 1 from a series of images. The realization of video image handling entails the use of 3D cameras, because manual adjustment of images in a video stream would result in an unreasonable amount of work. If effective algorithms could be developed, a realtime estimation of the values in Table 1 could be performed.
When xc-skiing on snow, the optimal situation for transition from one technique to another is not always very clear for the skier. This is due to several reasons, e.g., the energy cost for different techniques at different inclinations and speeds, where FD should be an importance influencing factor. It can thus be difficult to know when it is best to switch from one technique to another. Potential development of research on xc-skiers may therefore be to measure energy cost during influence of air drag for the different techniques at a range of relevant inclinations and speeds. This can be done by roller skiing on a treadmill in a wind tunnel [6], where the roller skis and ski poles are equipped with sensors to register resultant forces during the push-off phases. In order to calculate the overall propulsion and the separate propulsive forces produced by arms and legs, a high-speed 3D motion analysis system can be used to provide data like ski angle, edging angle, incline angle and center of mass position together with pole and leg forces [8]. Also, with knowledge of the rollers skis’ rolling resistance and the gravity force, the residual force FD can easily be calculated. The skier’s energy expenditure can be measured using automated systems or the golden standard Douglas bag method. By doing this it is possible to compare the energy cost between different skiing techniques where all normal outdoor resisting forces are present.
5. Conclusions
The results of this study provide information about the CDA, A and CD of different xc-skiing techniques. The results are reasonably close to the few studies previously published in the field. The results can be used by researchers to calculate the theoretical effect of air drag on xc-skiing performance.
Acknowledgments
The authors would like to thank Per Skoglund, Mid Sweden University, for his assistance with the force plate measurements. The project was partly financed by The Swedish Research Council for Sports Science (CIF).
 |
Conflicts of Interest
The authors declare no conflict of interest.
References
- Ainegren, M.; Carlsson, P.; Tinnsten, M. Roller ski rolling resistance and its effects on elite athletes’ performance. Sports Eng. 2009, 11, 143–157. [Google Scholar] [CrossRef]
- Buhl, D.; Fauve, M.; Rhyner, H. The kinetic friction of polyethylen on snow: the influence of the snow temperature and the load. Cold Reg. Sci. Technol. 2001, 33, 133–140. [Google Scholar] [CrossRef]
- Leirdal, S.; Saetran, L.; Roeleveld, K.; Vereiken, B.; Bråten, S.; Löset, S.; Holtermann, A.; Ettemaa, G. Effects of Body Position on Slide Boarding Performance by Cross-Country Skiers. Med. Sci. Sports Exerc. 2006, 38, 1462–1469. [Google Scholar] [CrossRef] [PubMed]
- Sandbakk, Ø.; Ettema, G.; Holmberg, H.-C. The influence of incline and speed on work rate, gross efficiency and kinematics of roller ski skating. Eur. J. Appl. Physiol. 2012, 112, 2829–2838. [Google Scholar] [CrossRef]
- Spring, E.; Savolainen, S.; Erkkilä, J.; Hämäläinen, T.; Pihkala, P. Drag area of a cross-country skier. J. Appl. Biomech. 1988, 4, 103–113. [Google Scholar] [CrossRef]
- Ainegren, M.; Tuplin, S.; Carlsson, P.; Render, P. Design and development of a climatic wind tunnel for physiological sports experimentation. J. Sports Eng. Technol 2017. on review. [Google Scholar] [CrossRef]
- Andersson, E.; Supej, M.; Sandback, O.; Sperlich, B.; Stöggl, T.; Holmberg, H.-C. Analysis of sprint cross-country skiing using a differential global navigation satellite system. Eur. J. Appl. Physiol. 2010, 110, 585–595. [Google Scholar] [CrossRef]
- Göpfert, C.; Pohjola, M.; Linnamo, V.; Ohtonen, O.; Rapp, W.; Lindinger, S.J. Forward acceleration of the centre of mass during ski skating calculated from force and motion capture data. Sports Eng. 2017, 20, 141–153. [Google Scholar] [CrossRef][Green Version]
Publisher’s Note: MDPI stays neutral with regard to jurisdictional claims in published maps and institutional affiliations. |
© 2018 by the authors. Licensee MDPI, Basel, Switzerland. This article is an open access article distributed under the terms and conditions of the Creative Commons Attribution (CC BY) license (https://creativecommons.org/licenses/by/4.0/).