1. Introduction
Badminton is a worldwide sport and it’s also the fastest racket sport. Measurements of the badminton shuttle shows that it can travel at nearly 500 km/h [
1]. The shuttle is made from goose feathers to give its aerodynamic properties and cork to transfer the kinetic energy of the racket to the shuttle. The properties of a shuttle are difficult to define due to the lack of research on how it behaves. Yonex, which is the leading brand, have the most accepted shuttle and therefore all the other brands are trying to copy their shuttles properties. There is no exact definition of how the shuttle should be designed or even its properties. This slows down the development of the market by making it less competitive.
To determine the desirable properties of a shuttle there should be a lot of testing and calculations from an engineering point of view. The desirable properties of a shuttle are considered to be how a Yonex shuttle rotates, tumbles and how the trajectory goes. By identifying and quantifying these desired properties a standard shuttle can be determined. By testing the shuttle in many ways, the different properties can be identified, but this is not an easy process. In this report, some of the properties will be monitored and analysed. One of the most interesting properties is the deviation in sideways direction due to the rotation of the shuttle which is the main focus of this report.
2. Materials and Methods
The testing of badminton shuttles today is more about how it feels to play with the shuttle than to measure properties and see if it’s close to the ideal value. The Badminton World Federation has a systematic test procedure to quantify these properties [
2]. Many different shots are tested and compared to the opinion on how a perfect shot should feel like, and this is done by very experienced players. The testing involves serves, clears, drops but also more advanced behaviours. These advanced behaviours can be how the shuttle curls in net play, if the feathers get scruffy and how the shuttle deforms when exposed to hard smashes.
2.1. Testing of Shuttles
The research and testing that is done in the present investigation is aiming to map the different properties to understand which ones are important. When all the properties are defined and analysed, the further testing can begin. The intention is to better understand how a shuttle behaves and therefore, in the future, more high-technological testing can be done. One high technological tool that can be used is computational fluid dynamics (CFD). CFD uses computers to calculate aerodynamic properties. It takes a lot of computational power to calculate CFD but in the future this might be the best way to test shuttles and compare their properties.
There are systems used in other sports like Swing track (golf) [
3] or Hawkeye (tennis, soccer, etc.) [
4] that monitor flying objects and determine their trajectory, though with another objective, that with another software probably could be used for comparing trajectories of badminton shuttles.
By determining the exact properties of the shuttle, a better guideline to follow when developing new shuttles can be created. The players will also know that the shuttles are similar in trajectory and speed. The properties will be in focus instead of the brand of the shuttle.
2.2. Development of Synthetic Shuttles
To develop the shuttles even more there is a proposal to make synthetic feathers [
5] and thereby the possibility to make them stronger. Nowadays the shuttle breaks down after a few rallies on the highest level of play. For clubs and tournaments, the shuttle cost is extremely high. If the development of synthetic feathers is successful, the cost for shuttle consumption will probably go down, and natural materials, that are less consistent, don’t have to be a part of the raw material.
2.3. Measurements
This report is built on data from two main experiments using a Yonex shuttle. The first experiment focused on the trajectory of the shuttle. The trajectory was recorded and together with the program Qualisys track manager the position, velocity and acceleration could be handled. The second experiment focused on the rotation of the shuttle. The program Phantom camera control was used with a high-speed camera. To handle all the data and plotting the figures Matlab was used.
3. Results
The measurements specified in
Section 2.3 are described below. The experiments were done for several brands, but because Yonex is the most popular brand the testing of this shuttle was in focus. Thereby the analysis in this report focuses only on this specific brand.
3.1. The Trajectory
The trajectory of a badminton shuttle is described in
Figure 1. The figures include the whole trajectory and the end of each trajectory is when the shuttle hits the floor. In
Figure 1a the position from the hit of the racquet is describes as a projection on the floor and forward, which is set as the x-direction. In
Figure 1b the sideways deviation is described with positive magnitude to the left seen from the hitter, which is set as the y-direction.
Note that the graphs don’t start at zero but the shape of the trajectory is independent of the starting point for both x- and y-direction. In
Figure 1c the height of the trajectory is described with a starting point close above the floor, which is set as the z-direction. The time scale is described with frames from the data, 400 frames correspond to 1 second.
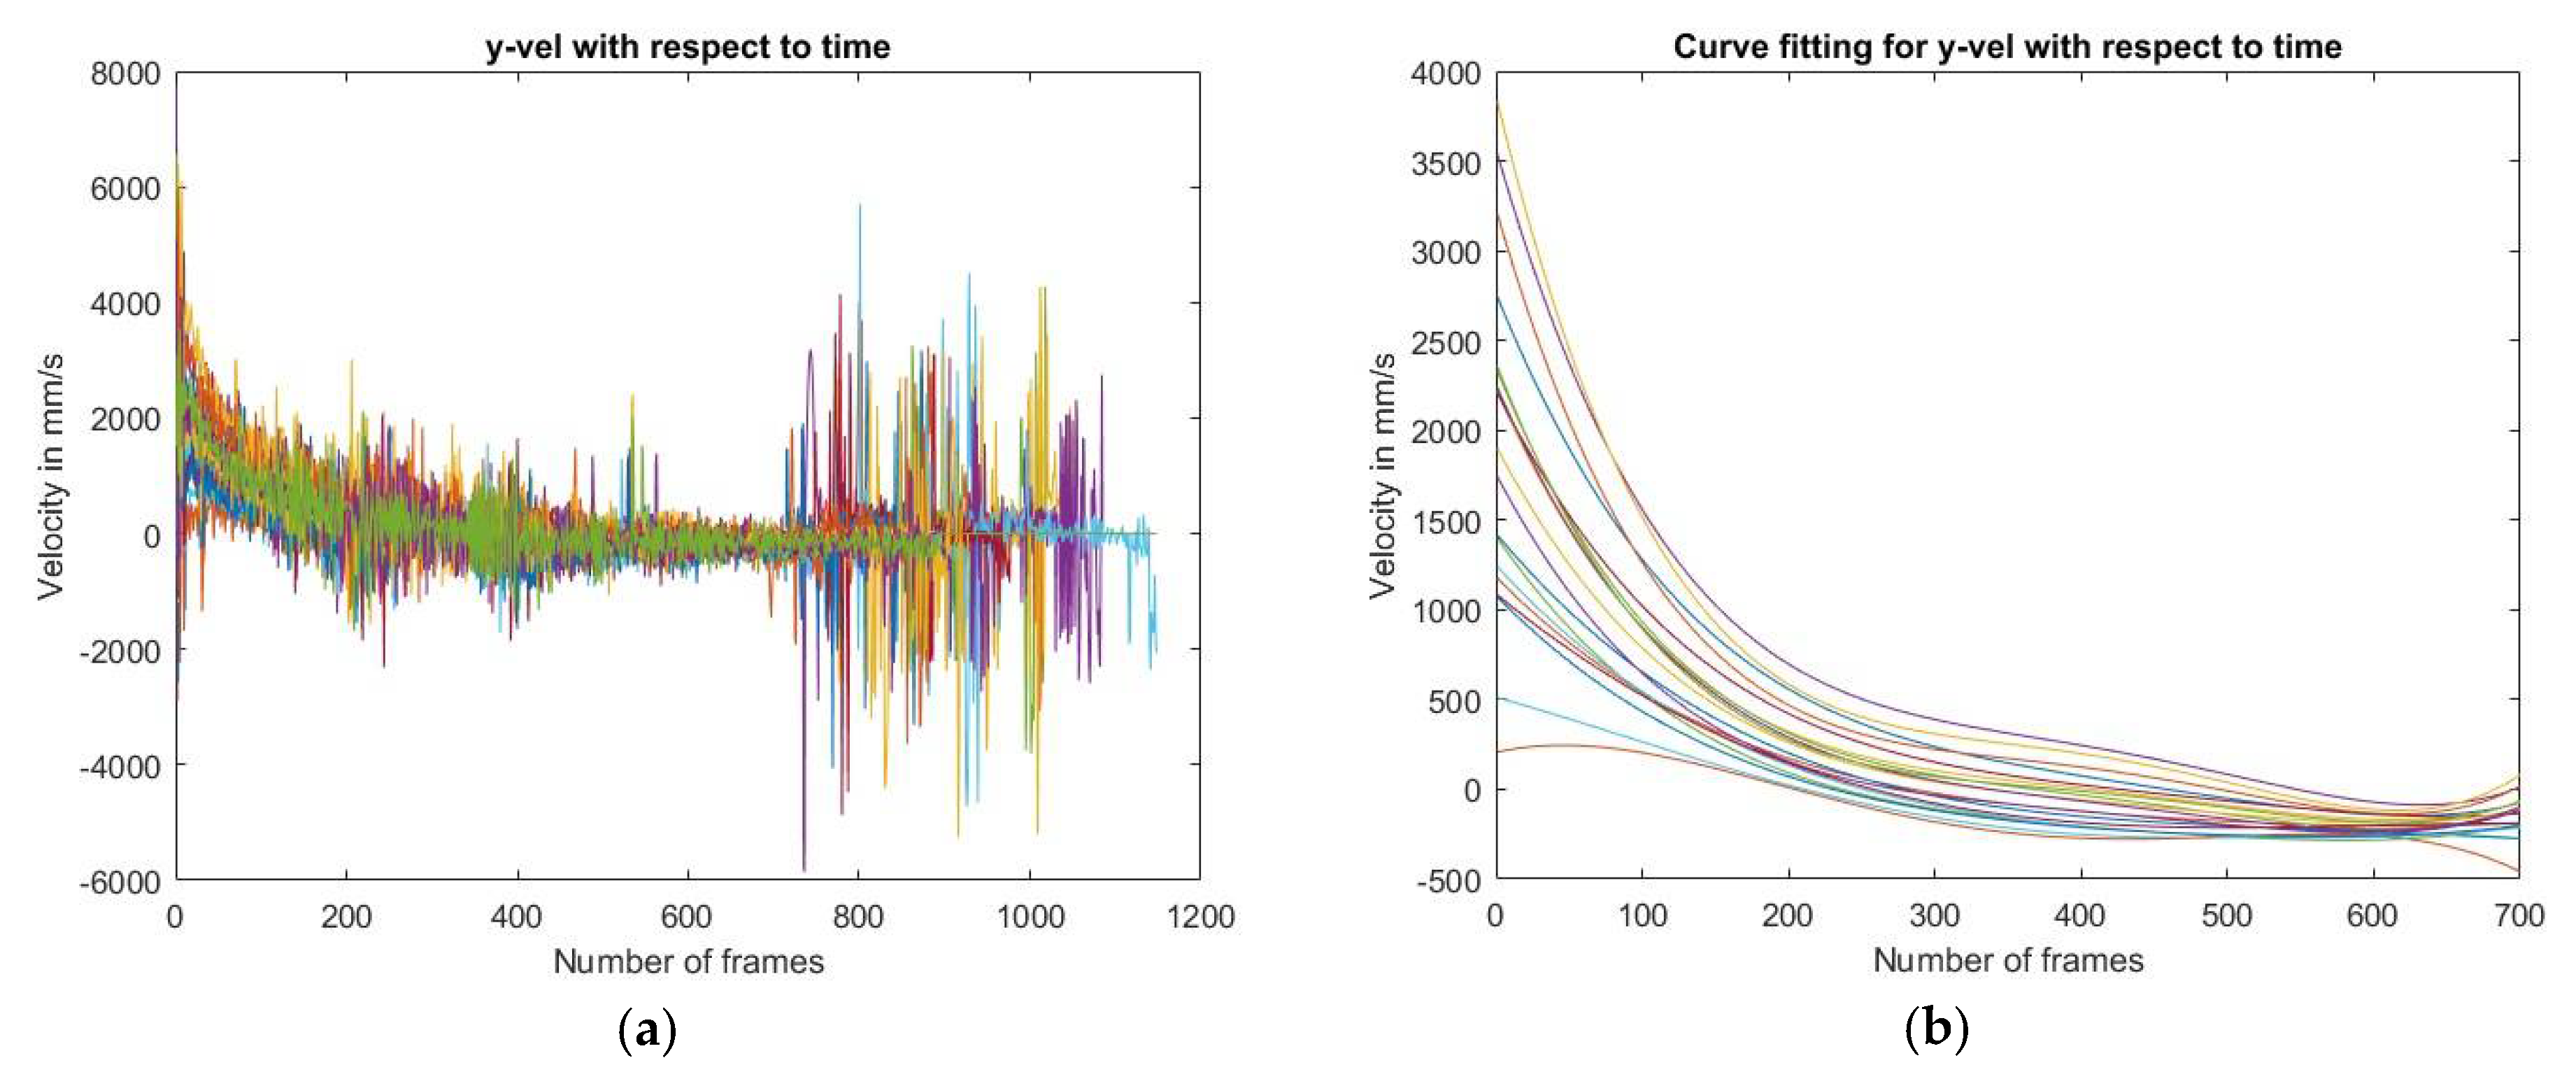
As seen is in
Figure 2a the data for velocity in the y-direction is very noisy due to measurement uncertainties. Therefore, the curve fitting visualized in
Figure 2b was needed to be able to analyze the related properties. This was unfortunately not the only problem with the data. Due to that experiments are hard to reproduce exactly, for each try the initial values were different. This is always a problem when the human inaccuracy is present. To reduce this uncertainty positions and velocities were only defined by the trajectories shape. This makes the values on axis in the plots less interesting in some cases. However, when trying to understand the governing properties this makes no difference. To eliminate the human inaccuracy the trajectories where moved to the same staring point, the origin of the plots was chosen as the starting point, and a point after a short period of time was matched to eliminate the difference in starting angle. The velocities were manipulated in a similar way to be able to compare them. In
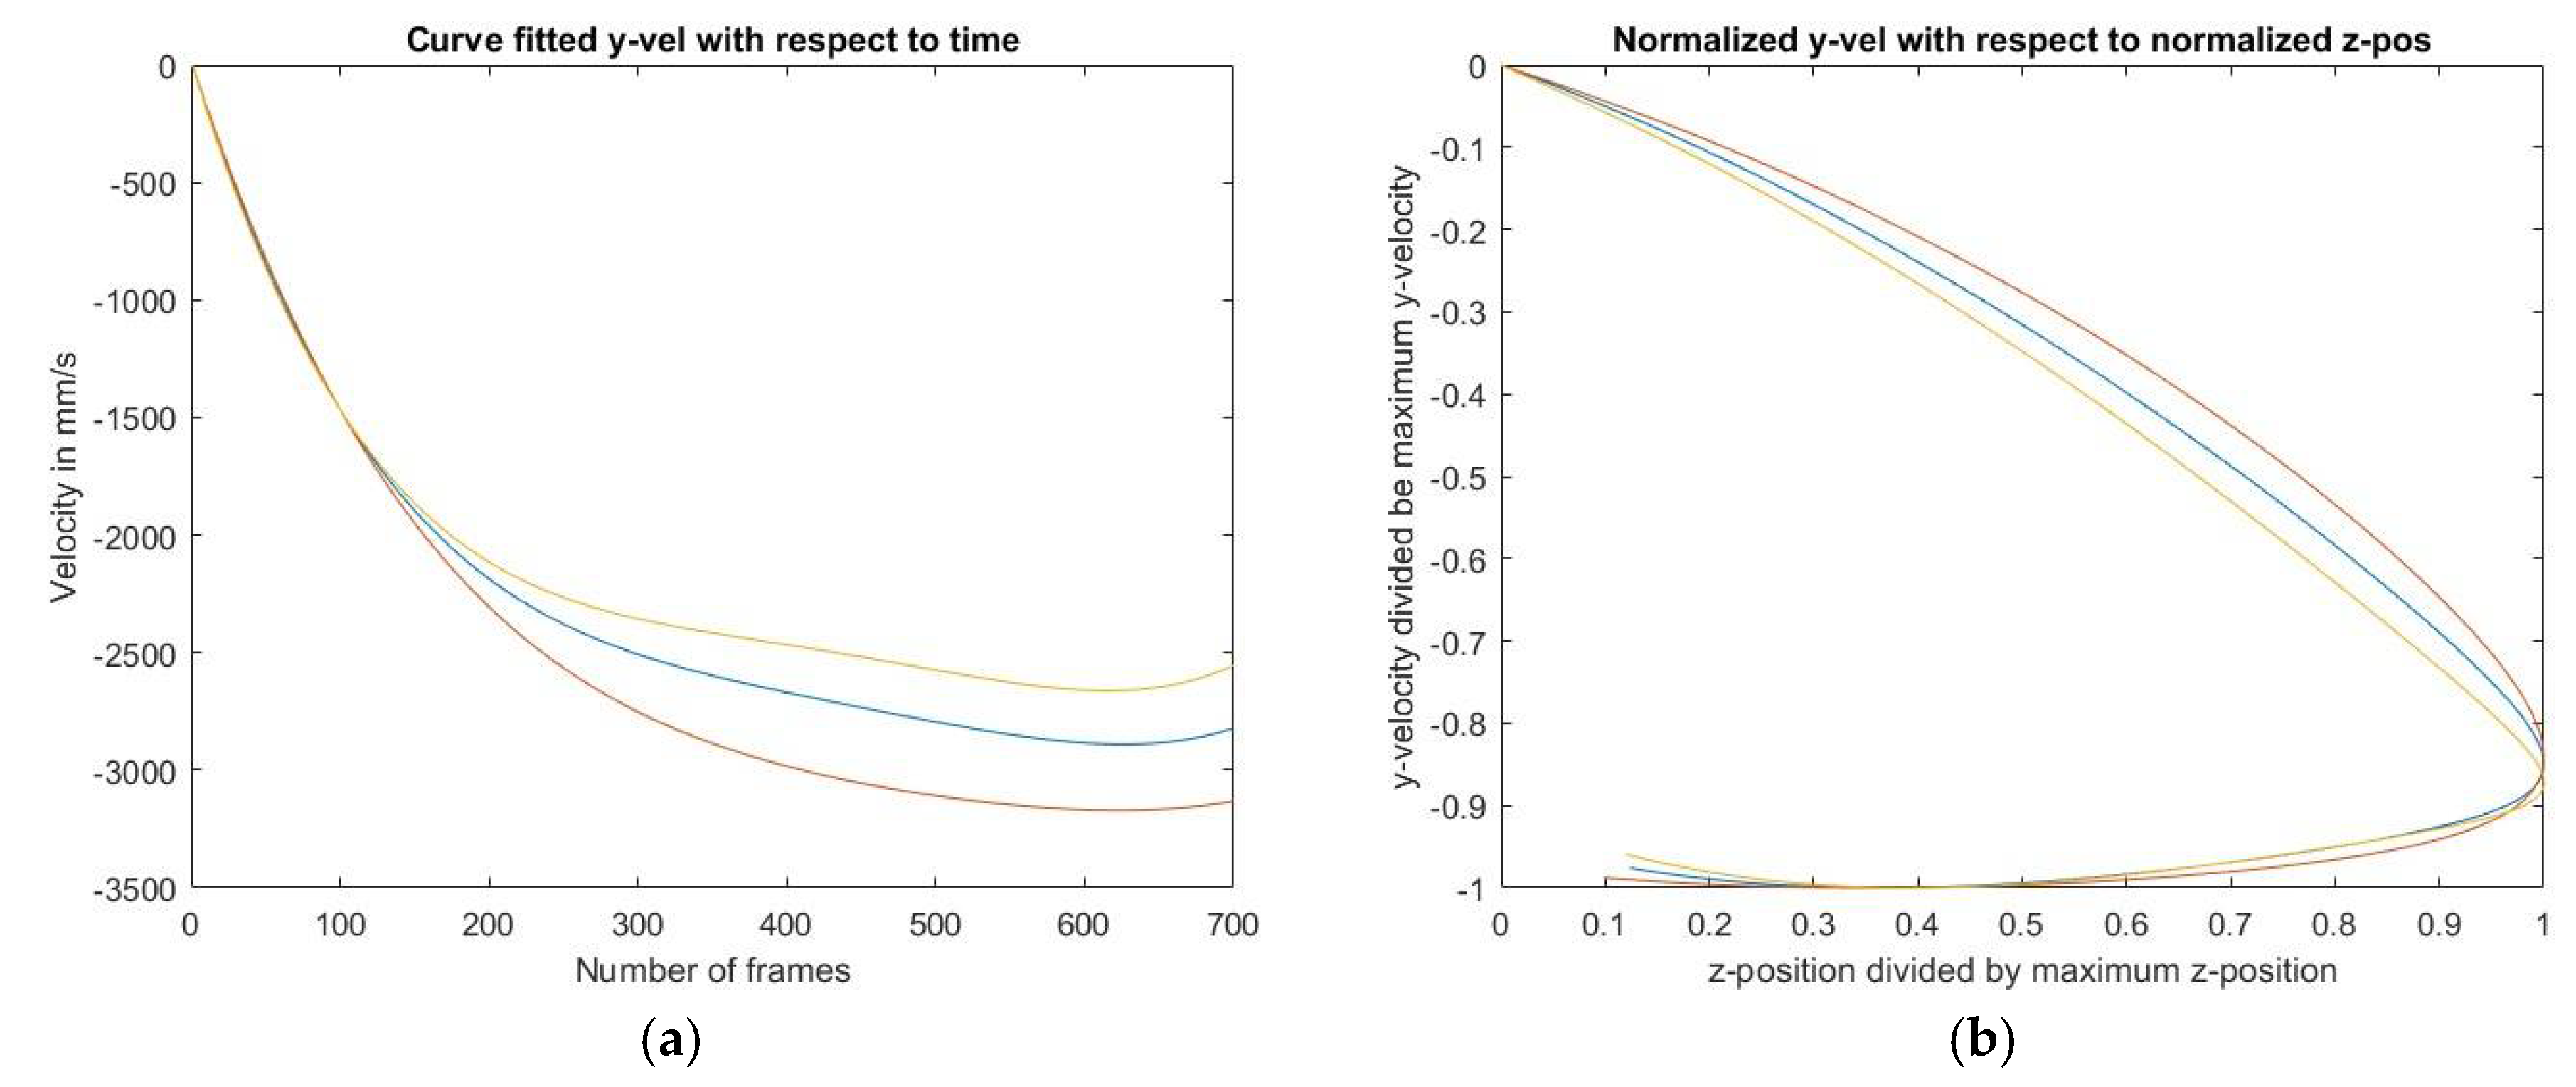
Figure 3 some properties of the trajectory are described. These plots are based on curve fitted values with residual values as close to 1 as possible. The residual value of 0.83 was obtained by fitting the y-velocity to a polynomial of degree four.
Figure 3 visualizes how the y-velocity is affected by its position in the trajectory. The graphs correspond to the same shuttle but different try-outs. The difference corresponds mainly to a difference in starting velocity. It’s difficult to eliminate this difference between the try-outs and still be able to distinguish other properties. Therefore, the difference in starting velocity is something to take into account through the analyses.
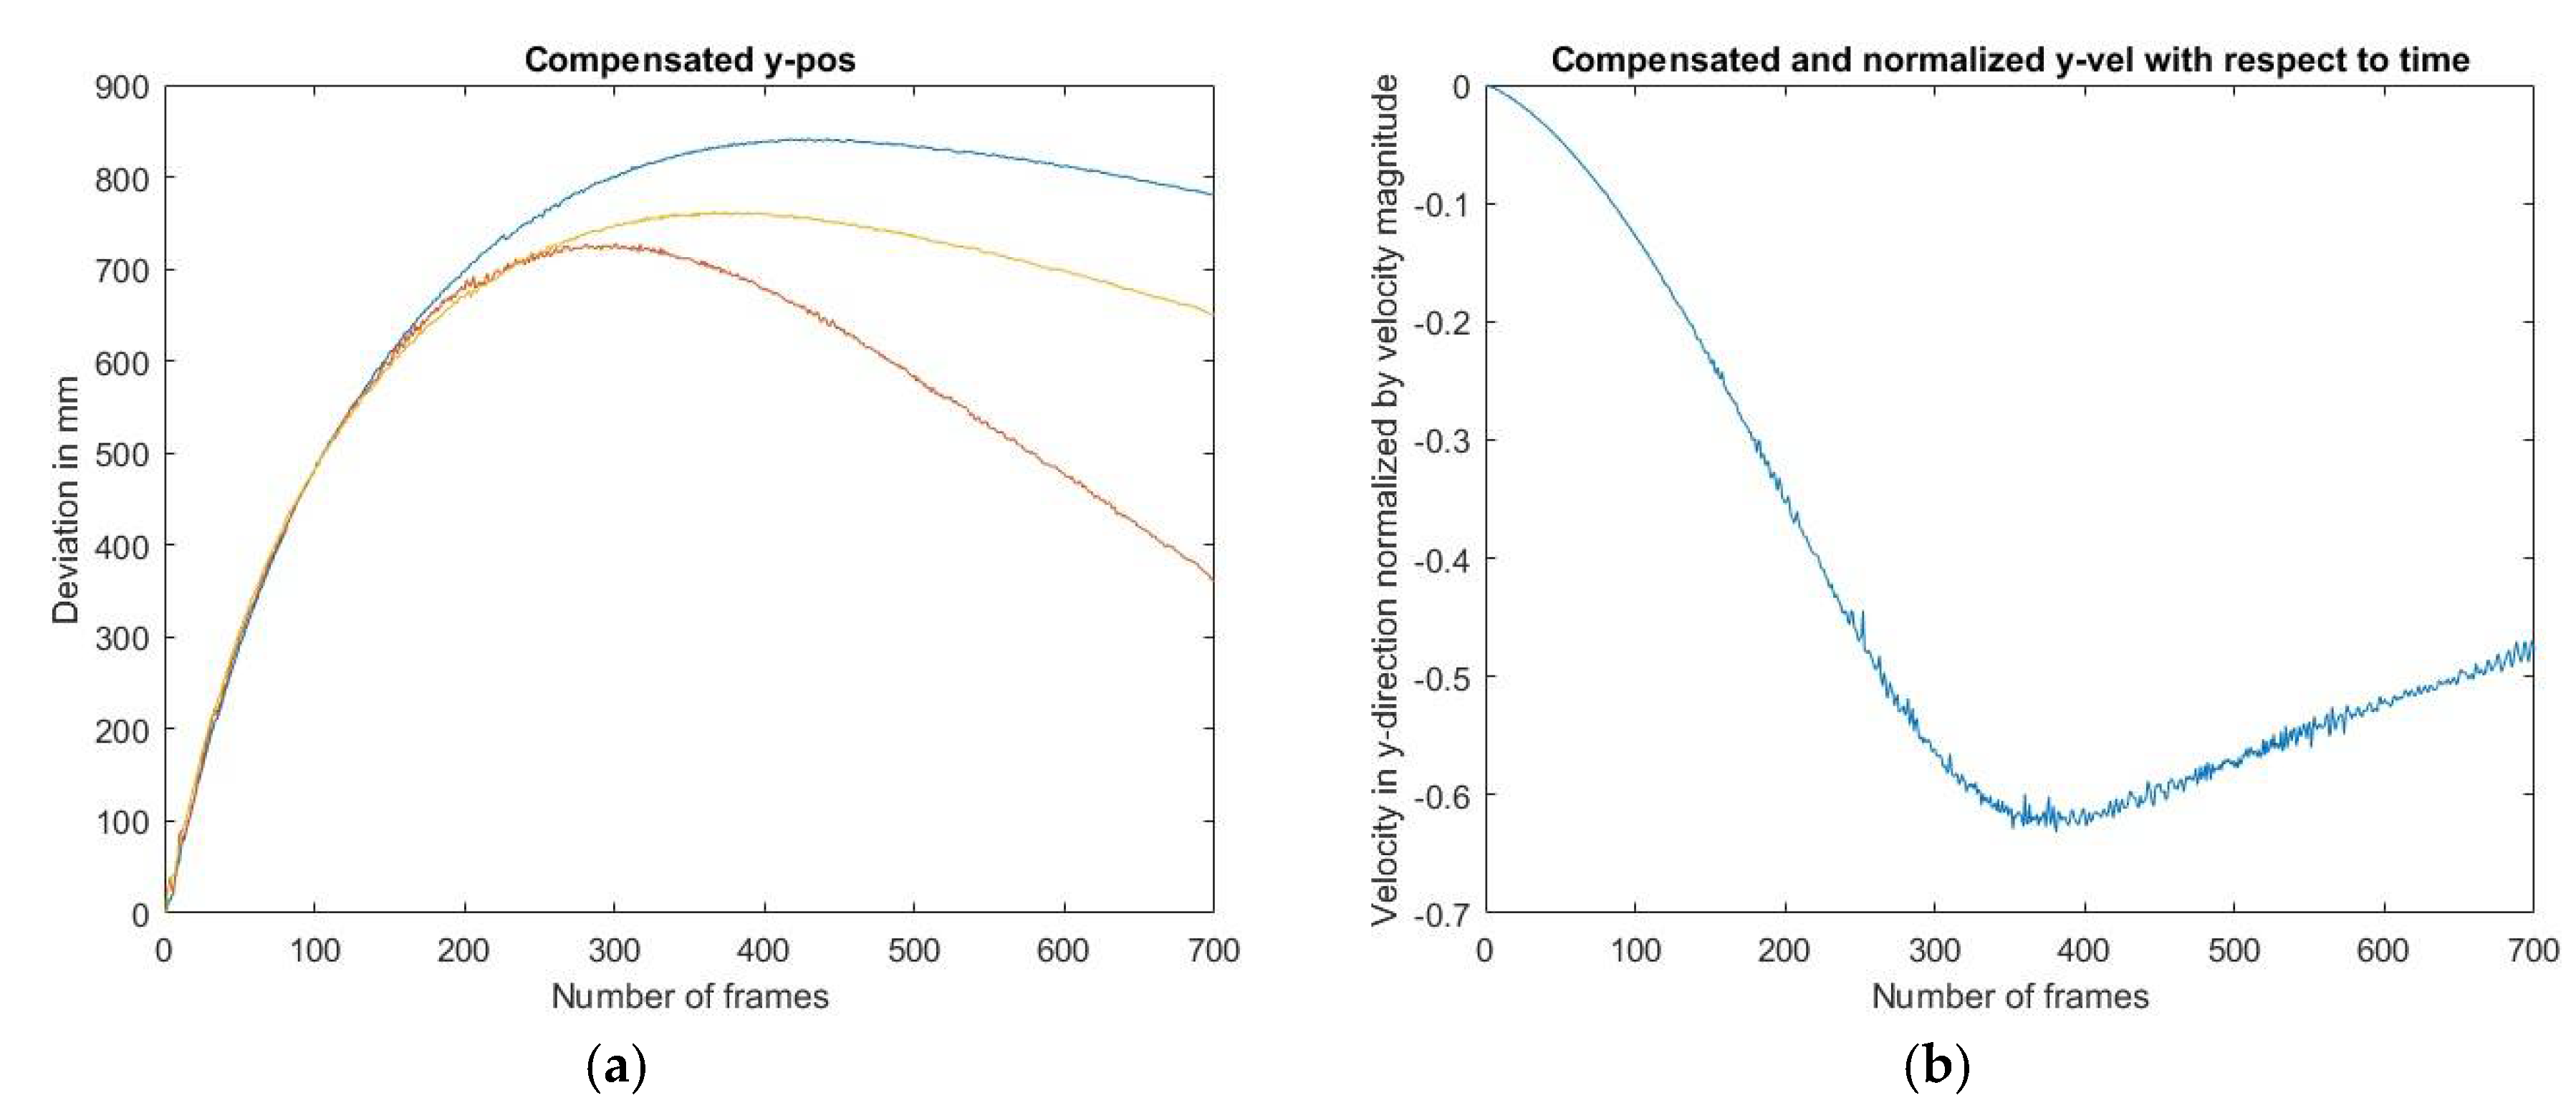
The behaviour when compensating for everything except for the starting y-position is visualized in
Figure 4a. The figure shows the absolute sideways deviation of the trajectory. The deviation has a negative derivative which means that the change of the trajectory makes the shuttle go to the right. In
Figure 4b the velocity in y-direction is plotted normalized with the velocity magnitude. The velocity is negative since it is in negative y-direction. The normalized velocity corresponds to a share of the total velocity. The share becomes greater and greater in the first part of the trajectory. This can be related to the rotation of the shuttle.
3.2. The Rotation
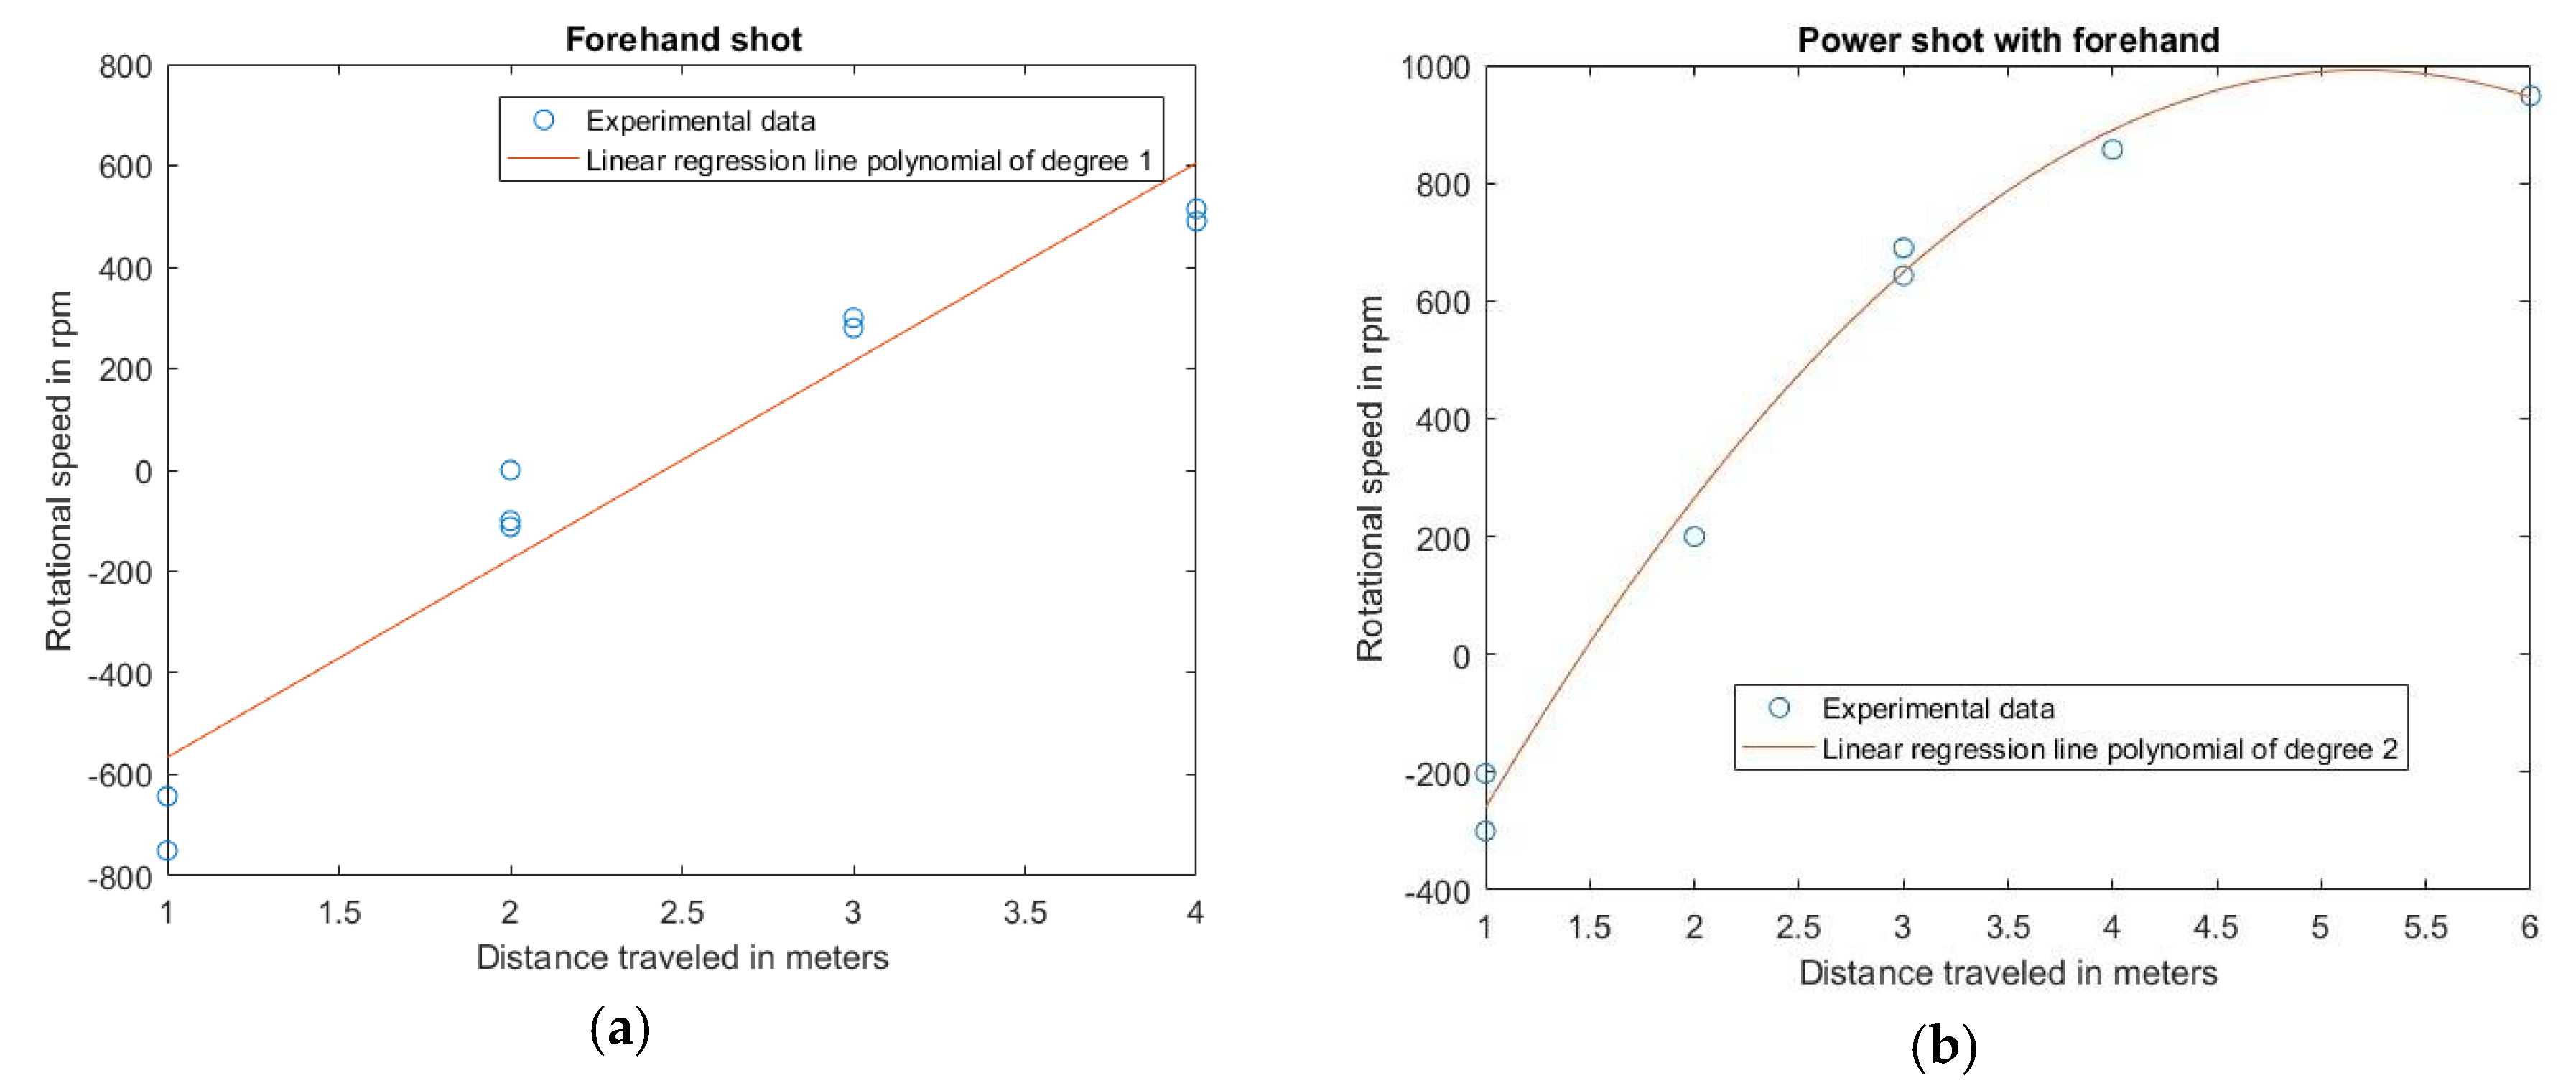
The aim of the second experiment was to measure the rotational speed of a shuttle. A Yonex shuttle was chosen and the rotation was captured with a high-speed camera. The rotational speed was calculated at different distances from the player who is right handed. In
Figure 5 this is presented together with linear regression lines capturing the trend of rotation due the position of the trajectory. The residual values for the regression coefficient are 0.9322 for the forehand shot and 0.9915 for the power shot.
The rotational speed is defined as positive in counter clockwise direction, seen from the player. This rotation it due to the pressure over the feathers and because of the angle of their position. In
Figure 6 the force on a feather is shown, and as the force on the feathers don’t point through the centre of gravity a mechanical momentum occurs. This moment causes the shuttle to rotate. This rotation in turn causes a force on the air due to Newtons third law of motion. These forces on all feathers makes it deviate in y-direction.
It’s important to point of that the player is right handed and it can be understood by analysing
Figure 5 closer. A right-handed player slices the shuttle and causes it to rotate in a clockwise direction in the beginning of the trajectory, which is specified as negative in this report. After approximately two meters the rotation becomes positive, rotation in the counter-clockwise direction. This maximum rotational speed is obtained in the later part of the trajectory as seen in
Figure 5b.
4. Discussion
When analyzing the trajectory there are a few ways of making the data as independent of variations as possible. Considering that the starting velocity differs between the try-outs, still the correlation between deviation in y-direction and rotation of the shuttle can be related.
In
Figure 5 the regression shows one behavior for the first part of the trajectory and one behavior that’s a little bit different for the later part. The first part is close to linear with a constant increase in rotation as shown in
Figure 5a. For the later part, the shape is more like a second order polynomial which also agrees quite well with the first part as shown in
Figure 5b. This implies that the behavior over the whole trajectory is more difficult to describe than with just a polynomial. In the end of the trajectory the rotational speed is almost constant. In
Figure 4 the deviation in y-direction tends to go to the right. This is a trend that increases more and more. The acceleration of the shuttle is therefor towards the right.
5. Conclusions
This report brings up the question about properties of badminton shuttles. In fact, there are many further studies that can be made regarding these and similar properties. The goal in long term would be to define the standard shuttle. The properties of this shuttle should benefit the players and the sport in matters of gameplay—keeping in mind that different environmental conditions maybe requires different properties of the shuttle. Furthermore, it’s important to understand the behaviour of shuttles is depending on air pressure and temperature. If all conditions are considered every player can practice with the same conditions as there are on the tournaments.
When the standard shuttle is defined, the real search for a synthetic equivalent can start. The search has already begun but it’s difficult to get an optimal result without the definition.
Also by using CFD which is a constantly evolving tool for understanding fluid dynamics a lot of testing would be simplified. CFD is expensive but a very good tool to reproduce tests and predicting movement in fluids. In businesses involving fluids and movement this is the key to really understand the flow. Probably, the use of the Finite element method (FEM) as a method to look at material properties of the shuttle is necessary. Especially elasticity and how the shuttle is affected under pressure will not be accurate if the shuttle is approximated as a rigid body.
