Abstract
Descend technique and performance vary among elite racing cyclists and it is not clear what slower riders should do to improve their performance. An observation study was performed of the descending technique of members of a World Tour cycling team and the technique of each member was compared with the fastest descender amongst them. The obtained data gives us guidelines for rider specific feedback in order to improve his performance. The bicycles were equipped with a system that could measure: velocity, cadence, pedal power, position, steer angle, 3D orientation, rotational speeds and linear accelerations of the rear frame and brake force front and rear. From our observation study, the brake point and apex position turned out to be distinctive indicators of a fast cornering technique in a descent for a tight, hairpin corner. These two indicators can be used as feedback for a slower rider to improve his descend performance.
1. Introduction
Some professional road cyclists descend faster than other riders. These differences can clearly be seen in races. Unfortunately, coaches are often in doubt on the specific advice they can give to slower descenders such that they can improve their performance.
Literature on descend and cornering technique for cyclists is non-existent, but on social media a lot of advice can be found. Some advice examples are: looking ahead to unconsciously ride the optimal trajectory or pushing hard on the outer crank and inside handlebar to maximize tire grip [1]. Common practice by coaches are to have a slow descender follow and mimic a fast descender.
A better solution would be to give real-time feedback to the rider based on the data of an observation study where the differences in accelerations, decelerations, position on the road and steering technique are measured between fast and slow riders. Large differences highlight specific actions the slower rider can improve. This paper presents the results of a first observation study. The work is a continuation of the seminal work by Lommers [2].
This paper is organized as follows. First, the experiment and measurement system are described in the materials and methods section. Next the results, being the time differences between the rider, differences in trajectory through a corner and differences in brake force and braking point are presented. The paper ends with a discussion and conclusions section.
2. Materials and Methods
The aim of the project is to provide professional cyclists with real-time feedback on how they can improve their descent time. Data of the descend technique of fast and slow riders is required in order to identify performance indicators. Therefore, an observation study was performed with eight professional cyclists from Team Sunweb. All participants signed an informed consent. For this study, the bicycle of each rider was equipped with the measurement system as shown in Figure 1. Each rider rode a 1.85 km descent, as shown in Figure 2, six times on his instrumented bicycle. They were instructed before each trial to cycle and descend as fast as possible. The following safety procedures were taken to ensure the safety of the riders. First, all riders performed the descent on their own, familiar bike. Each rider was familiar with the decent. Furthermore, before each trial the track was cleaned from debris. The experiment was performed in dry conditions only. The riders were told to cycle as fast, but safe as possible. Lastly, the riders were directly followed by a car with a person that could provide medical assistance if necessary.
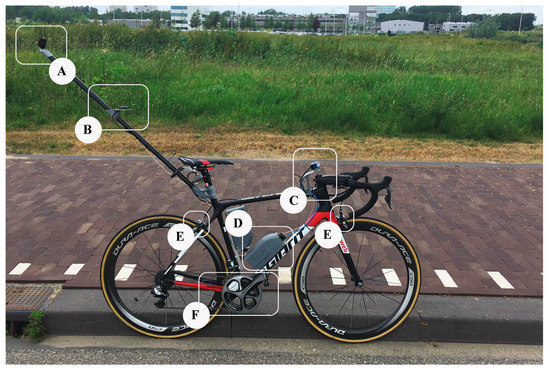
Figure 1.
Measurement system installed on a bicycle. (A) GoPro camera and mount to record rider posture; (B) GNSS antenna to measure rider’s position on the road; (C) optical encoder to measure steering angle; (D) IMU to measure roll angle and data acquisition system; (E) strain gauges on brake shoe to measure brake force; (F) velocity sensor and power meter.
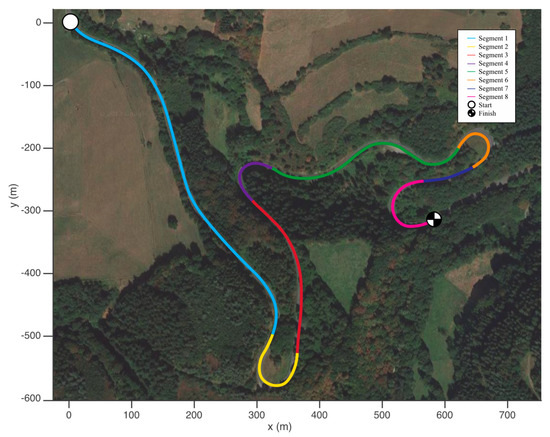
Figure 2.
Location of the experiment is a 1.85 km part of road of the L281 near Vossenack, Germany. The average gradient of the descent is 5 degrees. Start location is at the top left. The descent is divided into eight segments to compare rider technique for different elements (e.g., straight parts, left hand corners, right hand corners).
2.1. Measurement System
The bicycles were equipped with a measurement system that could measure: velocity, cadence and pedal power, position, steer angle, 3D orientation, rotational speeds and linear accelerations of the rear frame, brake force front and rear, and rider posture. The position of the rider on the road is measured with a Global Navigation Satellite System (GNSS) receiver. To increase accuracy, a base station was used and the GNSS antenna was mounted high above and behind the rider (see Figure 1). Even so, occlusions remained a problem on certain areas of the descent due to the environment (e.g., trees or proximity of a high cliff). The front and rear brake forces of the rider are measured using custom brake shoes on which strain gauges are installed. The lean angle of the bicycle is measured using an Inertial Measurement Unit (IMU) positioned at the bottle cage holder (see Figure 1). An optical encoder measures the steering angle. The back-wheel velocity and power produced by the athlete are measured by a velocity sensor and power meter standardly equipped on the team bicycles. Finally, a GoPro camera was mounted above and behind the rider to record his posture during the descent. The power meter and velocity sensor record at 1 Hz, the GNSS receiver at 5 Hz, the GoPro at 90 Hz and all other sensors at 100 Hz. All data is locally stored on a removable flash drive. The measurement system is interchangeable between bicycles within 10 min.
2.2. Data Processing
The control actions of the riders are compared at the same travelled track centerline distance as time and position on the road vary between riders and trials. Therefore, the position of the bicycle is projected on the track centerline. The track centerline is reconstructed from GNSS coordinates of the track boundaries, which is measured before the experiment, to a curvilinear coordinate system using the method described by Perantoni and Limebeer [3,4].
3. Results
First the time differences between the riders are compared. Figure 3 shows the time differences between each rider, for his fastest trial, as a function of the travelled track distance. Rider 5 had the fastest trial time and is therefore used as a baseline. If the gradient in Figure 3 is negative, this implies that a rider is slower than the fastest rider, whereas a positive gradient is the opposite. Consequently, the gradient coefficient shows how much time is won or lost. The vertical distribution of the lines also represents the ranking of descent time of the riders. It can be seen that rider 5 gains the most time on the other riders on the straights (segment 1 and segment 5), but loses time in the turns (segment 2, 6 and 8). The turns in the track lead to many changes in the ranking of the riders.
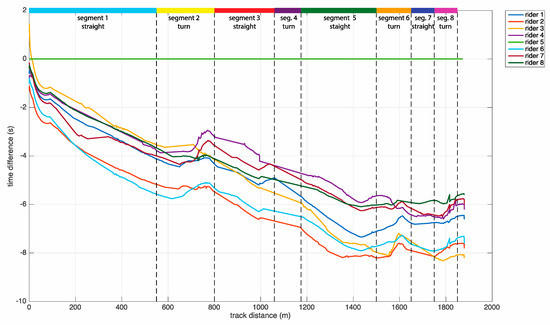
Figure 3.
The time difference between each rider, for his fastest trial, as function of the travelled track distance. The trial of rider 5 is taken as the baseline to calculate the time differences between the riders. The track distance is divided into six segments. Segment 2, 4 and 6 are sharp corners.
Segment 6 is a corner with the smallest radius of the track. This corner is therefore evaluated in more detail. Riders 1, 6 and 8 had the fastest split times in this corner, and rider 2, 3 and 7 the slowest split times. Figure 4 shows the trajectories of all trials of rider 5 and rider 6 in segment 6. Rider 6 was consistently faster than rider 5 in this corner. The trials of rider 5 and 6 have little trajectory variation. Rider 5 consistently takes a wider trajectory through the corner for all trials compared to rider 6. Entry and exit position are similar for both riders. Also, for both riders, the trajectory of the fastest trial is closest to the right boundary road.
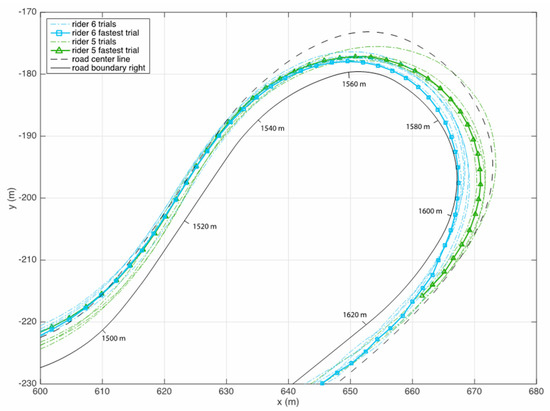
Figure 4.
The trajectories of all trials of rider 5 and rider 6 for segment 6 (turn 3). This is the sharpest right-handed turn of the descent. The trajectory of the fastest trial of each rider is bold and highlighted with a marker. The track boundaries for the right lane of the road are plotted in black. The dotted line indicates the centerline of the road.
Figure 5 shows the normalized brake force of the fastest trial of each rider superimposed on the track centerline for segment 6. The brake force of rider 5 is missing as the brake sensors could not be installed on his bicycle and the brake force of rider 3 is missing as the calibration was forgotten before his fastest trial. It can be seen that riders 2 and 7 brake harder and earlier than the other riders. Rider 1 and 6 brake the latest.
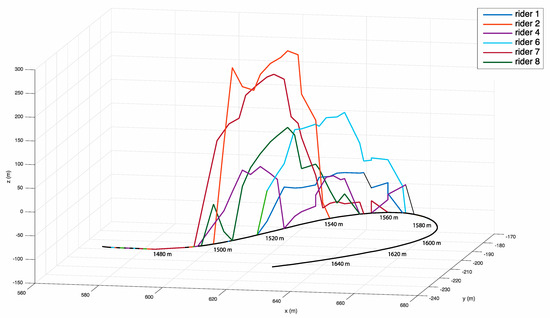
Figure 5.
The normalized brake force applied by the rider in segment 6 during his fastest trial superimposed on the centerline of the descent. Riders 1, 6 and 8 have the fastest split times for this segment. Riders 2, 3 and 7 had the slowest split times. Note that the brake data of rider 5 and rider 3 is not available.
4. Discussion
The measurement system turned out to be very robust during the experiment. All sensors maintained working throughout all trials, even in extreme conditions. However, the GNSS sensors encountered occlusions on several parts of the track, sometimes resulting up to a gap of five seconds without position fix. This resulted in loss of information for turn 2 (segment 4) which would have been an interesting part of the track to compare rider technique as there are smaller time differences between riders for this corner. The data of the IMU sensors might be used in the future, to determine the rider’s position on the road during short occlusion periods.
In addition, the ANT+ protocol proved to be unreliable to transfer data from the power meter and velocity sensor to the flash drive. When the power meter and velocity sensor went on standby (between trials of the same rider), the connection was not maintained but cut-off. The power meter and velocity data was retrieved from the power meter head unit and synchronized manually with the rest of the data.
The brake point and apex position are promising indicators of cornering performance. However, the importance of these two indicators remain corner dependent. For example, braking becomes less important when the approach velocity for a corner is lower and the fastest trajectory through a corner also depends on the previous and upcoming corners.
5. Conclusions
From our observation study, it can already be seen that there are two distinctive indicators of a fast cornering technique in a descent for a tight, right handed, hairpin corner. The fastest riders through this corner brake 10–20 m later. The fastest rider also steers in closer to the corner’s inside road boundary for similar corner entry and exit position on the road. Therefore, feedback on the brake point and apex position can be used to improve individual rider descent performance. Future work will be directed towards developing a system for real-time feedback.
Acknowledgments
This project was funded by “Nationale Sportinnovator prijs 2017”. We would also like to thank Team Sunweb for their support, collaboration and input and Niels Lommers for starting the project and developing the first prototype.
Conflicts of Interest
The authors declare no conflict of interest.
References
- Global Cycling Network. Available online: https://www.globalcyclingnetwork.com/video/how-to-descend-like-a-pro (accessed on 6 October 2017).
- Lommers, C.R. Descending: Measuring and Comparing Descending Technique and Performance in Professional Road Cycling. Master’s Thesis, Delft University of Technology, Delft, The Netherlands, November 2015. [Google Scholar]
- Perantoni, G.; Limebeer, D.J. Optimal control for a formula one car with variable parameters. Veh. Syst. Dyn. 2014, 52, 653–678. [Google Scholar] [CrossRef]
- Perantoni, G.; Limebeer, D.J. Optimal control of a formula one car on a three-dimensional track—Part 1: Track modeling and identification. J. Dyn. Syst. Meas. Control 2015, 137. [Google Scholar] [CrossRef]
Publisher’s Note: MDPI stays neutral with regard to jurisdictional claims in published maps and institutional affiliations. |
© 2018 by the authors. Licensee MDPI, Basel, Switzerland. This article is an open access article distributed under the terms and conditions of the Creative Commons Attribution (CC BY) license (https://creativecommons.org/licenses/by/4.0/).