Abstract
The following considers lift and drag measurements of 13 production golf ball models propelled through still air in a laboratory setting. The balls travelled at speeds ranging from 18 m/s to 91 m/s and spin ranging from 1500 rpm to 4500 rpm. Speed sensors measured the speed and location of the balls at three locations from which the coefficient of lift and drag were found. The sensors were sufficiently close (3.81 m to 5.08 m) so that the lift and drag effects were nearly constant. Lift and drag were observed to depend on speed, spin rate, and ball model. The difference in the drag coefficient between the ball models were relatively large (>0.1) at low speed (Re < 105), and smaller (<0.05) at high speed (Re > 105). The lift coefficient had a non-linear dependence on spin (fit with a 2nd order polynomial). A trajectory of each ball model was found from the measured lift and drag response. Carry distance varied by 18 m over the models considered here and was not strongly correlated with ball cost.
1. Introduction
Golf is one of the world’s most popular sports [1]. Golf ball aerodynamics have been studied for over a century. The first controlled experiments were collected in the 1940s [2] with the advancements of wind tunnel technology. Sport wide, golf balls travel at high speed and long distance. Thousands of patents exist concerning golf ball aerodynamics alone [3]. Recent legal action regarding ball performance is one example showing the strength of competition in a highly regulated industry [4]. This has motivated research on golf balls by producers to be kept confidential, with little information released publicly [5].
Drag is the force, , not including gravity, acting in the direction opposing the ball’s flight path. Lift, , is the force, not including gravity, on a ball that is directed perpendicular to the ball’s trajectory [6]. The drag coefficient and lift coefficient, and , are found from
where is the density of air, is the cross sectional area of the ball, and V is the ball speed.
Speed can be expressed in a non-dimensional form known as the Reynolds number, Re, which, for a ball, is defined by
where, D is diameter of the ball, υ is kinematic viscosity of air, and V is the linear speed.
For balls with spin, it is convenient to describe the ratio of the angular velocity to the linear velocity by the non-dimensional spin factor [7], S, defined by
where ω is the angular velocity, and r is the ball radius.
Aerodynamics of golf balls has been studied in wind tunnels where a ball is held stationary in moving air. Bearman and Harvey [8], Aoki [9], Libii [10] have conducted several studies on golf ball aerodynamics. Wind tunnels are known for good control over air speed and ball orientation, but have difficulty supporting the ball and adding ball rotation. Wind tunnels correct for blockage effects using empirical factors [11] and use scaled ball models to study high Reynold’s number regimes. Scaled models may not represent production balls since the surface of golf balls are sensitive to dimple shape and surface roughness. The disparity between wind tunnel and play conditions have caused some to question the results of wind tunnel measurements [5,10]. This is not to imply that wind tunnel measurements are incorrect, but that studying sport balls in an environment similar to play may achieve results more representative of the sport.
Recent technological advances in high speed videography [12], light gates [13], and Doppler radar tracking [14] have allowed for improved accuracy of inflight trajectory measurements in laboratory and game environments. Where wind tunnels measure resultant forces on the ball, still air experiments measure the speed and position of the ball. Many have adopted high resolution speed sensors [15,16] to find lift and drag of sports balls in still air. The USGA has adopted similar methods using numerous speed sensors strategically placed over long distances [17]. To the authors’ acknowledge, no academic study has analyzed commercially available golf balls in still air at sport like speeds (up to 90 m/s) and spin rates.
This study considered the effect of speed, spin, and ball model on the drag and lift coefficients. Measurements were made in a still air laboratory setting at speeds comparable to game conditions. Production golf balls were selected based on popularity (i.e., Costco’s Kirkland Signature) and market share (i.e., Titleist Pro V1). The combined effect of lift and drag was considered by calculating carry distances for a driver shot comparable to play conditions.
2. Method
This study considered 13 models of golf balls. Balls were chosen based on popularity in the market. To understand performance variation within one maker, the least and most expensive model of golf ball was chosen for Titleist, Callaway and TaylorMade. The study was, in part, motivated by the low cost Kirkland ball, which many claim performed similar to balls of higher cost. Due to its popularity and a lawsuit, production was disrupted between 2016 and 2017. The 2016 and 2017 models of the Kirkland ball were, therefore, compared to consider consistency year-to-year. General information for these balls are shown in Table 1.

Table 1.
Description of the golf balls considered in this study.
A bespoke, non-wheeled, pitching machine was used to project the golf ball at the target speed and spin rate without damaging or disrupting the surface of the ball. A flexible tip (shown in Figure 1) coupled to a pneumatic linear accelerator was used to impart spin. High and low friction materials were attached to opposite sides of the tip to generate torque about the center of the ball. Spin was controlled by changing the length and compressive force of the tip on the ball. When spin was not required, the flexible tip was removed and balls were accelerated from a tee.
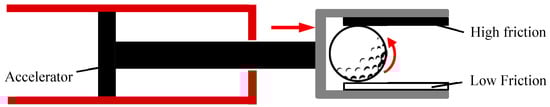
Figure 1.
Setup on pitch machine to generate back spin on pitching machine.
Balls were projected at play conditions with speed ranging from 18 m/s to 91 m/s and spin ranging 1500 rpm to 4500 rpm.
Ball speed and location were measured at three locations along the flight path, as shown in Figure 2. Sensors measured speed from successive pairs (0.41 m apart) of light gates (Ibeam, ADC, Romeoville, IL, USA). The distance, d, between the second and third speed sensor varied between 3.81 m and 5.08 m while the heights were within 0.025 m of each other. Sensors were placed to maximize distance between them, while minimizing the change in trajectory angle (the vertical component of velocity was 1.34 m/s or less) with respect to the horizontal plane. The ball’s vertical location was measured at each speed sensor and used to calculate the lift force. A high speed video camera (Phantom V711 at 2000 fps) was used to record each shot to verify spin. The drag force, , was found from
where V2 and V1 were the speeds at the second and third sensors, respectively, and m was the ball mass. The lift force, FL, was found from
where was vertical change in ball position between the second and third speed sensors, was the vertical velocity at the second speed sensor, was the time from the first speed sensor to the second speed sensor, was the time for the ball to travel from the second speed sensor to the third speed sensor, and was gravity. The vertical component of velocity at the second sensor, , was found iteratively from the known speeds and locations at all three sensors.
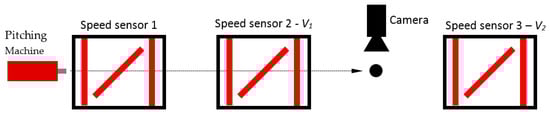
Figure 2.
Arrangement of pitching machine, speed sensors and camera to measure ball speed, rotation and location. Gate aligned vertically measured ball speed while angled gates measured position.
A smooth sphere was included in the study since its drag is well characterized [18]. It was projected between 0.9 × 10⁵ < Re < 1.2 × 10⁵. As is shown in Figure 3a, the average of the smooth sphere was which agreed well with others [19].
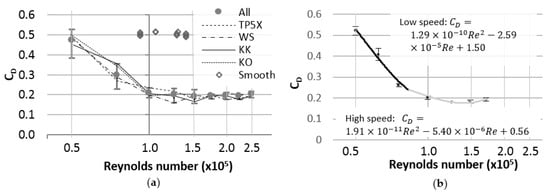
Figure 3.
(a) Coefficient of drag as a function of Reynolds number for non-rotating balls; (b) Drag coefficient and empirical fits for KK (with spin). Error bars indicate the standard deviation of data.
3. Results
For each model, two balls were selected. Each ball was used to collect three shots at each speed. Drag and lift coefficients were calculated from the average of 6 shots.
3.1. Drag
The drag coefficient of spinning and non-spinning golf balls was found between 18 and 91 m/s. The drag coefficient is plotted as a function of Reynolds number in Figure 3a. A drag crisis (high drag dependence on speed) is observed in the plot. The average of all balls is included in the plots (filled circles) to show the performance of golf balls as a group, with error bars indicating the highest and lowest measured drag for all balls at each speed. Figure 3a includes models of interest for this study: TP5X (lowest on average), WS (highest on average), KK and KO.
3.1.1. Drag—Non-Rotating Projectiles
For non-spinning balls, the average coefficient of drag was near 0.5 at low speed (Re = 5 × 10⁴), and close to 0.2 at higher speed (Re = 1 × 10⁵). The largest difference in between balls was observed at low speed (Re < 7.5 × 10⁴).
3.1.2. Drag—Rotating Golf Balls
Balls were projected with 1500 to 2500 rpm spin to simulate play conditions [20]. A drag crisis similar to non-rotating balls was observed for the spinning balls. Drag curves were fit using two polynomial equations where the first polynomial spanned the low Reynolds number region (50,000 < Re < 100,000) and the second spanned the high Reynolds number region (75,000 < Re < 200,000). Figure 3b shows the drag coefficient and polynomial fits for KK.
3.2. Lift—Rotating Golf Balls
The lift coefficient is expressed as a function of spin factor in Figure 4a. To avoid the influence of the reverse Magnus effect at low speed [7], balls were projected from 32 m/s to 91 m/s with spin from 1500 rpm to 4500 rpm. Previous work [8] showed lift following a polynomial trend with spin [7], thus each golf ball model here was fit to a 2nd order polynomial. Figure 4b shows the lift coefficient for the KK ball.
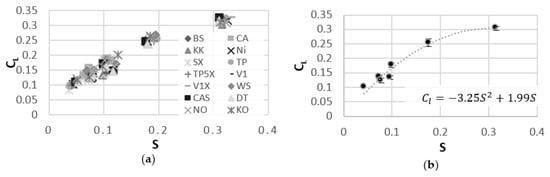
Figure 4.
(a) Coefficient of lift as a function of spin factor; (b) Coefficient of list as a function of spin factor for KK. Error bars indicate the standard deviation of data.
3.3. Golf Ball Trajectory Simulation
From the drag and lift coefficients of each golf ball model, trajectory and carry distance can be found at game conditions. All balls were given identical release conditions of 71.5 m/s; 6° launch angle; and 3000 rpm backspin with 4% per second spin decay [21]. Carry distance was measured from the start position until the ball returned to zero elevation. As shown in Figure 5, the difference between the longest and shortest carry distance was 18 m with the BS and KK traveling the farthest (within 0.5 m of each other). The trajectory of 4 representative models is shown in Figure 6. The two balls with the longest carry distance were not from the high price category. The precision error of the speed sensor was found to be 0.025% of the measured speed [18]. Accordingly, the uncertainty of CD was 0.0025 for a golf ball travel from 32 m/s to 71.5 m/s which could lead to an error of 2.3 m on calculated carry distance.
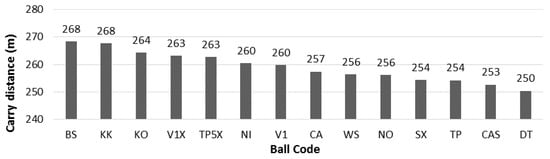
Figure 5.
Simulated carry distance for all golf ball models.
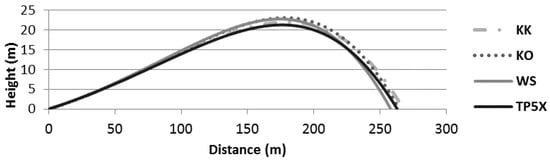
Figure 6.
Trajectory simulation of 4 selected golf ball models.
4. Conclusions
This study measured the lift and drag of 13 production golf ball models propelled through still air in a laboratory setting. The coefficient of drag for golf balls was close to 0.5 at low speed, and decreased to 0.2 at high speed. The lift coefficient was positively correlated with the spin factor. Small differences in the drag and lift coefficient (0.02 on average) can result in large differences carry distance (18 m). A low and medium priced ball had the longest carry distance, travelling further than all top brand golf balls.
Conflicts of Interest
The authors declare no conflict of interest.
References
- PledgeSports. Top 10 Most Popular Sports in the World by Participation. 2017. Available online: https://www.pledgesports.org/2017/06/top-10-most-popular-sports-in-the-world-by-participation/ (accessed on 1 June 2017).
- Davies, J.M. The aerodynamics of golf balls. J. Appl. Phys. 1949, 20, 821–828. [Google Scholar] [CrossRef]
- Hernandez, M.V. USPTO Recognizes Patents on Golf-Related Inventions as Masters Tournament Opens. 2002. Available online: https://www.uspto.gov/about-us/news-updates/uspto-recognizes-patents-golf-related-inventions-masters-tournament-opens (accessed on 4 April 2002).
- Wire, G. Ball Wars: Titleist’s Parent Company Countersues Costco for Patent Infringement, False Advertising over Its Kirkland Ball. 2017. Available online: http://www.golf.com/equipment/2017/08/16/ball-wars-titleists-parent-company-countersues-costco-patent-infringement-false-advertising-over-its (accessed on 16 August 2017).
- Alam, F.; Steiner, T.; Chowdhury, H.; Moria, H.; Khan, I.; Aldawi, F.; Subic, A. A study of golf ball aerodynamic drag. Procedia Eng. 2011, 13, 226–231. [Google Scholar] [CrossRef]
- Elger, D.F.; Roberson, J.A. Engineering Fluid Mechanics; Wiley: Hoboken, NJ, USA, 2013. [Google Scholar]
- Nathan, A.M. The effect of spin on the flight of a baseball. Am. J. Phys. 2008, 76, 119–124. [Google Scholar] [CrossRef]
- Bearman, P.; Harvey, J. Golf ball aerodynamics. Aeronaut. Q. 1976, 27, 112–122. [Google Scholar] [CrossRef]
- Aoki, K.; Muto, K.; Okanaga, H. Aerodynamic characteristics and flow pattern of a golf ball with rotation. Procedia Eng. 2010, 2, 2431–2436. [Google Scholar] [CrossRef]
- Libii, J.N. Dimples and drag: Experimental demonstration of the aerodynamics of golf balls. Am. J. Phys. 2007, 75, 764–767. [Google Scholar] [CrossRef]
- Awbi, H.; Tan, S. Effect of wind-tunnel walls on the drag of a sphere. J. Fluids Eng. 1981, 103, 461–465. [Google Scholar] [CrossRef]
- Cross, R.; Lindsey, C. Measurements of drag and lift on tennis balls in flight. Sports Eng. 2014, 17, 89–96. [Google Scholar] [CrossRef]
- Lieberman, B.B.; Smith, A.J.; Quintavalla, S.J.; Thomas, F.W.; Winfield, D. Method for Determining Coefficients of Lift and Drag of a Golf Ball. US Patent US6186002 B1, 3 February 2001. [Google Scholar]
- Martin, J.; Smith, L.V.; Kensrud, J.R. Drag on sports balls using Doppler radar. Procedia Eng. 2012, 34, 134–139. [Google Scholar] [CrossRef][Green Version]
- Kensrud, J.R.; Smith, L.V. In situ drag measurements of sports balls. Procedia Eng. 2010, 2, 2437–2442. [Google Scholar] [CrossRef]
- Kensrud, J.R.; Smith, L.V. In situ lift measurement of sports balls. Procedia Eng. 2011, 13, 278–283. [Google Scholar] [CrossRef]
- United States Golf Association (USGA). The Ball: Aerodynamics Background Information. Available online: http://www.usga.org/resources/stemfiles/AERO68/aerodynamics_background_info_MS.pdf (accessed on 1 September 2017).
- Kensrud, J.R. Determining Aerodynamic Properties of Sports Balls in Situ; Washington State University: Pullman, WA, USA, 2010. [Google Scholar]
- Achenbach, E. The effects of surface roughness and tunnel blockage on the flow past spheres. J. Fluid Mech. 1974, 65, 113–125. [Google Scholar] [CrossRef]
- Bliss, K. The Average Spin Rates, Launch Angle & Ball Speed for Golf. Available online: http://www.livestrong.com/article/439185-average-spin-rates-launch-angle-ball-speed-golf/ (accessed on 11 September 2017).
- Trackman Newsletter #7. p. 7. Available online: http://www.gavlegolf.com/Media/Get/2610/trackman.pdf (accessed on 1 October 2010).
Publisher’s Note: MDPI stays neutral with regard to jurisdictional claims in published maps and institutional affiliations. |
© 2018 by the authors. Licensee MDPI, Basel, Switzerland. This article is an open access article distributed under the terms and conditions of the Creative Commons Attribution (CC BY) license (https://creativecommons.org/licenses/by/4.0/).