An Experimental Protocol to Model Recovery of Anaerobic Work Capacity †


1
Department of Mechanical Engineering, Clemson University, Clemson, SC 29634, USA
2
Department of Health Sciences, Furman University, Greenville, SC 29613, USA
*
Author to whom correspondence should be addressed.
†
Presented at the 12th Conference of the International Sports Engineering Association, Brisbane, Queensland, Australia, 26–29 March 2018.
Proceedings 2018, 2(6), 208; https://doi.org/10.3390/proceedings2060208
Published: 14 February 2018
(This article belongs to the Proceedings of The 12th Conference of the International Sports Engineering Association)
Abstract
:Models of fatigue are based on physiological parameters such as Critical Power (CP) and Anaerobic Work Capacity (AWC). CP is a theoretical threshold value that a human can generate for an indefinite amount of time and AWC represents a finite expendable amount of anaerobic energy at intensities above CP. There is an increasing interest in developing mathematical models of energy expenditure and recovery for athletic training and human performance. The objective of this research is to propose and validate a model for recovery of AWC during a post exertion recovery interval of cycling. A cycling ergometer study is proposed which involves a ramp test to determine gas exchange threshold, a 3-min all-out intensity test to determine CP and AWC, and exertion-recovery interval tests to understand recovery of AWC. The results will be used to build a human in the loop control system to optimize cycling performance.
1. Introduction
The onset of fatigue can be understood as the moment at which a human is unable to continue a physical exercise at a specified intensity. Exercise intensity has been classified as severe, high, and moderate based on blood lactate levels [1], maximum oxygen uptake () [2,3], and power output [3]. Exercise intensity is often defined based on the concept of critical power by Monod and Sherrer [4]. Critical power (CP) is the power level that can be generated “indefinitely”[4]. Prolonged exercise can be carried out below CP as blood lactate and levels can attain a steady state and exercising in this domain is classified as either moderate or high intensity [3]. Whereas, blood lactate and levels cannot attain a steady state while exercising above CP and hence classified as the severe intensity domain [3]. Thus, CP marks the threshold between high and severe intensity exercise. Additionally, CP is considered to be a boundary between the aerobic and anaerobic energy domains [5]. Therefore, it is possible to model fatigue based on the domain in which a human or an athlete is functioning. Modelling fatigue based on power is a system-level perspective of the human body with the goal of optimizing performance. Accurate mathematical models of fatigue can potentially lead to improved race performance for athletes, mission planning for soldiers, as well as understanding the physiological underpinnings of fatigue. The remainder of this paper is organized in 4 sections. Section 2 introduces the critical power concept and a review of the literature is provided. Section 3 describes the proposed testing protocol to model the expenditure and recovery of Anaerobic Work Capacity (AWC). The development of a mathematical model of CP and AWC is provided in Section 4 and conclusions and future work are discussed in Section 5.
2. Models of Critical Power and Anaerobic Work Capacity
The critical power concept started taking shape in Hill’s work on athletic records in 1925 [6]. Hill saw a hyperbolic trend when he plotted various athletic records across different sports against their respective times. Monod and Sherrer [4] defined CP as a power level at which an athlete can function indefinitely and AWC was called as Limit work and defined as the energy available for an athlete to operate above their CP. A hyperbolic relationship between CP and Limit work was developed using a series of constant work rate tests to exhaustion on a cycle ergometer given by,
where, WLim is Limit work in Joules, P is power in Watts, CP is critical power in Watts, and tLim is time-to-exhaustion in seconds. A linear transformation of Equation (1) has been reported in many publications by plotting power versus 1/tLim with CP being the y-intercept and WLim being the slope of the line [7]. Additionally, limit work has been referred to as Anaerobic Work Capacity (AWC) and will be referred so hereafter.
Many researchers have proposed regression models based on Equation (1), which have been compared by Bull and colleagues [8] and Bergstrom and colleagues [9]. Vanhatalo and colleagues [10] proposed a test to determine both CP and AWC in a single 3 min all-out intensity test (3mAOT). The subjects, after a warm up, pedal at their maximum intensity for 3 min and the average power of the last 30 s is estimated to be the CP. The area under the curve above CP is estimated to be AWC. The 3mAOT has been validated in [11,12] and thus, has eliminated the need for multiple constant work rate tests.
Morton [5] discussed the critical power concept using a hydraulic model, where the human body derives energy from two vessels: aerobic (unlimited capacity) and anaerobic (limited capacity, AWC) vessels connected by a tube of fixed diameter. Morton described that the human body derives energy from the anaerobic vessel only when functioning above CP and from the aerobic vessel while functioning below CP. Morton’s model implies that the anaerobic vessel is refilled by the aerobic vessels via the tube while functioning below CP.
There have been attempts to study the recharge of this AWC tank in [13,14,15,16]. Morton and Billat [13] assumed that the rate of recharge of AWC is equal to the rate of its depletion and derived the following from Equation (1),
where, t is the total time of the exercise bout, n is the total number of intervals, tw and tr are the durations of work intervals above and below CP respectively, W′ is AWC, Pw and Pr are power output during work intervals above and below CiP respectively. Chidnok and colleagues [14] used Equation (3) to determine CP and AWC during intermittent cycling and compared them with other methods. Ferguson and colleagues [15] suggested that the recovery of AWC was not equal to expenditure and was non-linear. Considering the non-linear nature of recovery AWC, Skiba and colleagues [17] proposed a model for recovery of AWC for intermittent cycling given by,
where, W′bal is the AWC balance for an individual, W′ is AWC, W′exp is the amount of AWC expended, (t − u) is the recovery interval duration, τW′ is the time constant of reconstitution of AWC. Skiba and colleagues derived an equation for τW′ using non-linear regression analysis.
where, DCP is difference between CP and average power held during all recovery intervals.
The regression in Equation (4) was derived by determining τW′ values by assuming the left hand side of Equation (3) to be zero at exhaustion and plotting them against respective DCPs. The limitation of Skiba’s model is that the real-time modeling of the AWC balance is not possible [18] (p. 78). Furthermore, there is an imbalance of units that can be observed in the integral term of Equation (3). The integral term has units of Joules-second, whereas the left hand side is in Joules. Additionally, although the model was validated by Skiba and colleagues in [17], the model results in negative values of AWC balance (shown in [17]). A negative AWC balance could be due to standard errors involved in determination of CP and AWC. Under the assumptions of the critical power concept discussed in [5], a negative AWC balance is not possible. Thus, refinements in the modeling of expenditure and recovery of AWC are needed. Ferguson’s study in [15] provides a starting point on which further studies can be built on. Ferguson’s study could be expanded across different recovery powers, however, there is a possibility that some of the tests could last for more than an hour (depending on the powers chosen for the exertion interval), which is undesirable. Incorporating a 3 min all-out intensity interval after the recovery interval instead of a constant work rate interval to exhaustion can address this. In addition to anaerobic work, the 3 min all-out interval yields a new CP (say CPn). This CPn can be compared to the CP determined earlier and the reliability of 3mAOT can be further studied. An experimental protocol incorporating a 3mAOT at the end of the recovery interval was developed to model both expenditure and reconstitution of AWC.
3. Materials and Methods
The experimental protocol was developed under the following assumptions:
- Exercise intensities below CP draw purely from aerobic stores and result in recharging of AWC, thus increasing the AWC balance.
- The recovery of AWC below CP is not equal to the expenditure of AWC above CP. The rate is a function of the level of power below CP and the time held at that power.
- The 3 min all-out test is robust and CP and AWC can be estimated accurately using the test.
- The power held during recovery interval is constant. The behavior of power versus time below CP is unknown, and hence the power below needs to be constant to mathematically model recovery of AWC.
The testing can be completed on a Lode Ergometer or a commercial cycling trainer like Racermate CompuTrainer. The experimental protocol requires 13 different visits to the laboratory comprising of 3 different tests (see Table 1). The familiarization trials are not considered for analysis. Each session is separated by at least 24 h to ensure complete recovery of AWC. Subjects are advised to eat a carbohydrate-rich meal 1 hour before the test and to refrain from Caffeine consumption 3 h before the test.
The intermittent cycling tests comprise of 3 intervals
- A 2 min exertion interval above CP,
- A recovery interval at different recovery powers (β) and recovery durations (trec), and
- A 3 min all-out intensity interval.
A 10 min warmup at 100 W precedes the first interval and a 5 min cool down at 20 W follows the third interval. The experimental design comprises of three recovery powers and three recovery durations (see Table 2). The recovery powers are same as the ones used by Skiba [16] and Chidnok [14], while the recovery durations (trec) are chosen from Ferguson and colleagues [15].
After the warm up, the programmed protocol (see Figure 1) is started on the Lode ergometer or the CompuTrainer. CP4 is the power at which a subject completely expends their AWC in 4 min. The subject is instructed to maintain their preferred cadence. In the last 5 s of the second interval, the subject is instructed to increase their cadence to 110 rpm. Positive encouragement is continued throughout test. The subject is instructed to cool down at 20 W for 5 min at the end. All test variations will be completed within a maximum duration of 35 min.
4. Discussion
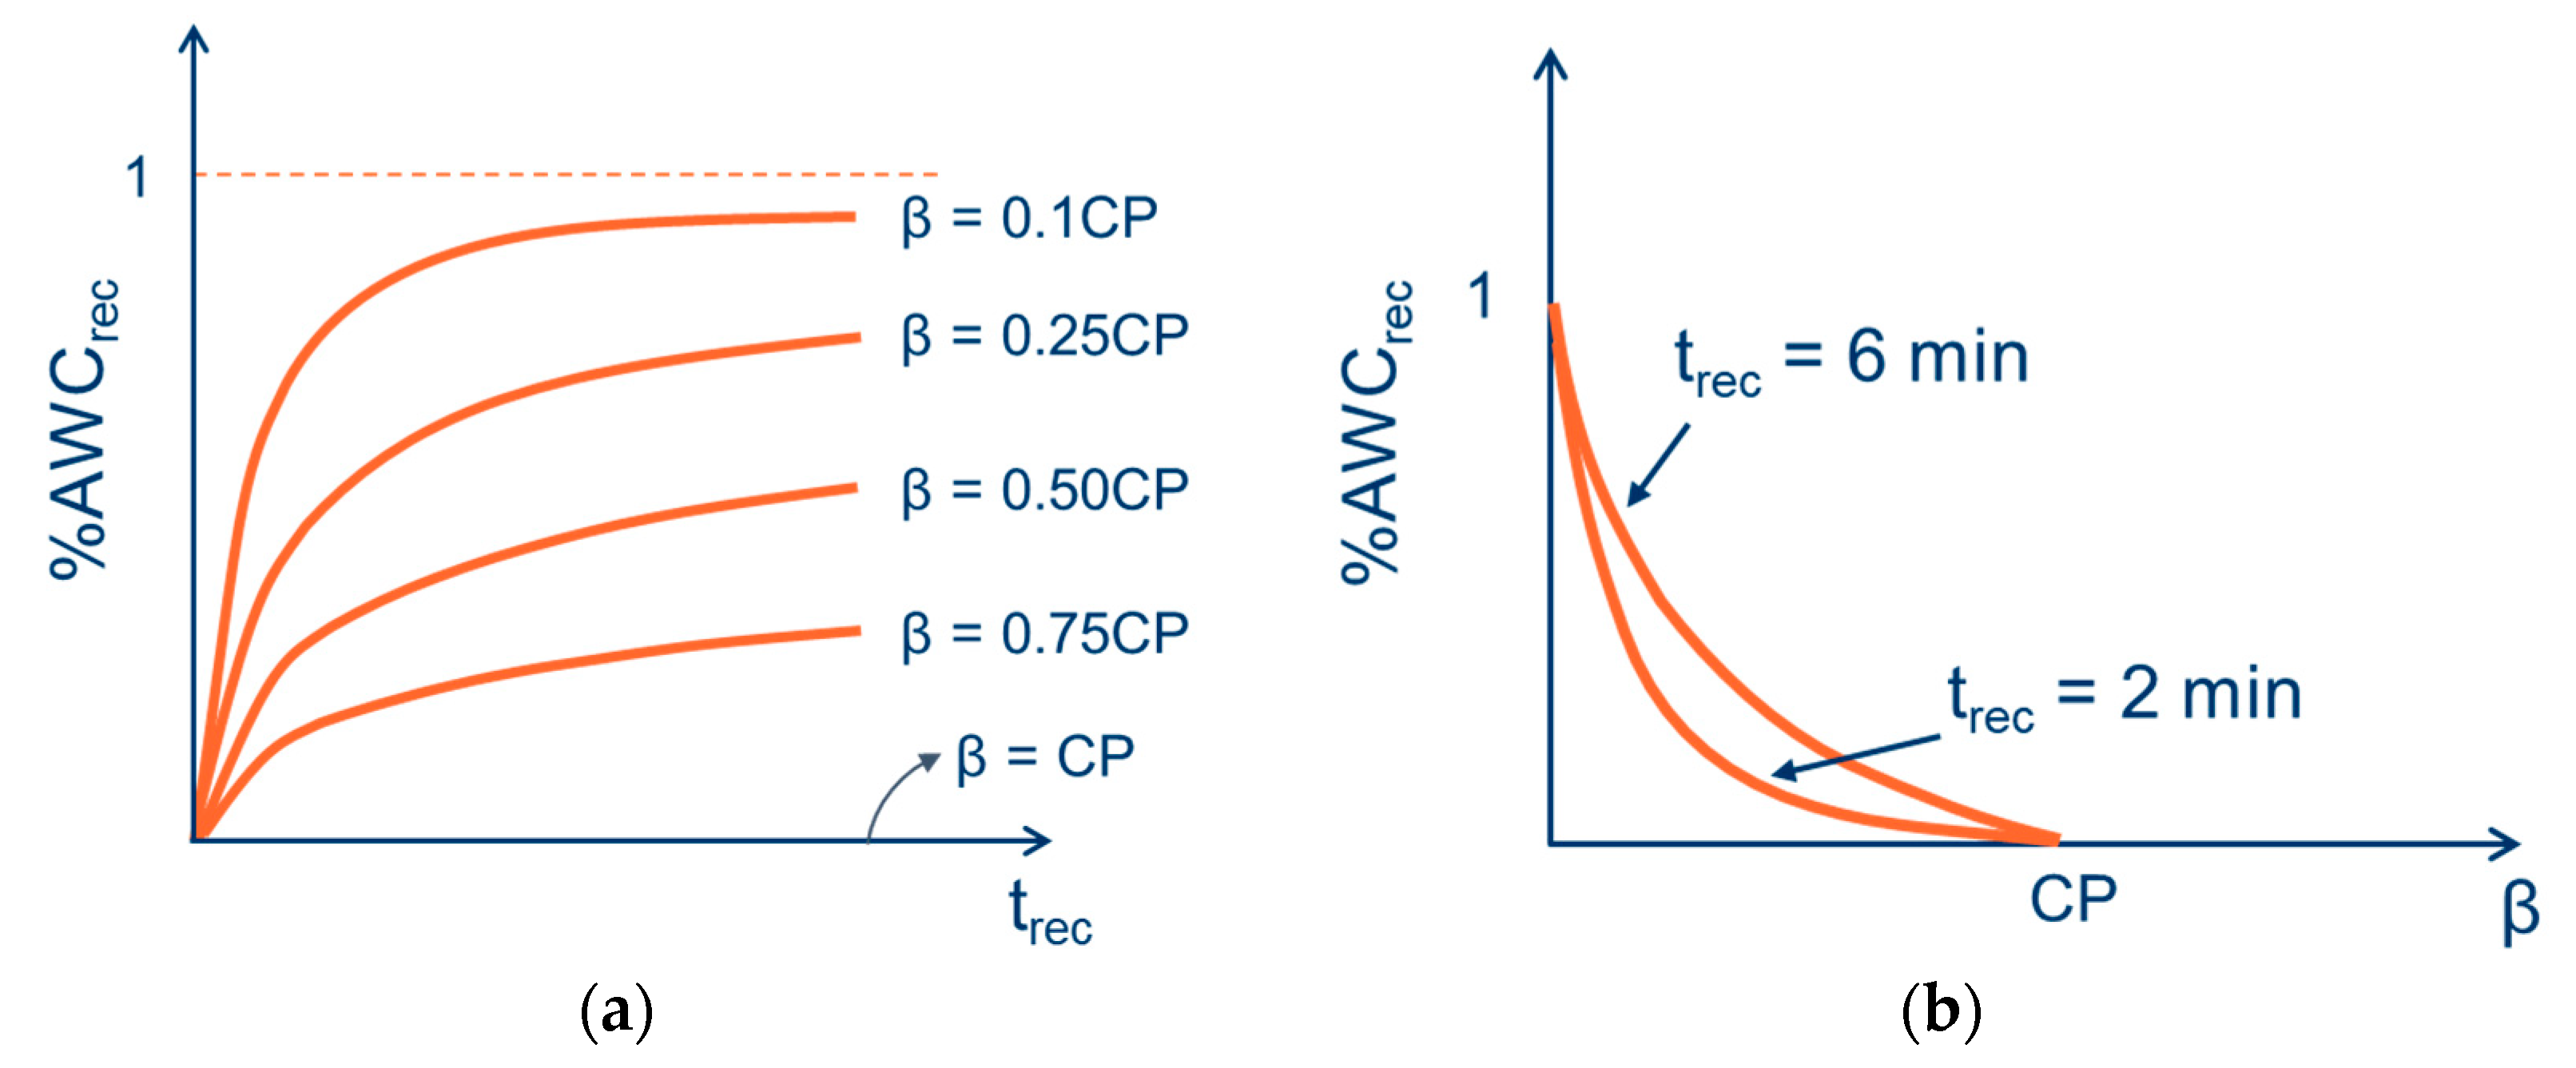
The presented protocol, though similar to that of Ferguson and colleagues in [15], will lead to complete profile of recovery powers instead of the sole recovery power of 20 Watts. Additionally, the third interval of the proposed protocol involves a 3mAOT instead of a constant power to exhaustion interval in [15]. The 3mAOT interval yields a new AWC, which when subtracted by the original AWC will result in the amount of AWC recovered due to the recovery interval. Percentage AWC recovered can then be plotted against recovery powers and recovery durations to study the recovery trends (see Figure 2).
Figure 2 illustrates that as β tends toward 0 all of AWC is recovered, while none is recovered when β is equal to CP. Figure 2b is similar to Skiba’s τW′ versus DCP curve in [16], however the %AWC recovered is plotted against recovery power instead of a time constant. By doing this, the integral causing imbalance of units seen in Equation (3) can be eliminated and the equation can be modified to reflect the difference between AWC and the amount of AWC expended given by,
where, AWCrem is the amount of AWC remaining, AWCexp is the amount of AWC expended while above CP, and AWCrec is the amount of AWC recovered due to the recovery interval below CP.
Figure 2a shows a trend similar to that seen by Ferguson and colleagues in [15]. The amount of AWiC recovered is a function of both recovery power and recovery times. The curves shown in Figure 2a need to be determined and the authors suspect that the trends will be different for different individuals. Additionally, the hypothesis is that the recovery power β will have a greater influence on the amount of AWC recovered.
The proposed protocol also serves as a reliability test for CP determined from the 3mAOT. Ideally, the average power of the last 30 s in the 3-min all-out exertion interval of the intermittent cycling protocol should be equal to the individual’s CP. The profile in Figure 2 is similar to a response surface with recovery power and recovery time as inputs. This surface would result in a specific amount of AWC recovered for a combination of β and trec. The response surface, once generated, can be used in an optimal control system to monitor and optimize performance in real time.
5. Conclusions and Future Work
Fatigue modeling has been a critical area in human physiology and sports engineering alike. The ability to predict fatigue would aid athletes, coaches, mission planners to be better equipped in races and missions. The CP concept provides an overall human body perspective and offers exciting opportunities to model fatigue. The expenditure of AWC above CP as estimated by the CP concept has been well established, whereas the recovery of AiWC below CP is still in its nascent stages. Researchers have attempted to address this gap laying a good foundation, but have not been successful thus far. This paper presents a new protocol to determine the behavior of recovery of AWC and aims at providing a response surface with recovery power and recovery duration as inputs. It is hypothesized that recovery power will have a greater influence on recovery of AWC than the recovery duration. The proposed protocol accommodates three different recovery powers and recovery times resulting in 9 different tests. Additionally, this paper proposes a simpler model for determining the amount of AWC remaining. The response surface for recovery of AWC will aid in optimizing performance by minimizing fatigue. Once a profile is established, an optimal control system can be designed to monitor and optimize performance in real time. The next steps include testing with human subjects to gather data and designing the optimal control system.
Acknowledgments
The study is internally funded. No funds were received for covering the costs to publish in open access.
Conflicts of Interest
The authors declare no conflict of interest.
References
- Rose, E.A.; Parfitt, G. A quantitative analysis and qualitative explanation of the individual differences in affective responses to prescribed and self-selected exercise intensities. J. Sport Exerc. Psychol. 2007, 29, 281–309. [Google Scholar] [CrossRef] [PubMed]
- Hall, E.E.; Ekkekakis, P.; Petruzzello, S.J. The affective beneficence of vigorous exercise revisited. Br. J. Health Psychol. 2002, 7, 47–66. [Google Scholar] [CrossRef]
- Welch, A.S.; Hulley, A.; Ferguson, C.; Beauchamp, M.R. Affective responses of inactive women to a maximal incremental exercise test: A test of the dual-mode model. Psychol. Sport Exerc. 2007, 8, 401–423. [Google Scholar] [CrossRef]
- Monod, H.; Scherrer, J. The Work Capacity of a Synergic Muscular Group. Ergonomics 1965, 329–338. [Google Scholar] [CrossRef]
- Morton, R.H. The critical power and related whole-body bioenergetic models. Eur. J. Appl. Physiol. 2006, 96, 339–354. [Google Scholar] [CrossRef] [PubMed]
- Hill, A.V. The Physiological Basis of Athletic Records. Nature 1925, 116, 544–548. [Google Scholar] [CrossRef]
- Gaesser, G.A.; Carnevale, T.J.; Alan, G.; Womack, C.J. Estimation of critical power with nonlinear and linear models. Med. Sci. Sports Exerc. 1995, 27, 1430–1438. [Google Scholar] [CrossRef] [PubMed]
- Bull, A.J.; Housh, T.J.; Johnson, G.O.; Perry, S.R. Effect of mathematical modeling on the estimation of critical power. Med. Sci. Sports Exerc. 2000, 32, 526–530. [Google Scholar] [CrossRef] [PubMed]
- Bergstrom, H.C.; Housh, T.J.; Zuniga, J.M.; Traylor, D.A.; Lewis, R.W., Jr.; Camic, C.L.; Schmidt, R.J.; Johnson, G.O. Differences Among Estimates of Critical Power and Anaerobic Work Capacity Derived From Five Mathematical Models and the Three-Minute All-Out Test. J. Strength Cond. Res. 2014, 28, 592–600. [Google Scholar] [CrossRef] [PubMed]
- Vanhatalo, A.; Doust, J.H.; Burnley, M. Determination of critical power using a 3-min all-out cycling test. Med. Sci. Sports Exerc. 2007, 39, 548–555. [Google Scholar] [CrossRef]
- Johnson, T.M.; Sexton, P.J.; Placek, A.M.; Murray, S.R.; Pettitt, R.W. Reliability analysis of the 3-min all-out exercise test for cycle ergometry. Med. Sci. Sports Exerc. 2011, 43, 2375–2380. [Google Scholar] [CrossRef] [PubMed]
- Vanhatalo, A.; Doust, J.H.; Burnley, M. Robustness of a 3 min all-out cycling test to manipulations of power profile and cadence in humans. Exp. Physiol. 2008, 93, 383–390. [Google Scholar] [CrossRef]
- Morton, R.H.; Billat, L.V. The critical power model for intermittent exercise. Eur. J. Appl. Physiol. 2004, 91, 303–307. [Google Scholar] [CrossRef]
- Chidnok, W.; Dimenna, F.J.; Bailey, S.J.; Vanhatalo, A.; Morton, R.H.; Wilkerson, D.P.; Jones, A.M. Exercise tolerance in intermittent cycling: Application of the critical power concept. Med. Sci. Sports Exerc. 2012, 44, 966–976. [Google Scholar] [CrossRef] [PubMed]
- Ferguson, C.; Rossiter, H.B.; Whipp, B.J.; Cathcart, A.J.; Murgatroyd, S.R.; Ward, S.A. Effect of recovery duration from prior exhaustive exercise on the parameters of the power-duration relationship. J. Appl. Physiol. 2010, 108, 866–874. [Google Scholar] [CrossRef] [PubMed]
- Skiba, P.F.; Chidnok, W.; Vanhatalo, A.; Jones, A.M. Modeling the Expenditure and Reconstitution of Work Capacity above Critical Power. Med. Sci. Sports Exerc. 2012, 44, 1526–1532. [Google Scholar] [CrossRef] [PubMed]
- Skiba, P.F.; Clarke, D.; Vanhatalo, A.; Jones, A.M. Validation of a novel intermittent w’model for cycling using field data. Int. J. Sports Physiol. Perform. 2014, 9, 900–904. [Google Scholar] [CrossRef]
- Skiba, P.F. The Kinetics of the Work Capacity above Critical Power. Ph.D. Thesis, University of Exeter, Exeter, UK, 2014. [Google Scholar]
Figure 1.
Intermittent cycling test protocol.
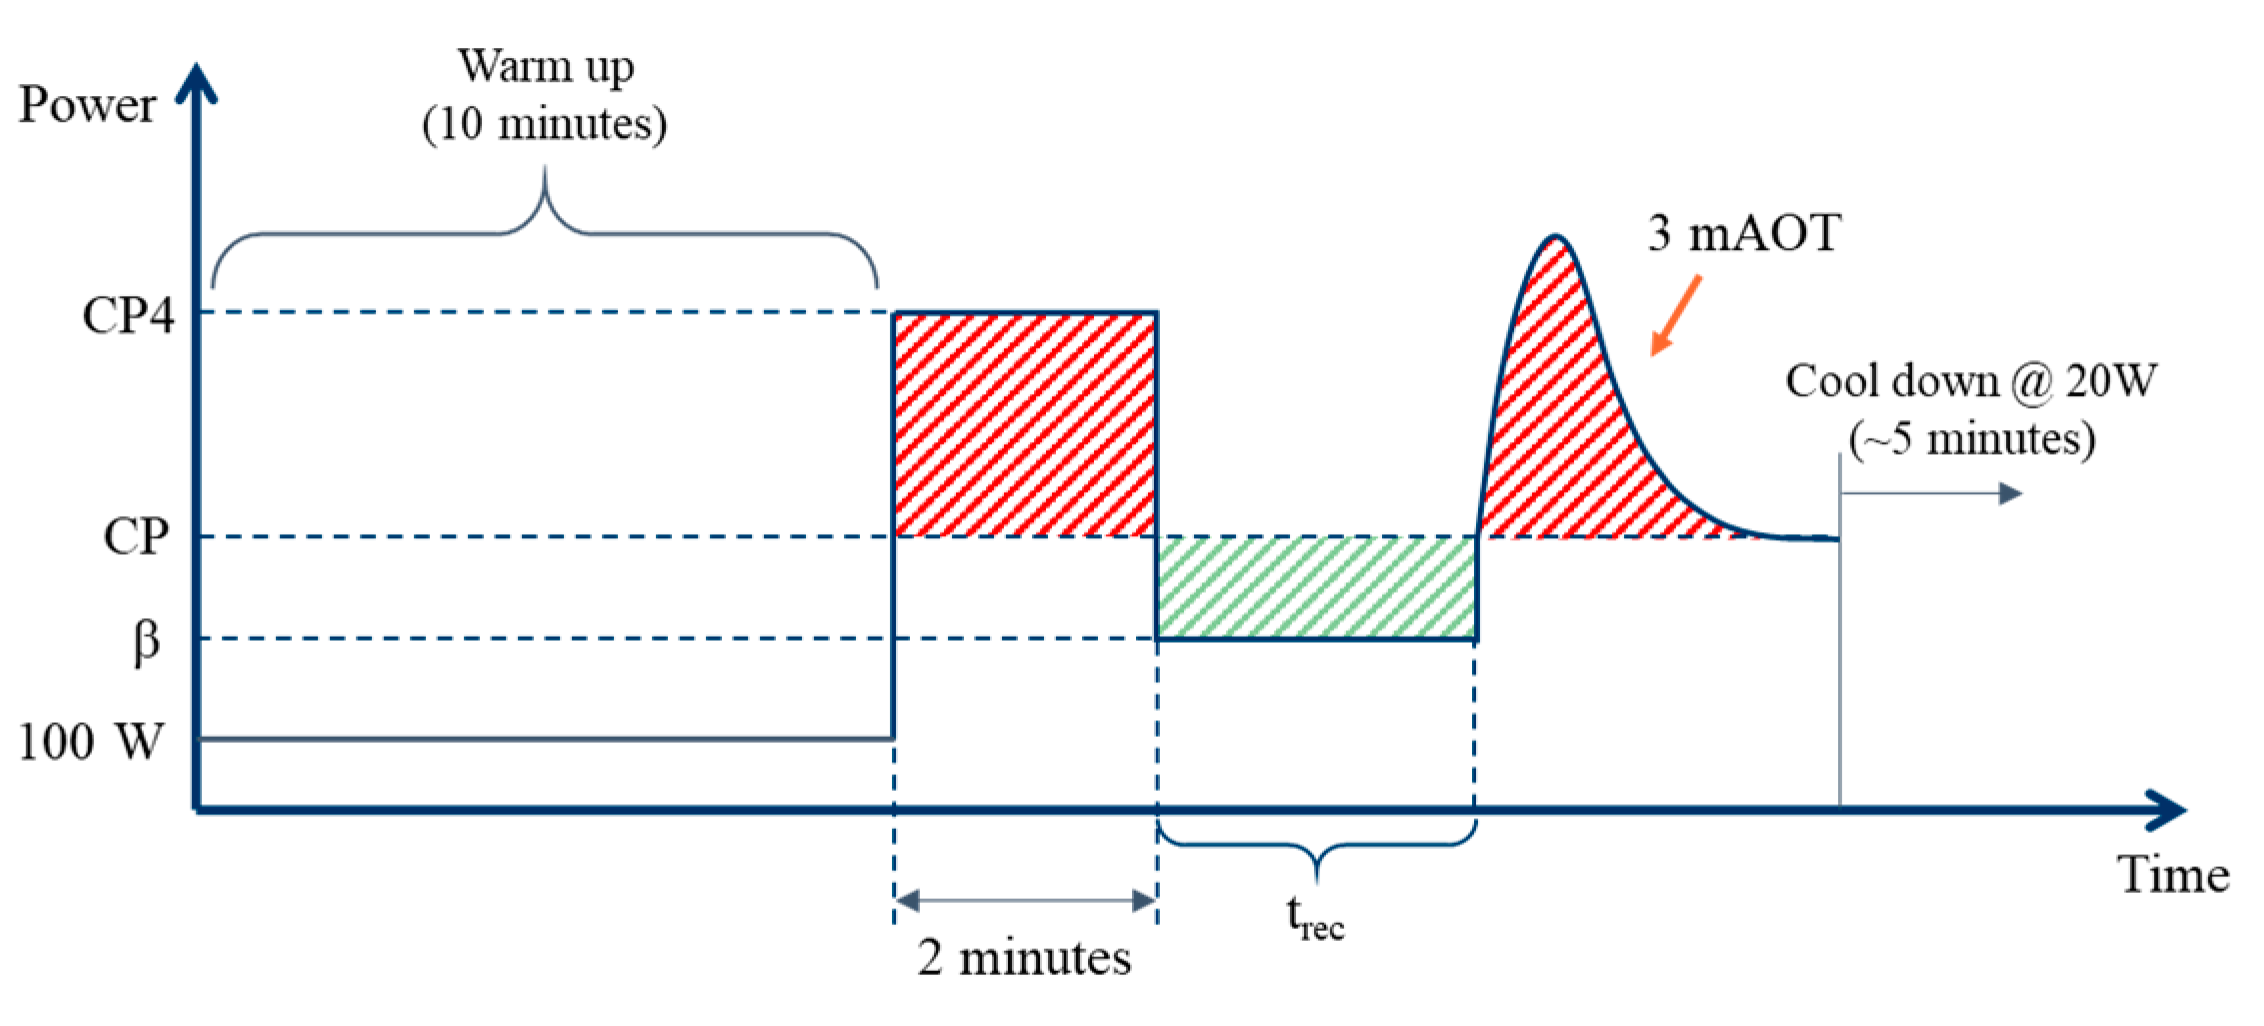
Figure 2.
Hypothesized model of %AWC recovered as a function of recovery power (β) and trec.

Table 1.
Day-wise testing plan.
| Session | Test |
|---|---|
| 1 | ramp test, Gas Exchange Threshold (GET) and 3mAOT familiarization |
| 2 | 3mAOT to determine the subject’s CP and AWC |
| 3 | 3mAOT repeatability test and Intermittent Cycling test familiarization |
| 4 | Intermittent cycling test-1 |
| 5 | Intermittent cycling test-1 repeatability |
| 6 | Intermittent cycling test-2 |
| 7 | Intermittent cycling test-3 |
| 8 | Intermittent cycling test-4 |
| 9 | Intermittent cycling test-5 |
| 10 | Intermittent cycling test-6 |
| 11 | Intermittent cycling test-7 |
| 12 | Intermittent cycling test-8 |
| 13 | Intermittent cycling test-9 |
Table 2.
Recovery powers and durations.
| Recovery Power, β (Watts) | Recovery Duration, trec (minutes) |
|---|---|
| 20 | 2 |
| 0.90 * PGET 1 | 6 |
| PGET + 0.5(CP-PGET) | 15 |
1 PGET is the power at Gas exchange threshold.
Publisher’s Note: MDPI stays neutral with regard to jurisdictional claims in published maps and institutional affiliations. |
© 2018 by the authors. Licensee MDPI, Basel, Switzerland. This article is an open access article distributed under the terms and conditions of the Creative Commons Attribution (CC BY) license (https://creativecommons.org/licenses/by/4.0/).
Share and Cite
MDPI and ACS Style
Sreedhara, V.S.M.; Mocko, G.M.; Hutchison, R.E. An Experimental Protocol to Model Recovery of Anaerobic Work Capacity. Proceedings 2018, 2, 208. https://doi.org/10.3390/proceedings2060208
AMA Style
Sreedhara VSM, Mocko GM, Hutchison RE. An Experimental Protocol to Model Recovery of Anaerobic Work Capacity. Proceedings. 2018; 2(6):208. https://doi.org/10.3390/proceedings2060208
Chicago/Turabian StyleSreedhara, Vijay Sarthy M., Gregory M. Mocko, and Randolph E. Hutchison. 2018. "An Experimental Protocol to Model Recovery of Anaerobic Work Capacity" Proceedings 2, no. 6: 208. https://doi.org/10.3390/proceedings2060208