Abstract
We detail the solution to the UCAmI Cup Challenge to recognizing on going activities at home from sensor measurements. We use binary sensors and proximity sensor measurements for the recognition. We use an hybrid strategy, combining a probabilistic model and a definition-based model. The former consists of a Hidden Markov Model using the result of a neural network as emission probabilities. It is trained with the labelled data provided by the Cup. The latter approach takes advantage of the descriptions provided for each of the activities which are expressed in logical statements based on the sensors states. We then combine the results with a weighted average. We compare the performance of each individual strategy and of the combined strategy.
1. Introduction
Automatic recognition of on-going activities at home is a stepping stone for enabling context-based services that adapt to the user’s current activity. Activity Recognition models have been roughly classified as data-driven and knowledge-driven [1]. Data-driven models are built by creating a probabilistic model that is then trained from past data of the user known activities. Knowledge driven approaches model common knowledge about how an activity is done in a formal representation such as description logic or ontologies. Reasoning is then used to classify the current activity of the user.
In this paper we detail our approach to the ’UCAmI Cup Challenge’. The goal of this challenge is to recognize the current activity of a user at home from 24 possible classes. A dataset with examples of activities and sensor measurements was provided by the Organizing Committee.
Dataset Description: The UJAmI Dataset for the UCAmI Cup (http://ceatic.ujaen.es/ujami/en/repository) contains 169 instances of 24 activity classes. One instance corresponds to one complete occurrence of the activity. Labelled activities for 7 days are provided in a non-continuous fashion. Each day has three continuous subsets: morning, afternoon and evening. Each subset has different duration. Of the 168 hours of the seven days, a total of 9.15 hours are provided. The data is segmented in non-overlapping 30 seconds windows, in total there are 1099 time windows. The challenge is to recognize the activity of the user in each time window.
We show in Table 1 a summary of the distribution of the activity classes. The number of instances (ins) corresponds to the total occurrences of the activity in the dataset. The duration (Dur.) shows the mean duration () of the activity and the standard deviation () of the duration. Notice that for activities with only one instance in the dataset, like Play Video Game we only show the duration of that instance since it is not possible to calculate a standard deviation. The column ’tw ins’ shows the number of time windows labelled with the corresponding class. Notice that activities with longer duration have a corresponding larger number of time windows. For example, while Prepare Breakfast has one more real instance than Prepare Lunch, it has only 53 time window instances, which is only half of the time windows instances of Prepare Lunch which has 104. Finally, some time windows do not correspond to any of the defined activity classes. This is called the NULL activity class. Since the dataset is not continuous, it has few instances of this class, only 44. The NULL class has no corresponding real instances because it is not considered an activity.

Table 1.
Summary of activity classes and their distribution in the dataset
The dataset contains 4 data sources. We used the binary sensor data and the proximity data. In the following sections we detail the activity recognition model used in our solution (Section 2), we summarize the validation and challenge results (Section 2), and finally we discuss our results (Section 2).
2. Activity Recognition Model
Our approach consists of an hybrid model that takes as input a feature vector and outputs the predicted activity label for time window from the set of defined activities }. We combine a probabilistic model and a knowledge-driven model using a weighted average approach (Equation (1)). We assign equal weights to each model (i.e., ).
To support multiple labels, the result is a vector where defines the probability of activity happening during time window t. The predicted activities are all the activities whose probability is greater than 1 over the total number of activities ().
For the probabilistic activity recognition model, we incorporate three lessons from previous studies. This model is detailed on Section 3. The lessons are: (1) to divide the day into shorter time periods and creating one model for each period results in better models [2], (2) the number of events for each sensor is a good baseline feature model for binary sensors when using time windows [3] and (3) to include temporal information like start time and duration into models can increase their accuracy [4].
We create three models corresponding to the time periods of the dataset. Some activities only occur in one period. For example, Prepare Breakfast and Breakfast only occur in the morning. Therefore the total number of classes is reduced. We don’t include start time information since the start times for each time period were very different. Since we don’t have information about this being the real waking hour of the user or a simulation of waking up when the data was collected, we preferred to ignore the start times.
For the knowledge based recognition model, we take advantage of the activity descriptions provided by the Organizers. This model is detailed in Section 4. We now move on to explain the details of each model.
3. Probabilistic Model
The probabilistic model is based on a Hidden Markov Chain. This model was implemented using Python, Pandas and the SciKit library. Each activity is represented by a state and transitions among states represent sequences of activities performed by the inhabitant. We use a neural network as emission probabilities for the Markov Chain and include the mean duration of activities.
Let us first define how we model the probability of staying in the same activity or changing to other activity. For each activity , its mean duration is calculated from the training data as was shown in Table 1, but expressed in terms of time windows. That is if the mean duration of the activity is 30 seconds, then . Let’s consider the user started activity at time window . The probability that the user is still doing the same activity at time window is given by a Poisson Distribution (Equation (2))
The term represents the time elapsed since the activity started. Thus, the probability of staying in the same activity falls as more time has passed. In the same way, the probability of changing from activity to activity is given by the probability of changing the current activity multiplied by the transition probability which is obtained from the frequencies in the training data using regularization. That is, when , is given by Equation (3)
Let us now consider the probability of doing activity a in time window t with (Equation (4)). is a -size vector representing the probability given by the neural network model and represents the transition probability from to a (Equation (3) if and Equation (2) if )
The position in the vector representing the result of the probabilistic model is the probability is given by Equation (5)
At time window , we use prior probabilities instead of transition probabilities. These are also obtained from the frequencies in the training data using regularization. Finally, we use the softmax function on vector to obtain the final probabilities.
Let us now explain the features in feature vector . A first set of features is made from the count of events in the time window for each binary sensor. We add one feature per beacon representing closeness to it. If during the time window, this feature was set to 1, and to 0 otherwise. The value was chosen based on the common equivalencies for RSSI which state at this level is “Good”. A more robust approach could have taken more advantage of proximity data, but due to time restrictions this simple rule of thumb was used. Finally, we include the last state of each contact or pressure sensor (0 or 1), the previous activity and (. For testing, the previous activity corresponds to the activity predicted by the model. A maximum of 72 features are used depending on the day period. This model has good performance on activities with large number of examples but can have poor performance on short duration activities. For example, it can not recognize Put washing or Visit.
4. Description-Based Activity Recognition Model
This model is based on the model checking approach presented in [5]. Based on the descriptions provided for each activity, different events were defined and combined as logical propositions to identify the start and end of each activity.
This model recognizes activities based on the current state of each sensor. We set all sensors to OFF 1 before processing each file because the initial state is unknown.
An example description for the Prepare Breakfast activity is shown in Listing 1. Its corresponding JAVA code is shown in Listing 2 with s an object holding all sensors’ state. Every time a sensor changes its state, all events are evaluated to identify whether any activity started or ended.
| Listing 1. Breakfast Activity Description |
| …involved the inhabitant going to the kitchen, taking some products for breakfast. … can involve: i) making a tea with kettle ii) making a hot chocolate with milk in the microwave. This activity involves placing things to eat in the dining room, but not sitting down to eat. |
| Listing 2. Prepare Meal Event (breakfast or lunch or dinner) |
| public Boolean get() { if (s.isInKitchen()) { wentKitchen = true; timestamp = s.getTimestamp(); } if (wentKitchen && !tookIngredients && !s.isInKitchen()) wentKitchen =false; if (s.isFoodContainerOpen()) tookIngredients = true; if (s.isHeating()) heat= true; if (!s.isPreparedMeal()&&wentKitchen && tookIngredients && heat) { s.setTimestamp (timestamp); if (s.isMorning()) s.setCurrentActivity(Activity.PREPARE_BREAKFAST); s.setPreparedMeal (true); return true; } if (wentKitchen && tookIngredients && !s.isInKitchen()) { wentKitchen = tookIngredients = heat =false; } return false; } |
Activities that benefit the most from the description model are Use toilet, Dressing, Take medicine, Leave, Put washing, notably short duration activities. Specially their recall went up when using this model. Not all activities have description models because some of them were difficult to express in logical language. We excluded the Wash Hands and Wash Dishes activities.
5. Validation of the Proposed Model
To validate our approach, we trained the probabilistic model using 6 of the seven days provided. The day ’15 November 2017’ was reserved as test data. We used a leave one day cross validation for model selection and then use the test data for model evaluation. We selected the parameters for hidden layer size and activation of the neural network using a grid search. The selected parameters for each day part model as well as the mean training accuracy and the test accuracy are shown in Table 2. We show in parentheses the accuracy of the probabilistic model without the description model. The afternoon model has the biggest improvement with respect to not using description model because it has more short duration activities. Precision and Recall measures for the combined and the probabilistic model per activity are shown in Figure 1.
Table 2.
Selected parameters and mean training accuracy using a leave-one-day out cross validation model selection.
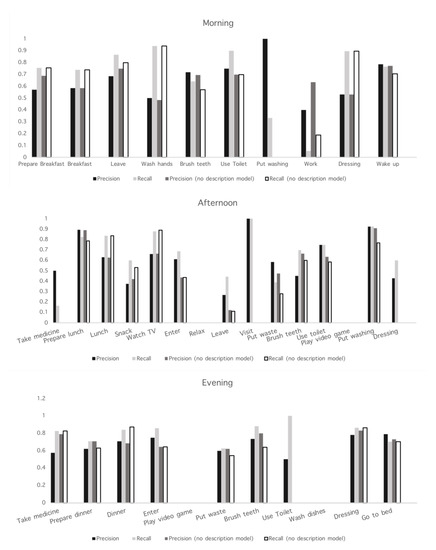
Figure 1.
Precision and Recall for each activity using the morning, afternoon and evening models.
The test data had 6 days and 545 time windows. The accuracy obtained in the cup was 45.0% which is lower than expected. The results for each activity are shown in Figure 2. The recall for Relax was low, only one instance was predicted as being from this class. This lowered the overall accuracy. Other activity with low recall is Work. This activity also had low recall in the training process so it was expected.
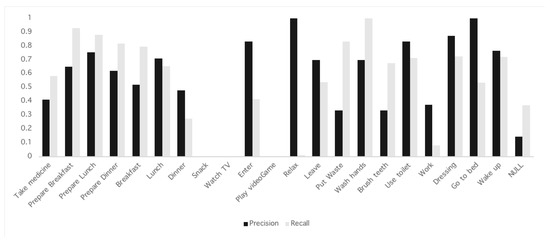
Figure 2.
Precision and Recall for each activity on the UCAMI Cup test data.
6. Discussion
6.1. On Model Selection
We decided to use a hybrid model to combine their strengths. The probabilistic model is robust and can handle uncertainty. On the contrary, for activities with a small number of examples, like Take medication or Visit, variations are small and a probabilistic model cannot learn well, it will most likely overfit to the small sample.
On the other hand, a description model can recognize activities of which it has not seen any examples before given a proper description. However, it is greatly affected by sensor errors. If a change of state event is missed, the model cannot update the state and the reasoning is misleading.
A combination of both methods can help in the adoption of services by reducing the need of labeling activities and enabling the introduction of new activities. Positive examples of each class can be gathered from the description based model and then be used to train the probabilistic model.
6.2. On the Results Obtained
We expected a better result based on our experiments. One main cause is the poor performance for Relax activity with only one correct prediction out of 104 true instances. The difference can be due to a change of the distribution of activities. While Relax represented only 3% of the training data, it represented 20% of the test data. Also, there were no Visit in the test data which had a high accuracy when the description model was added. Differences in duration also affect the classifier performance. We expected the description model to be able to handle such changes. Even if it recognized the start of Relax, the following windows were not correctly recognized.
6.3. Improvement Recommendations
To improve the probabilistic based model feature reduction techniques could have been used. This can lead to better accuracy. To improve the decision based model, a layer handling sensor errors can mitigate the reasoning problems. This model can also benefit from knowing the person state. In the Prepare Breakfast example, knowing if the person is standing or sitting can help in defining the end of the activity. Such state can be obtained from the accelerometer data.
Finally, a better combination of both methods can be used. One possible improvement is to find an optimal combination of the weights . Another improvement is to use a cascade combination (stacking) instead of the weighted approach. We believe this would have lead to better results by taking a smarter decision on when to use the description based model.
Conflicts of Interest
The authors declare no conflict of interest.
References
- Chen, L.; Hoey, J.; Nugent, C.D.; Cook, D.J.; Yu, Z. Sensor-Based Activity Recognition. IEEE Trans. Syst. Man Cybern. Part C (Appl. Rev.) 2012, 42, 790–808. [Google Scholar] [CrossRef]
- Monekosso, D.N.; Remagnino, P. Behavior Analysis for Assisted Living. IEEE Trans. Autom. Sci. Eng. 2010, 7, 879–886. [Google Scholar] [CrossRef]
- Krishnan, N.C.; Cook, D.J. Activity recognition on streaming sensor data. Pervasive Mob. Comput. 2014, 10, 138–154. [Google Scholar] [CrossRef] [PubMed]
- Zhang, S.; McClean, S.; Scotney, B.; Chaurasia, P.; Nugent, C. Using duration to learn activities of daily living in a smart home environment. In Proceedings of the 4th International ICST Conference on Pervasive Computing Technologies for Healthcare, Munchen, Germany, 22–25 March 2010. [Google Scholar]
- Lago, P.; Lang, F.; Roncancio, C.; Jiménez-Guarín, C.; Mateescu, R.; Bonnefond, N. The contextact@A4H real-life dataset of daily-living activities activity recognition using model checking. In Proceedings of the 10th International and Interdisciplinary Conference–CONTEXT 2017 LNAI, Paris, France, 20–23 June 2017; Volume 10257, pp. 175–188. [Google Scholar]
| 1 | or ’No pressure’ or ’Closed’ according to the sensor type |
Publisher’s Note: MDPI stays neutral with regard to jurisdictional claims in published maps and institutional affiliations. |
© 2018 by the authors. Licensee MDPI, Basel, Switzerland. This article is an open access article distributed under the terms and conditions of the Creative Commons Attribution (CC BY) license (https://creativecommons.org/licenses/by/4.0/).