Proceeding Paper

Multimodal Sensor Data Fusion for Activity Recognition Using Filtered Classifier †

1
Ubiquitous Computing Lab, Department of Computer Engineering, Kyung Hee University, Seocheon-dong, Giheung-gu, Yongin-si, Gyeonggi-do 446-701, Korea
2
School of Computing and Mathematics, Ulster University, Jordanstown BT37 0QB, Northern Ireland, UK
*
Author to whom correspondence should be addressed.
Presented at the 12th International Conference on Ubiquitous Computing and Ambient ‪Intelligence (UCAmI 2018), Punta Cana, Dominican Republic, 4–7 December 2018.‬‬‬‬‬‬‬‬‬‬
Proceedings 2018, 2(19), 1262; https://doi.org/10.3390/proceedings2191262
Published: 19 October 2018
(This article belongs to the Proceedings of UCAmI 2018)

Abstract

:
Activity recognition (AR) is a subtask in pervasive computing and context-aware systems, which presents the physical state of human in real-time. These systems offer a new dimension to the widely spread applications by fusing recognized activities obtained from the raw sensory data generated by the obtrusive as well as unobtrusive revolutionary digital technologies. In recent years, an exponential growth has been observed for AR technologies and much literature exists focusing on applying machine learning algorithms on obtrusive single modality sensor devices. However, University of Jaén Ambient Intelligence (UJAmI), a Smart Lab in Spain has initiated a 1st UCAmI Cup challenge by sharing aforementioned varieties of the sensory data in order to recognize the human activities in the smart environment. This paper presents the fusion, both at the feature level and decision level for multimodal sensors by preprocessing and predicting the activities within the context of training and test datasets. Though it achieves 94% accuracy for training data and 47% accuracy for test data. However, this study further evaluates post-confusion matrix also and draws a conclusion for various discrepancies such as imbalanced class distribution within the training and test dataset. Additionally, this study also highlights challenges associated with the datasets for which, could improve further analysis.

1. Introduction

In the past few decades, a rapid rise in the advancement of pervasive computing has been observed through gathering Activities of Daily Livings (ADLs). This is generally carried out in a controlled environment equipped with the inexpensive wireless sensors. A wide variety of applications are underpinned with state of the art machine learning algorithms for recognizing ADLs in smart environments.
In such environments, the real-world streaming dataset is almost of the same content as near-duplicates [1]. This leads to the noisy and imprecise state, causing an erroneous classification and recognition. On the other hand, it also becomes infeasible to perform comprehensive data cleaning step before the actual classification process. This study explores how to recognize activities based on the available sheer amount of discrete and continuous multimodal data.
In order to recognize the activities, time-based sub-window re-sampling techniques were adapted, as they keep a partial order in the multi-modal sensor data stream for recognizing each individual activity [2,3]. The sampling techniques [4] have widely been used to handle approximate results by accommodating the growing data size. These samples form a basis for statistical inference about the contents of the multimodal data streams [5]. As relatively little is currently known about sampling from the time-based window [6] and is still a nontrivial problem [7].
It is pertinent to mention that sampling becomes more challenging if the sensory data is of a highly dynamic nature [8] for the activity recognition models. Moreover, high data arrival rate can also suppress the robustness of such models as near-duplicate speeding data may get multiple re-asserts [9].
However, some research studies also suggest a compromise be made between efficient sampling rates for such dynamic nature [6].
As above mentioned factors affect the performance of Machine-Learned (ML) based activity recognition from multimodal sensory data sources thus appropriate aggregation strategy can lift the performance of the ADLs monitoring applications [10]. The selected aggregation strategy for data-level fusion determines the way in which multimodal data reach the fusion node [11]. At the fusion node, different ADLs can be best recognized by the selecting the appropriate fusion strategy with variable window lengths [12,13,14].
Current tendencies prove the acceptance of the high attention by sensing modalities for improving the recognition of ADLs performance and overall application robustness [15,16].
The need for taking up 1st UCAmI Cup challenge is, research using sensors such as those investigated in the UCAmI Cup is needed as most of the technologies nowadays are underscored by the elderly people, rising health care expenses, and importance of individual’s occupancy state. So associated activities might affect the functionality of daily life, thus recognizing ADLs from multimodal sensors for the smart home resident in a controlled environment is the primary motivation behind this challenge in smart environments.
This study involves evaluation of Human Activity Recognition (HAR) dataset shared by the University of Jaén’s Ambient Intelligence (UJAmI) Smart Lab for 1st UCAmI Cup challenge [17]. The UJAmI Smart Lab measures approximately 25 square meters, its measurements are 5.8 m long and 4.6 m wide. It is divided into five regions: entrance, kitchen, workplace, living room and a bedroom with an integrated bathroom. Following key objectives are being undertaken in this paper: (1) development and implementation of a methodology for transforming time series data into a feature vector for supervised learning. (2) training, testing, and evaluation for the feature vector using multi-filter based algorithms. (3) comparative analysis and challenge identification for deteriorating accuracy shared by 1st UCAmI Cup challenge confusion matrix. (4) a detailed discussion for unveiling the challenges associated with the shared training and test data.
The rest of this paper proceeds with an overview of the UJAmI Smart Lab dataset description, and challenge design in the Section 2. The summary of the results and discussion is presented in Section 3 followed by the conclusion and future work of the paper in Section 4.

2. Methodology

This paper deals with the recognition of a broad range of human activities, performed by a single participant under several routines for a few days in an interleaved manner. The detailed description of the UJAmI Smart Lab dataset is available on the website [18]. This dataset was shared under the caption of 1st UCAmI Cup with several characteristics and the challenges, which are discussed in subsequent sections. The proposed activity recognition framework is demonstrated in the Figure 1. The main components are listed as (a) sensor data acquisition; (b) preprocessing based on time-based sub-windowing and feature vector generation; (c) training and classification based on feature vectors; (d) classifying unknown test data and its evaluation.

2.1. Dataset Description

The multimodal dataset comprises of data collected over the period of 10 days. This dataset preserved different sensor functionalities: signal type varying from continuous to discrete; sampling frequency high, low and very low; sensor placement of the type wearable and non-wearable categories. However, the information related to the underlying sensor technologies and dataset collected is briefly discussed in the following sections:

2.1.1. Binary Sensor Event Streams

In this challenge, an event stream of 30 binary sensors (BinSens) is shared by UJAmI Smart Lab comprising of binary values along with the timestamps. These BinSens are the wireless magnetic sensor that works on the principles of Z-Wave protocol. For example ‘Medication Box’ in use is considered ‘Open’ and not in use will be ‘Close’. The inhabitant movement is monitored using the ‘PIR sensors’ working with underlying ZigBee protocol with the sample rate of 5 Hz. The binary values, in this case, are represented by ‘Movement’ or ‘No movement’. The sofas, chairs, and beds are equipped with the textile layer to observe the inhabitant pressure and transmits ‘Present’ or ‘No present’ binary values using the Z-Wave protocol. These BinSens gather information about the interaction with objects or sensors with a set of the associated activities. This interaction is relatively associated with the sparse BinSens streams, as it is defined by rapid firing for an event. While on the other hand, a pressure sensor stream can even last for minutes to hours, so this makes it challenging for handling the diversified streams.

2.1.2. Spatial Data

UJAmI Smart Lab has shared the SensFloor dataset generated by the suite of capacitance sensors beneath the floor. The SensFloor dataset has the description of eight sensor fields identified with an individual ID. The challenging part is that spatial data information is generated with different sample rate.

2.1.3. Proximity Data and Bluetooth Beacons

The Proximity data is provided for a set of 15 BLE beacons at 0.25 Hz sample rate by an android application installed on smart-watch. The BLE beacons are generated for the objects like TV controller, fridge, Laundry basket etc.

2.1.4. Acceleration Data

The physical activity frequency, ambulatory movements, and motion intensity are captured using an acceleration data stream which is gathered by the android application installed on smart-watch worn by the inhabitant. The accelerometer dataset is continuously generated at the 50 Hz sampling rate in the tri-orthogonal directions such as x, y, and z-axis.

2.2. UCAmI Cup Challenge Design

The 1st UCAmI Cup studies the problem of recognizing activities based on the shared UJAmI Smart Lab dataset for 24 activities in the smart-home environment as mentioned in Table 1. The total samples for each individual activity which was performed following several routines over the period of 7 days is plotted in Figure 2. Reflective of the real-world nature of the training dataset, the imbalance in the number of data samples for the different activities can be observed by observing the total duration for each individual performed activities. However, the challenging task is to map the pre-segmented training and test dataset from different sensor modalities having different sample rate. The challenge involves handling of missing values, identification mechanism to fill in the gaps since some sensors generate continuous streams while others discrete. So there is a need to devise an algorithm to handle more realistic and complex activity classification tasks.

Main Tasks

The main aim of this work was recognizing activities based on the test dataset, evaluating the results and identifying the challenges associated with the UJAmI Smart Lab dataset. The training dataset has been automatically cleaned and preprocessed for activity classification, which is further discussed in subsequent sections. The overall UJAmI Smart Lab dataset is categorised as follows:
  • Labelled training dataset with seven days of recordings that contained 169 instances followed by different daily life routines.
  • Unlabelled test dataset with three days of recordings that contained 77 instances obtained by following a set of daily life routines.

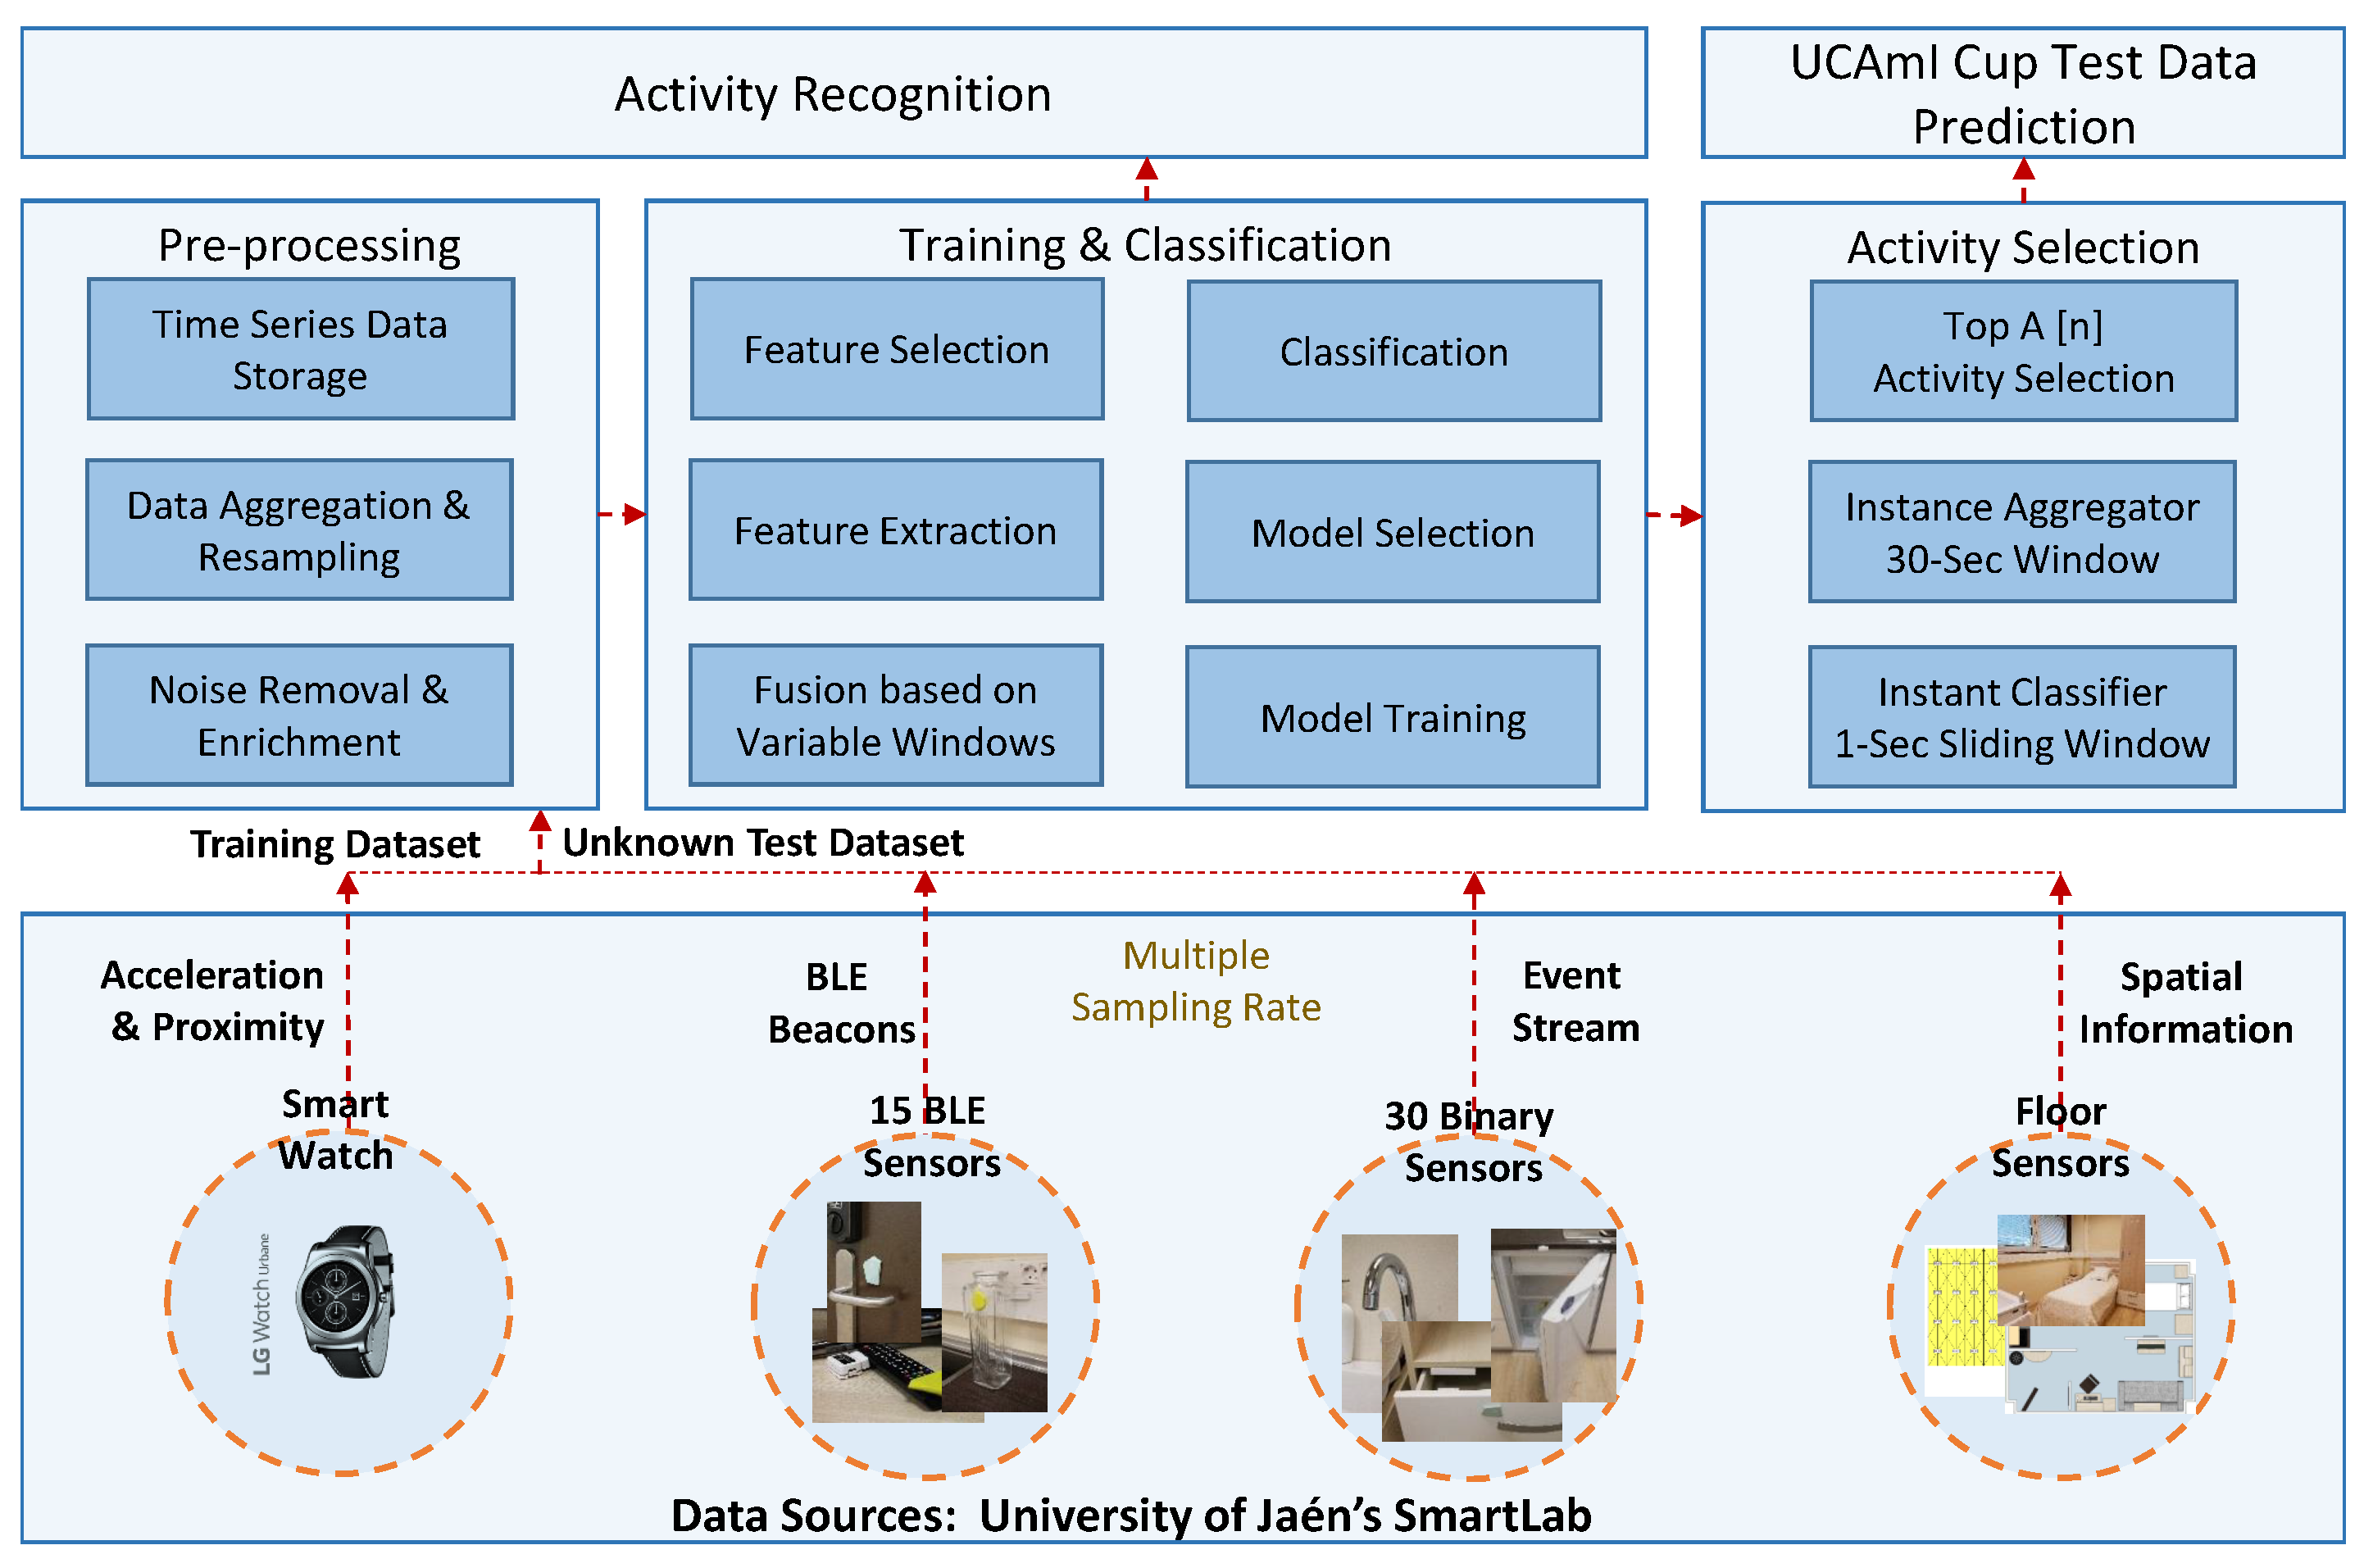
2.3. Activity Recognition Methods

As shown in Figure 1, the activity recognition framework is a sequence of data alignment, pre-processing, application of machine learning techniques, training of model based on the training dataset and classifying the test data.

2.3.1. Data Alignment & Mapping

UJAmI Smart Lab dataset corpus contains independently gathered data from multimodal sensors. For the main task, each of the sensor data was reordered into a set of 1-s window slot for the time-stamp coherence. In order to generate time-stamp, the Activity[n] (where n represents the number of activities performed for each time slot) was segmented based on DateBegin and DateEnd for over 1-s time window so that the rest of Sensors, Floor, Proximity and Acceleration dataset can be mapped based on timestamps. A sliding window segmentation technique [19] with the step size of 1-s was chosen in order to keep the maximum number of instances [20] and better performance [21]. The complete work-flow with details of the whole process of data alignment and mapping is presented in the proposed Algorithm 1.

2.3.2. Data Preprocessing

The accelerometer data consisted of instances at the rate of 50 Hz, which was preprocessed to filter out the unwanted noise and avoid the computational complexities. These were re-sampled by applying the commonly used time-domain statistical features, such as a mean filter for each of x, y, and z tri-orthogonal values over a duration of 1-s. After observing the Floor data, which was also generated at a variable rate, was re-sampled within the duration of a 1-s window. In this case, the method considered was to take the mean for floor capacitances and also at the same time, to keep the characteristics intact for individual data generating sensing device, identified by the device ID.

2.3.3. Experimental Implementation

Processing of the data was performed using dedicated software written in Python 3.6 [22], specifically for this UJAmI Smart Lab dataset evaluation. Firstly, the training sensor data (Activity, Acceleration, Proximity, Floor and Sensors) was aligned based on the time-stamps. Secondly, the complete dataset was stored in tables using an open-source relational database management system [23]. Thirdly, the feature vector was created based on the training and test instances. Whereas based on the training dataset, a model was created using Weka tool [24], afterwards each of the instances in the test dataset was classified and lastly an aggregation function was applied to meet the desired output required by the UCAmI Cup challenge over an equal duration of the time window of 30 s. The classification was performed over a 1-s window instance whereas an aggregation function of a maximum count was applied in order to process the set of activities within the 30-s window as a requirement for the UCAmI cup challenge.
Algorithm 1: Data alignment and re-sampling algorithm for UJAmI Smart Lab dataset (D)
Proceedings 02 01262 i001

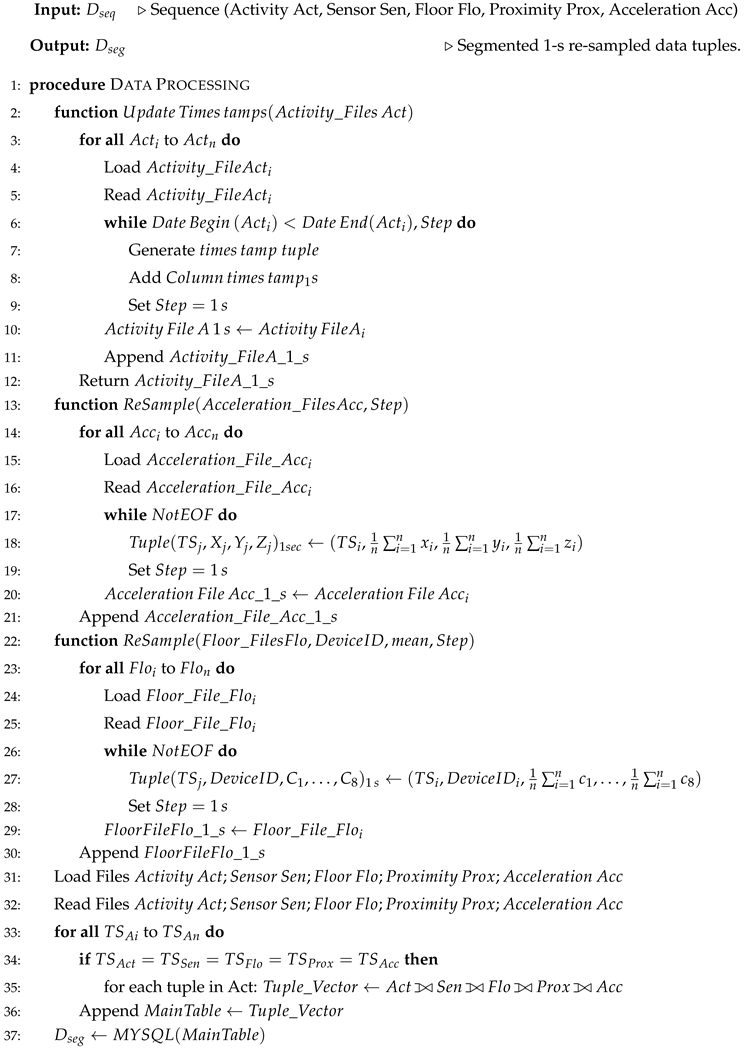
2.3.4. Classification

The UCAmI Cup challenge was designed with the split of a shared dataset into a training and a test set. The training dataset, consisted of 7 days of the full dataset, this was used to develop the model, while the test dataset consisted of the remaining 3 days test dataset, which was used for model evaluation and validation. The partitioning between training and testing data was carried out using random stratification to ensure that the ratios of the three main activities (walking, standing and lying) remained the same in both datasets. [25] The UJAmI Smart Lab training dataset, comprising of 7 days, was used to obtain a model while the test dataset consisting of a given test dataset was configured using the FilteredClassifier with the default StringToWordVector filter and with the chosen base classifier as Random Forest. As we had to perform testing, so test and train datasets were processed through FilteredClassifier by ensuring their compatibility and keeping their vocabulary consistent. We used 10-fold cross-validation technique on dataset to produce a stable model [26] having a confusion matrix as shown in the Figure 3. This model was used to predict the class for test instances. The test instances also had the same structure i.e., the same string attributes type and class. The class values of the test instances were set to the missing value in the file (e.g. ’?’).

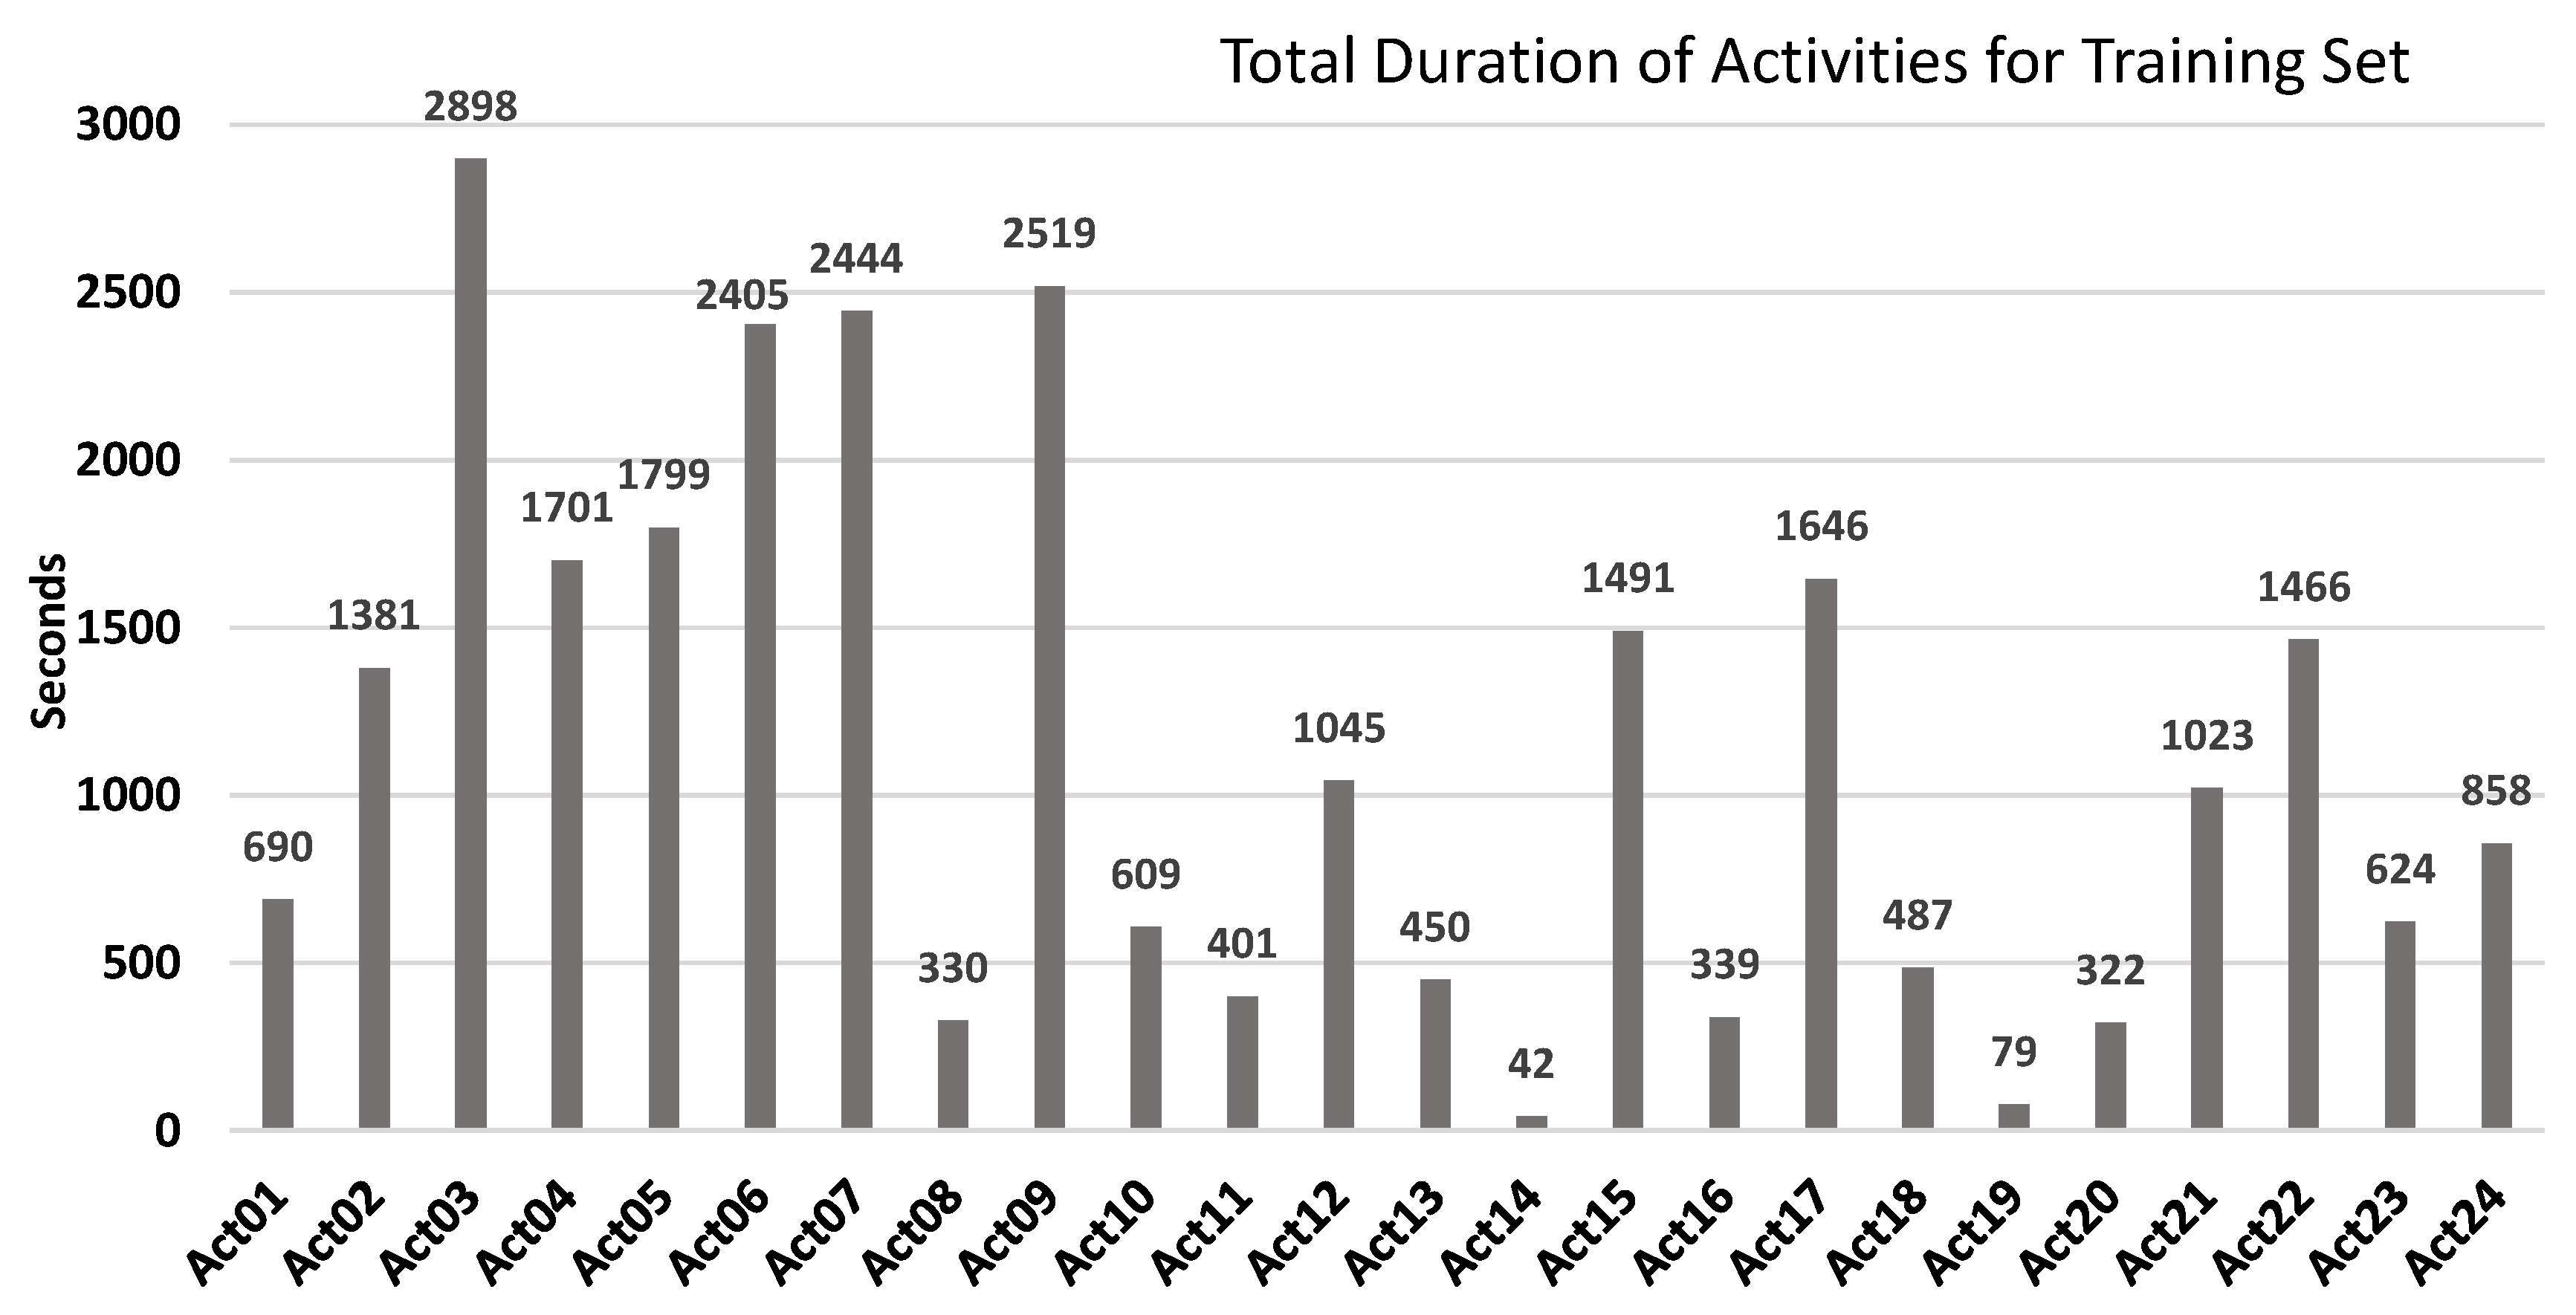
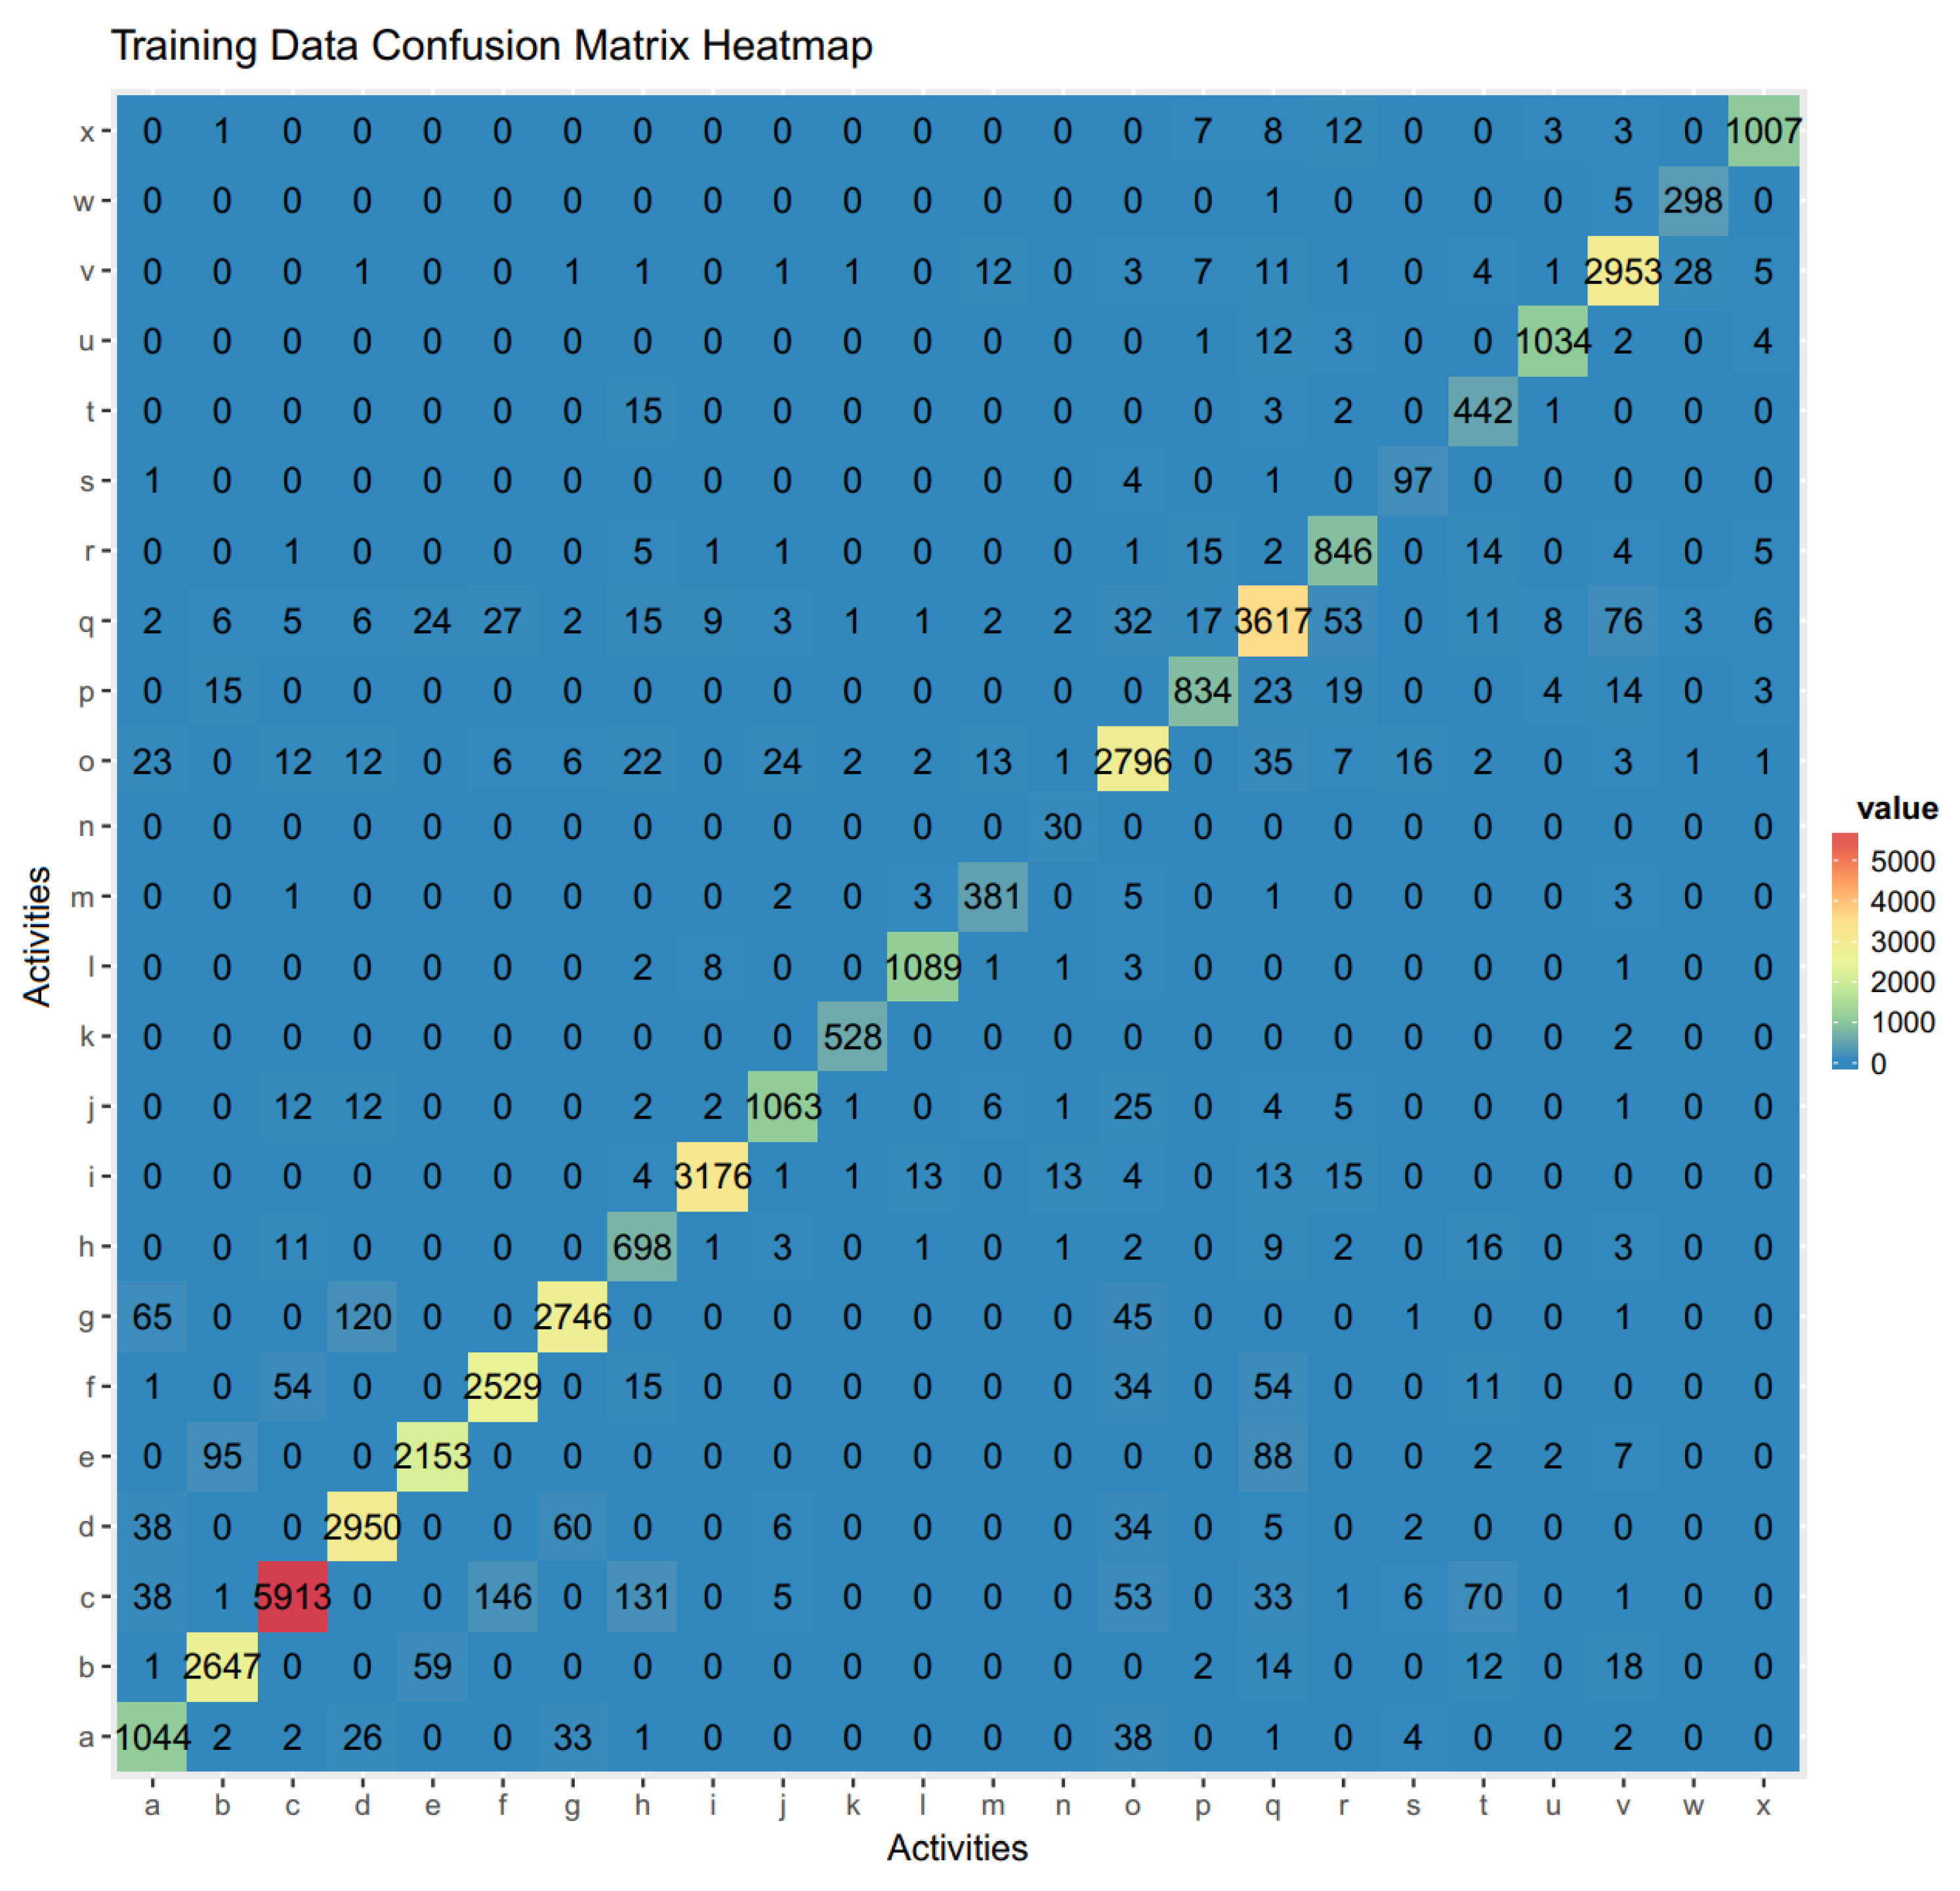
3. Results and Discussion

This section presents and discusses the results obtained from re-sampling techniques, feature selection methods, and learning algorithms applied to the dataset. To precisely assess the performance evaluation and model comparison, several performance measures, such as accuracy, true positive rate, false positive rate, and F-measure, were used. Likewise, for a given window size of 30 s obtained through aggregation function with underlying classification performed over the 1-s window.

Performance Evaluation

Figure 3 shows the confusion matrix heat-map of each activity for the trained model, which was obtained by using the Random Forest classifier for the training dataset with the selected features. The confusion matrix illustrated that the activity ‘Act03’ i.e., ‘Prepare lunch’ was most often classified as ‘Act06’ i.e., ‘Lunch’, similarly other activities can be observed in the heat-map. The overall accuracy of 94% was achieved with a mean absolute error of 0.0136. However, the accuracy of the test data was dropped to 47%. The time span of all the activities mentioned in the test dataset can be seen in Figure 4. It shows that during 3 days of the test dataset, ‘Act12’ i.e., ‘Relax on the sofa’ was performed the most whereas ‘Act14’ i.e., ‘Visit in the SmartLab’ has less duration as it only marks the entrance. A comparison for the imbalanced state of the training and test data can be visualized in the Figure 2 and Figure 4. The performance of the random forest classification was evaluated using the following metrics: overall accuracy, precision, recall (also known as sensitivity), F-score, and specificity. The precision, recall, and F-measure for the training dataset is mentioned in the Figure 5.
Figure 6 shows the class prediction of the methodology presented in this paper and the confusion matrix from the UCAmI Cup challenge organizing team. It was very clearly observed that the activities ‘Act09’ i.e., ‘Watch TV’, ‘Act11’ i.e., ‘Play a videogame’ were misclassified against the activity ‘Act12’ i.e., ‘Relax on the sofa’. This shows that these activities involve the ‘sofa’ object, so continuous stream of ‘sofa’ object has dominated the classification by ignoring the signal discreteness for the object involved in ‘Act09’ and ‘Act11’.

4. Conclusions and Future Work

UJAmI Smart Lab initiated the tradition of Activity Recognition (AR) by providing a multi-modal sensor dataset collected from wearable and non-wearable devices in the smart environment. The training data, test data, evaluation matrix, and post-evaluation findings will remain available and open to the research community online. The obtained results and the provided evaluation matrix suggest and facilitate comparisons between actual activities in test data and predicted activities. Analysis of the performance on the classified activities set and the mismatched activities set suggests that there still appears to be limitations on aggregation while processing activities within the 30-s window. The results also provide intuition that there are limitations in exploiting correlations between the individual or group of features while considering the whole dataset. Features extracted from sensor data contained missing information, preprocessing might have added redundant and irrelevant information, which may have affected the overall classification performance negatively. In order to identify a subset of the most discriminative features that can increase the classification performance, as well as remove the redundant features that contribute no additional information to the classifier, it is essential to apply an effective feature selection method. In addition, with the discriminative features and balanced class distribution, the transitional activities can be classified correctly, which are often ignored in current research. This is particularly important for the application of AR in real time. We will consider multimodal sensor streams to better differentiate between similar activities. Future work should also verify improvements in AR based on individual sensor input. Impact of data reachability to the fusion node in multimodal sensor environment for AR. Lastly, there is also a need for categorizing sub-activities rather than assigning same labels to similar activities or likely to be similar.

Author Contributions

All the authors contributed equally to this work. All authors have read and agreed to the published version of the manuscript.

Acknowledgments

This research was supported by the MSIT (Ministry of Science and ICT), Korea, under the ITRC (Information Technology Research Center) support program (IITP-2017-0-01629) supervised by the IITP (Institute for Information & communications Technology Promotion) by Institute for Information & communications Technology Promotion (IITP) grant funded by the Korea government (MSIT) (No. 2017-0-00655) and NRF-2016K1A3A7A03951968. This work was also supported by the REMIND project, which has received funding from the European Union’s Horizon 2020 research and innovation programme under the Marie Skłodowska-Curie grant agreement No. 734355.

Conflicts of Interest

The authors declare no conflict of interest.

Abbreviations

The following abbreviations are used in this manuscript:
ADLActivities of Daily Living
ARActivity Recognition
UJAmIUniversity of Jaén Ambient Intelligence
MLMachine-Learned

References

  1. Chen, J.; Zhang, Q. Distinct Sampling on Streaming Data with Near-Duplicates. In Proceedings of the 35th ACM SIGMOD-SIGACT-SIGAI Symposium on Principles of Database Systems, Houston, TX, USA, 10–15 June 2018; pp. 369–382. [Google Scholar]
  2. Espinilla, M.; Medina, J.; Hallberg, J.; Nugent, C. A new approach based on temporal sub-windows for online sensor-based activity recognition. J. Ambient Intell. Humaniz. Comput. 2018, 1–13. [Google Scholar] [CrossRef]
  3. Fahim, M.; Baker, T.; Khattak, A.M.; Shah, B.; Aleem, S.; Chow, F. Context Mining of Sedentary Behaviour for Promoting Self-Awareness Using a Smartphone. Sensors 2018, 18, 874. [Google Scholar] [CrossRef] [PubMed]
  4. Song, G.; Qu, W.; Liu, X.; Wang, X. Approximate Calculation of Window Aggregate Functions via Global Random Sample. Data Sci. Eng. 2018, 3, 40–51. [Google Scholar] [CrossRef]
  5. Haas, P.J. Data-stream sampling: Basic techniques and results. In Data Stream Management; Springer: Berlin, Germany, 2016; pp. 13–44. [Google Scholar]
  6. Yamansavaşçılar, B.; Güvensan, M.A. Activity recognition on smartphones: Efficient sampling rates and window sizes. In Proceedings of the 2016 IEEE International Conference on IEEE Pervasive Computing and Communication Workshops (PerCom Workshops), Sydney, Australia, 14–18 March 2016; pp. 1–6. [Google Scholar]
  7. Braverman, V.; Ostrovsky, R.; Zaniolo, C. Optimal sampling from sliding windows. J. Comput. Syst. Sci. 2012, 78, 260–272. [Google Scholar] [CrossRef]
  8. Wu, K.L.; Xia, Y. Adaptive Sampling Schemes for Clustering Streaming Graphs. U.S. Patent 9,886,521, 6 February 2018. [Google Scholar]
  9. Hentschel, B.; Haas, P.J.; Tian, Y. Temporally-Biased Sampling for Online Model Management. arXiv 2018, arXiv:1801.09709. [Google Scholar] [CrossRef]
  10. Gravina, R.; Alinia, P.; Ghasemzadeh, H.; Fortino, G. Multi-sensor fusion in body sensor networks: State-of-the-art and research challenges. Inf. Fusion 2017, 35, 68–80. [Google Scholar] [CrossRef]
  11. Tschumitschew, K.; Klawonn, F. Effects of drift and noise on the optimal sliding window size for data stream regression models. Commun. Stat.-Theory Methods 2017, 46, 5109–5132. [Google Scholar] [CrossRef]
  12. Krishnan, N.C.; Cook, D.J. Activity recognition on streaming sensor data. Pervasive Mob. Comput. 2014, 10, 138–154. [Google Scholar] [CrossRef] [PubMed]
  13. Figo, D.; Diniz, P.C.; Ferreira, D.R.; Cardoso, J.M. Preprocessing techniques for context recognition from accelerometer data. Pers. Ubiquitous Comput. 2010, 14, 645–662. [Google Scholar] [CrossRef]
  14. Razzaq, M.A.; Villalonga, C.; Lee, S.; Akhtar, U.; Ali, M.; Kim, E.S.; Khattak, A.M.; Seung, H.; Hur, T.; Bang, J.; et al. mlCAF: Multi-Level Cross-Domain Semantic Context Fusioning for Behavior Identification. Sensors 2017, 17, 2433. [Google Scholar] [CrossRef] [PubMed]
  15. Banos, O.; Galvez, J.M.; Damas, M.; Pomares, H.; Rojas, I. Window size impact in human activity recognition. Sensors 2014, 14, 6474–6499. [Google Scholar] [CrossRef] [PubMed]
  16. Lai, X.; Liu, Q.; Wei, X.; Wang, W.; Zhou, G.; Han, G. A survey of body sensor networks. Sensors 2013, 13, 5406–5447. [Google Scholar] [CrossRef] [PubMed]
  17. UJAmI. Available online: http://ceatic.ujaen.es/ujami/sites/default/files/2018-07/UCAmI20Cup.zip (accessed on 11 September 2018).
  18. UCAmI Cup 2018. Available online: http://mamilab.esi.uclm.es/ucami2018/UCAmICup.html (accessed on 11 September 2018).
  19. Bulling, A.; Blanke, U.; Schiele, B. A tutorial on human activity recognition using body-worn inertial sensors. ACM Comput. Surv. (CSUR) 2014, 46, 33. [Google Scholar] [CrossRef]
  20. Yang, J.; Nguyen, M.N.; San, P.P.; Li, X.; Krishnaswamy, S. Deep Convolutional Neural Networks on Multichannel Time Series for Human Activity Recognition. In Proceedings of the Twenty-Fourth International Joint Conference on Artificial Intelligence (IJCAI 2015), Buenos Aires, Argentina, 25–31 July 2015; Volume 15, pp. 3995–4001. [Google Scholar]
  21. Dernbach, S.; Das, B.; Krishnan, N.C.; Thomas, B.L.; Cook, D.J. Simple and complex activity recognition through smart phones. In Proceedings of the 2012 8th International Conference on Intelligent Environments (IE), Guanajuato, Mexico, 26–29 June 2012; pp. 214–221. [Google Scholar]
  22. Python. Available online: https://www.python.org/ (accessed on 11 September 2018).
  23. MySQL. Available online: https://www.mysql.com/ (accessed on 11 September 2018).
  24. Weka. Available online: https://www.cs.waikato.ac.nz/ml/weka/ (accessed on 11 September 2018).
  25. Walton, E.; Casey, C.; Mitsch, J.; Vázquez-Diosdado, J.A.; Yan, J.; Dottorini, T.; Ellis, K.A.; Winterlich, A.; Kaler, J. Evaluation of sampling frequency, window size and sensor position for classification of sheep behaviour. R. Soc. Open Sci. 2018, 5, 171442. [Google Scholar] [CrossRef] [PubMed]
  26. Van der Gaag, M.; Hoffman, T.; Remijsen, M.; Hijman, R.; de Haan, L.; van Meijel, B.; van Harten, P.N.; Valmaggia, L.; De Hert, M.; Cuijpers, A.; et al. The five-factor model of the Positive and Negative Syndrome Scale II: A ten-fold cross-validation of a revised model. Schizophr. R. 2006, 85, 280–287. [Google Scholar] [CrossRef] [PubMed]
Figure 1. Proposed framework for Activity recognition using UJAmI Smart Lab dataset.
Proceedings 02 01262 g001
Figure 2. Life-time for the individual activities for UJAmI Smart Lab Training dataset.
Proceedings 02 01262 g002
Figure 3. a = Act01, b = Act02, c = Act03, d = Act04, e = Act05, f = Act06, g = Act07, h = Act08, i = Act09, j = Act10, k = Act11, l = Act12, m = Act13, n = Act14, o = Act15, p = Act16, q = Act17, r = Act18, s = Act19, t = Act20, u = Act21, v = Act22, w = Act23, x = Act24.
Proceedings 02 01262 g003
Figure 4. Life-time for the individual activities for UJAmI Smart Lab Test dataset.
Proceedings 02 01262 g004
Figure 5. Evaluation for the Training dataset.
Proceedings 02 01262 g005
Figure 6. Prediction vs Actual activities in the test dataset.
Proceedings 02 01262 g006
Table 1. List of activities recorded in the UJAmI Smart Lab Training and Test dataset.
IDActivity NameIDActivity NameIDActivity Name
Act01Take medicationAct09Watch TVAct17Brush teeth
Act02Prepare breakfastAct10Enter the SmartLabAct18Use the toilet
Act03Prepare lunchAct11Play a videogameAct19Wash dishes
Act04Prepare dinnerAct12Relax on the sofaAct20Put washing into the washing machine
Act05BreakfastAct13Leave the SmarLabAct21Work at the table
Act06LunchAct14Visit in the SmartLabAct22Dressing
Act07DinnerAct15Put waste in the binAct23Go to the bed
Act08Eat a snackAct16Wash handsAct24Wake up
Publisher’s Note: MDPI stays neutral with regard to jurisdictional claims in published maps and institutional affiliations.

