Proceeding Paper

Flood Early Warning System by Twitter Using LoRa †

by
Ernesto Leon
,
Cristian Alberoni
,
Miguel Wister
* and
Jose A. Hernández-Nolasco
*
Juarez Autonomous University of Tabasco, Carr. Cunduacan-Jalpa Km. 0.5, C.P. 86690 Cunduacan, Tabasco, Mexico
*
Authors to whom correspondence should be addressed.
Presented at the 12th International Conference on Ubiquitous Computing and Ambient Intelligence (UCAmI 2018), Punta Cana, Dominican Republic, 4–7 December 2018.
These authors contributed equally to this work.
Proceedings 2018, 2(19), 1213; https://doi.org/10.3390/proceedings2191213
Published: 24 October 2018
(This article belongs to the Proceedings of UCAmI 2018)

Abstract

:
In this paper, a sensor network architecture is presented. This work proposes an early warning system for river overflows. The sensor network consists of a river level sensor node that measures the distance between the sensor and the mass of water using a precision ultrasonic sensor. The recorded information is transmitted to a receiving node by radio frequency (915 MHz) using LoRa modulation. The receiving node is implemented in a Raspberry Pi, it processes the information in real time and publishes the alert using a social network (Twitter). Finally, a prototype of the river level node was tested, obtaining a measurement range from 20 cm to 2 m. The receiving node was located 500 m away from the sensor node, that received the data packets sent without loss of data.

1. Introduction

Natural disasters are catastrophic events that can occur anywhere in the world, which are presented in different ways such as floods, earthquakes, storms, etc. These events derive from variations of natural phenomena such as rain, wind, temperature, among others.
Tabasco is a southern province in Mexico, it is a plain located near to Yucatan’s Peninsula. The topological and hydrological conditions make the State of Tabasco an area with a high risk of flooding with antecedents such as occurred in 2007 that affected more than a one million people (http://www.unicef.org/infobycountry/mexico_41652.html). It is important to have an early flood warning system for the region that allows the inhabitants to be informed quickly and efficiently.
An Early Warning System (EWS) of river overflow is composed of sensor nodes distributed along rivers, which measure the water level constantly and are able to communicate this information for analysis, decision making and alerts.
Lora communication: it is a technology that works in the Industrial, Scientific and Medical (ISM) band. Frequency assignment and regulatory requirements for ISM vary by region. In the region of Mexico, 915 MHz is used, since it is the one assigned to the American continent, this technology is functional for projects that require the transmission of data over distances that are somewhat distant since they have a transmission range of 15 km between the node [1].

2. Related Works

Our development of the EWS prototype is based on two previous works, the first one is [2], they proposed an architecture consisting of an access point t D-LINK Dir-600, 3 LEDs in three different colors: green, yellow; and red simulating a traffic light which would mean that green color is acceptable water level, the yellow one is a considerable level and the red one would be the top of the container, this warning by means of LEDs this action is one of the outputs of the system. Another component of the architecture is a Netduino Plus 2 card in which the LEDs and some cables are connected, which will work to detect at what level the water is located. Another output is that through linked access points to Netduino Plus 2 and to a computer. Another output of the system is that depending on the state that the water level is in, it sends a message through the computer.
Another previous work is [3], with renewal in the hardware, in which they proposed an architecture that senses the variation of water level by means of the ultrasonic sensor Parallax PING. The ultrasound bursts emitted by the sensor bounce off the water and in this way it is possible to know the distance at which the water level of the sensor is located. The data obtained is published on the social network Facebook using Facebook SDK v5 for PHP.
Twitter is used by [4], this proposal is oriented to the security area since its architecture is based on notifying the owner of a residence of the presence of a visitor through Twitter. In the same way, the user has control of the door so you can open the door or deny the passage through a device, in this case, a smartphone. Its architecture is based on a PIR sensor, to detect the presence of a visitor, a Wifi camera, which is responsible for taking a picture of the individual, a Raspberry Pi, for which data are received and published on Twitter so that the Raspberry Pi is able to publish on this social network. So it is necessary to install a program called Twython, which likewise the door has an electric lock which can be controlled by means of a smartphone.
Thanks to the work done by [5], we can see the potential of the LoRa communication protocol, because it performs a series of tests to determine the range of the loss of data packets. It carries out its tests in forest environments along river banks in different settings (urban, semi-urban and rural) and describes in detail the characteristics of the places where the tests were carried out. It was concluded that the environment may affect or benefit the data transfer, depending on the characteristics of the place and in its results it states that it did not obtain a data transfer at distances greater than 1600 m.
In the proposal of [6] a monitoring system focused on floods is exposed, since sensor networks are used topographically distributed along a body of water, in this case, a river, the sensors that are implemented in this proposal are not Specified, but it is mentioned that this architecture measures variables such as river water level, rainfall, wind speed data, and air pressure. Once obtained these variables are transmitted by means of an Arduino to a Raspberry pi, this communication is through the Xbee protocol, once they obtain the data the Raspberry stores them in a database and in the same way the data can be visualized in an interface that presents each variable by a point that each point is a sensor. These points can obtain different colors depending on the range of the variables; the red color means that a specific variable is present but very little, the blue color means that it is a little more present, but not so much, and the gray color is that the variable is very present at a certain moment.
The communication protocol chosen for the development of this prototype is LoRa since it is a wireless communication protocol that has a considerable range of about 15 km. In [7] they present us with a development that integrates this type of communication, and the objective of them was to design an architecture for the control and monitoring of the electricity of buildings. They tested the RN2903 module, this is a certified 915 MHz module, based on LoRa wireless technology, tested at different distances: 1 m, 5 m, 10 m, 20 m and 30 m, and each of these tests sent 10 data packets and in none of the distances there was a loss of information. But if they mention that they used in other environments, they can affect the transmission as well as it can benefit them depending on the transmission and reception area of these devices.
An early warning system with computer tools and simulations can be performed, as it presents [8], they acquire and process the data through simulations in real time. They consider 4 main components: simulation models, geographic information system, acquisition and supervision of data in time (real and deferred) and an up-to-date historical database. Its system interacts with two models of simulation: The HEC-HMS which in this case is responsible for simulating the rain processes and the hydrological response and the HEC-RAS which to conduct a study to know how much is the risk of suffering a flood in a certain geographical area. The acquisition and monitoring of data in time (real and deferred) is carried out by means of a SCADA system in the real-time case, since the SCADA system can visualize, control and collect data on the process that is being carried out. On the other hand, from the deferred time, random values were introduced manually as well as variable registers were used.
In this article, the LoRa communication is tested in a closed space. In [9] it is mentioned that the interest of testing this communication protocol is due to the fact that it is being very attractive for companies due to its characteristics, which are very favorable in terms of transmission ranges. Your network consists of a link port, a server, and a final device. In his experiments, he says that there is a “delay” between transmissions since the transmission device can’t continue sending data packets until it finishes receiving them and this time is more or less than 273 ms that is induced by the link serial. Likewise, in his conclusion he mentions something very interesting, that is, through experiments, they observed that the transmission speed is very important because it is too fast and data packets can be lost.
In recent works about Early Warning Systems, the authors propose capture and processing of physical variables architectures using free hardware plates, given that they are versatile. Interactive environments can be developed on the free hardware boards, such as viewing the captured data, which can be observed by means of electronic devices that are in the range of coverage. This data is transmitted to devices capable of displaying the variations through some communication protocol. The ZigBee communication protocol can be implemented since it has a range of 1 km distance for each node as it is exposed [10]. This presents an architecture that is based on a network of sensors, communicated to a server which transmits the data to the devices that are in the range of coverage. The architecture has a particularity that is the obtain data of atmospheric precipitations.
In [11] they expose how to measure the water level in ponds, in such a way it gives us the perception that, with a certain instrument, in this case, an ultrasonic meter, it has been possible to carry out this type of measurements. Its technology proposal is made up of a remote unit installed at the site of interest and the local unit within a nearby laboratory, both developed with the BS2p STAMP microcontroller. Today we have more sophisticated technology that can perform the measurement in the same or better way, but this work makes us see that water level measurement systems with old hardware have already been implemented.
A tool that will be used in the development of the proposed system, the most suitable the Raspberry pi3. In [12] it is shown that the Raspberry pi is very versatile, its environment monitoring proposal measures how clean the air is, variables of the environment such as temperature, humidity, luminosity, detects the presence of earthquakes and the variables obtained by sensors.

3. Design

3.1. Materials and Equipments

The tools used for the development of this project are the following.
  • Ultrasonic sensor jsn-sn04t-2.0.: this sensor works by emitting a sound pulse (TRIG), then the width of the return pulse (ECHO) is measured and the distance is calculated from the time differences between the Trig and Echo.
    Technical data of the sensor:
    • Operating voltage: 5V DC
    • Work current: 30 mA
    • Detection range: 25 cm–450 cm
    • Precision: It can vary between 3 mm to 0.3 cm
    • Acoustic emission frequency: 40 KHz
    • Minimum duration of the trigger pulse (TTL level): 10 μ S.
    • Minimum waiting time between one measurement and the start of another: 20 ms.
    • Detection angle: less than 50 °
    • Waterproof (front)
    • Diameter: 22 mm
    • Length: 17 mm
    • Work temperature: −10 ° C to 70 ° C
  • The TTGO is a programmable card which integrates an OLED screen and a radio module SX1276 LoRa. They also include a LiPo battery charger. It can be configured as a transmitter or receiver, this configuration can be carried out through the Arduino IDE using the ESP32 Dev Module card type.
  • The Wemos d1 card incorporates the esp8866 chip, which performs the processing tasks.
    Technical specifications:
    • 11 digital I/O
    • 1 Analog input
    • Micro USB connector
    • Wifi connection
  • Raspberry Pi 3 Model B + is the latest single-board computer to date that has launched the Raspberry Pi foundation which has the following specifications:
    • Broadcom BCM2837B0, Cortex-A53 (ARMv8) SoC de 64 bits a 1,4 GHz
    • 1 GB LPDDR2 SDRAM
    • 2,4 GHz and 5 GHz Wireless LAN - IEEE 802.11.b/g/n/ac
    • 40 headers GPIO
    • 4 USB 2.0 ports
    • Micro SD port to load your operating system and store data
    • 5 V/2.5 A DC power input
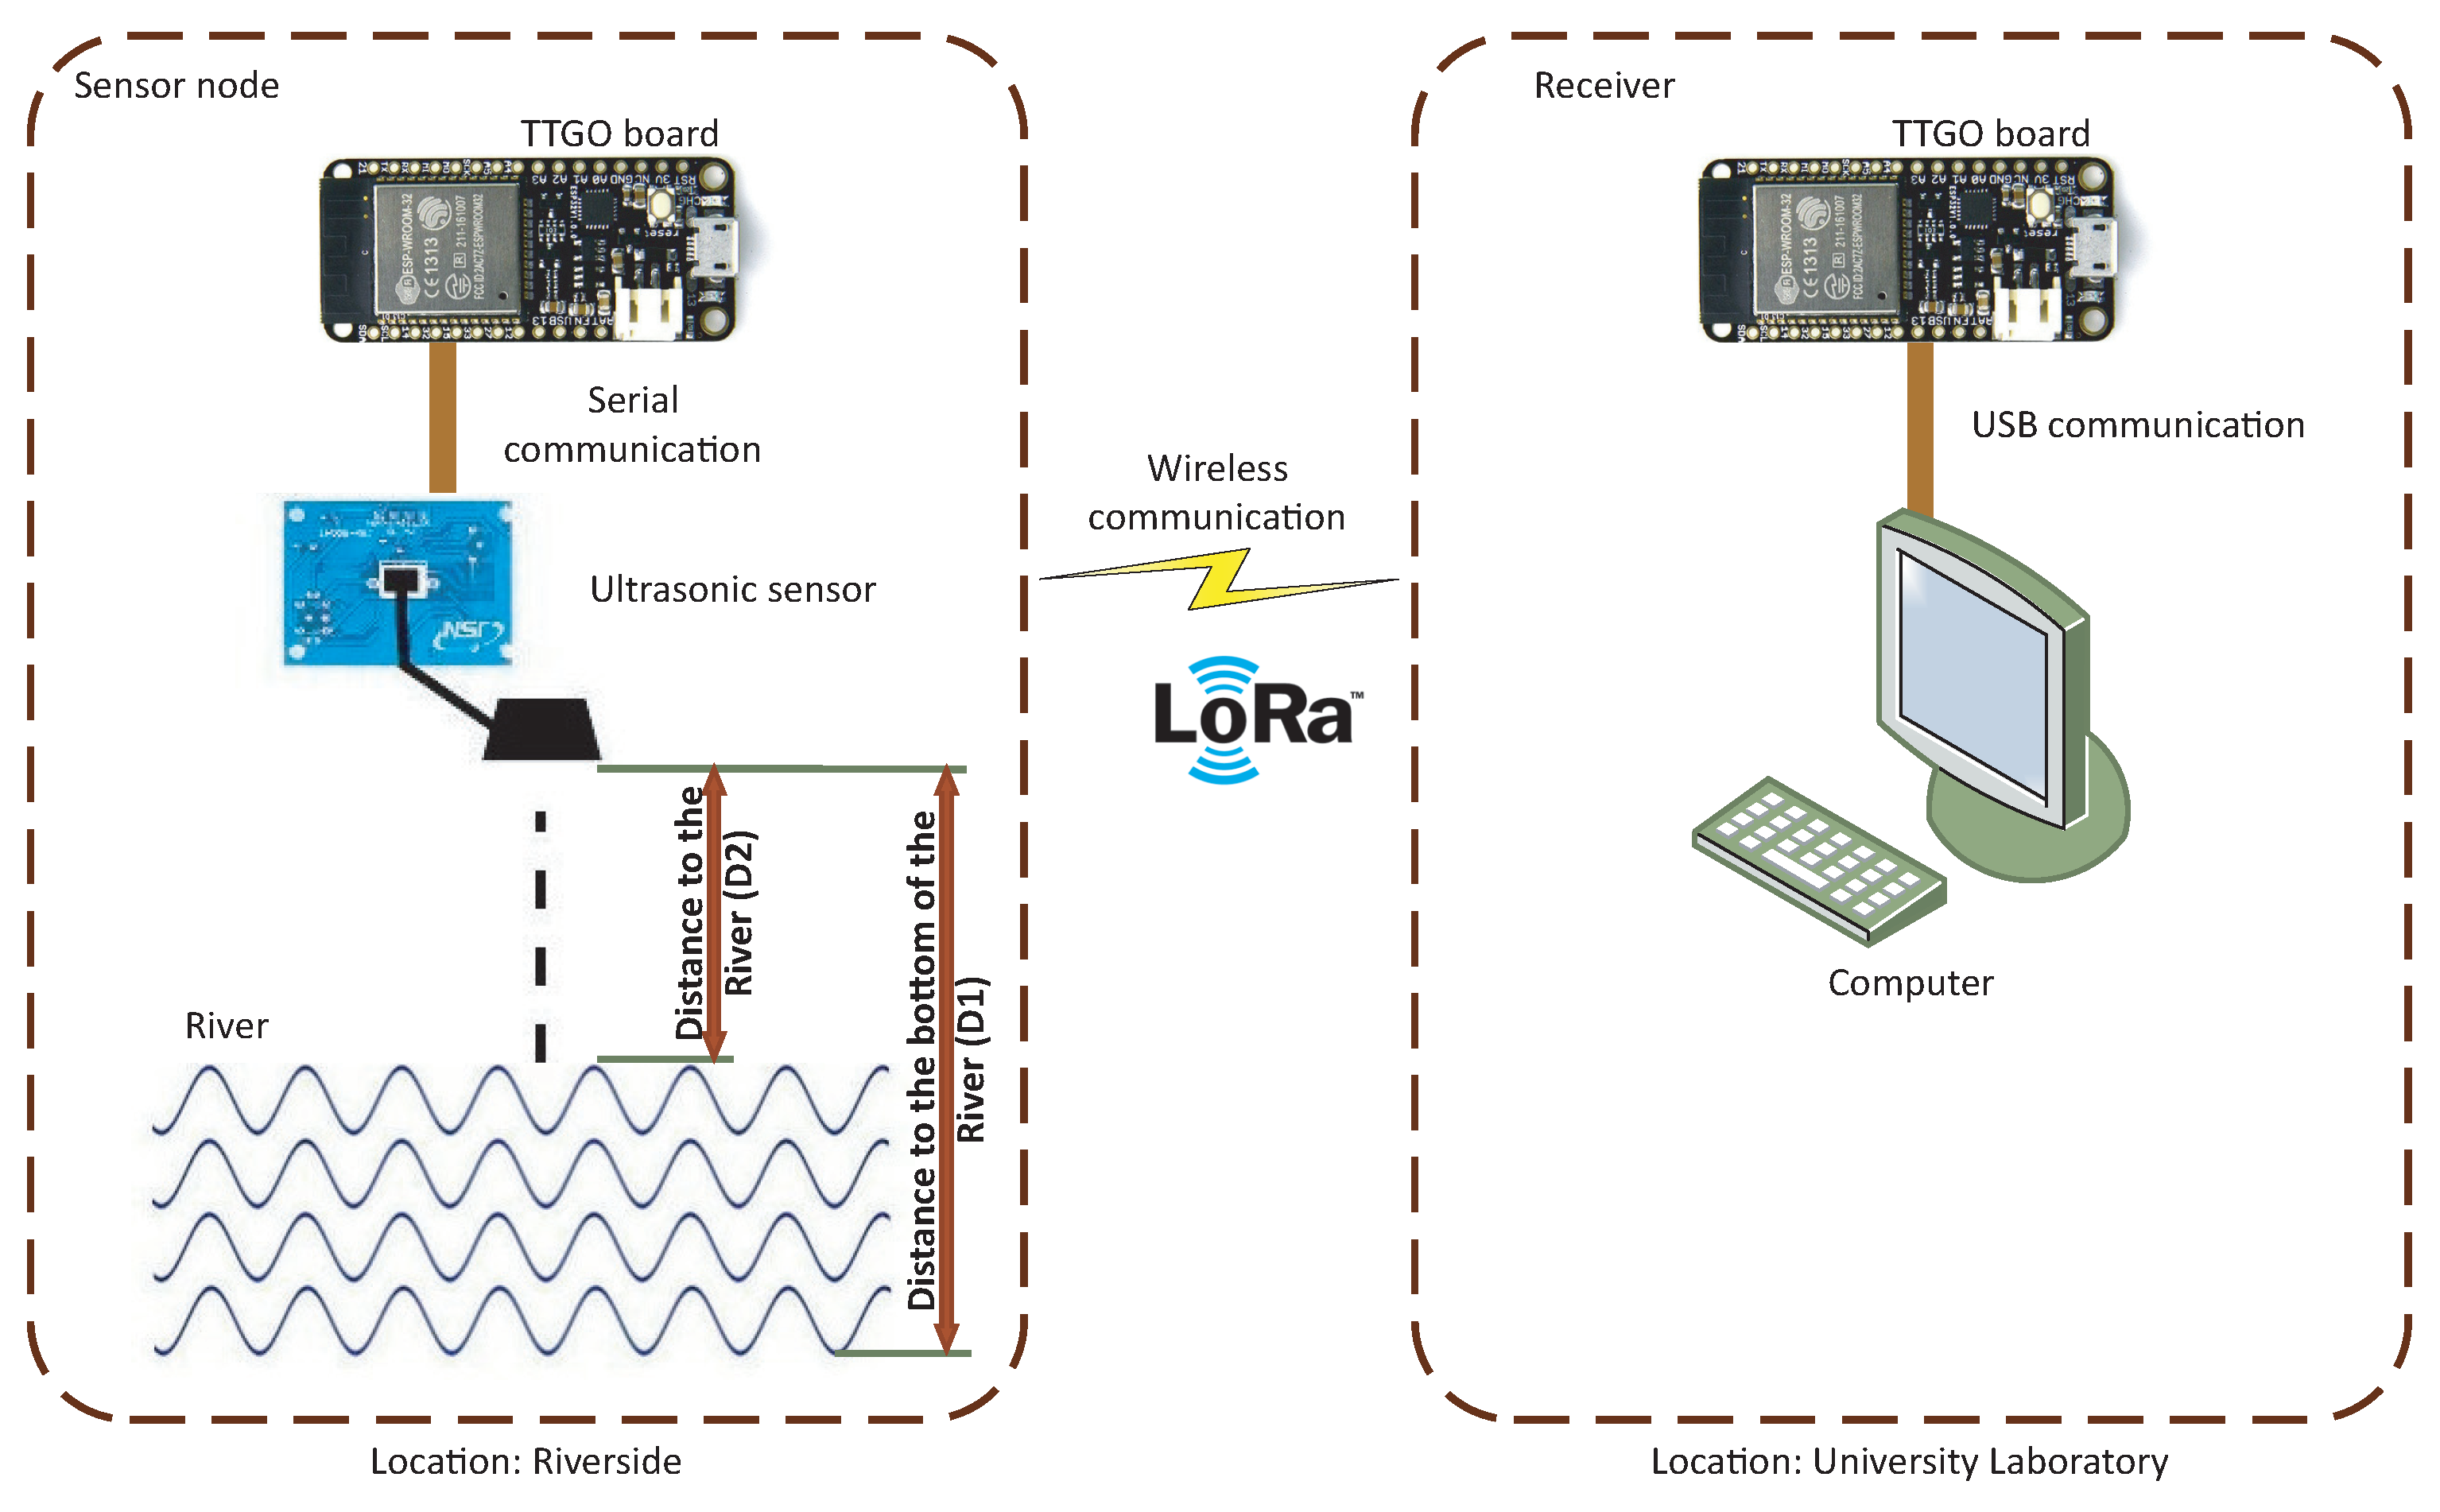
3.2. Architecture

In this section we describe the general approach to system architecture as shows in Figure 1.
  • Jsn-sr04-2.0: is the sensor that will be used in the project which is a waterproof ultrasonic sensor.
  • The microcontroller that works as an emitter is a TTGO in which the sensor will be connected, this card incorporates LoRa communication.
  • The microcontroller that works as a receiver is a TTGO, since it has the same characteristics as the transmitter.
  • The wemos mini: is configured as an access point to share the data with a computer.
  • The Raspberry pi 3 b +: is a single-board computer in which the programming is developed to save the data on a database and in the same way the data will be published in a Twitter account.

4. Testing and Implementations

In this phase of the study, the system is partially implemented in order to verify the operation of the ultrasound sensor and the cards that implement LoRa communication.
Current architecture
Figure 2 shows the current system implemented, the interaction between all components and the communication protocols used.
In order to obtain the river level, it is necessary to know the distance to the bottom of the river (D1) previously. Also, the distance between the sensor and the river level (D2) is acquired by an ultrasonic sensor. Figure 2 shows where the distances D1 and D2 are located in the diagram. Equation (1) shows the calculation applied to obtain the river level (L) using the distances D1 and D2. This operation is performed in the sensor node.
L = D 1 D 2
Firmware
Figure 3 shows the flowchart that describes the simplified operation of the programs that run on node and receiver.
In Figure 3a the operation of the firmware running the receiver is observed schematically. On the other hand, in Figure 3b the sensor node operation is shown.
Sensor node
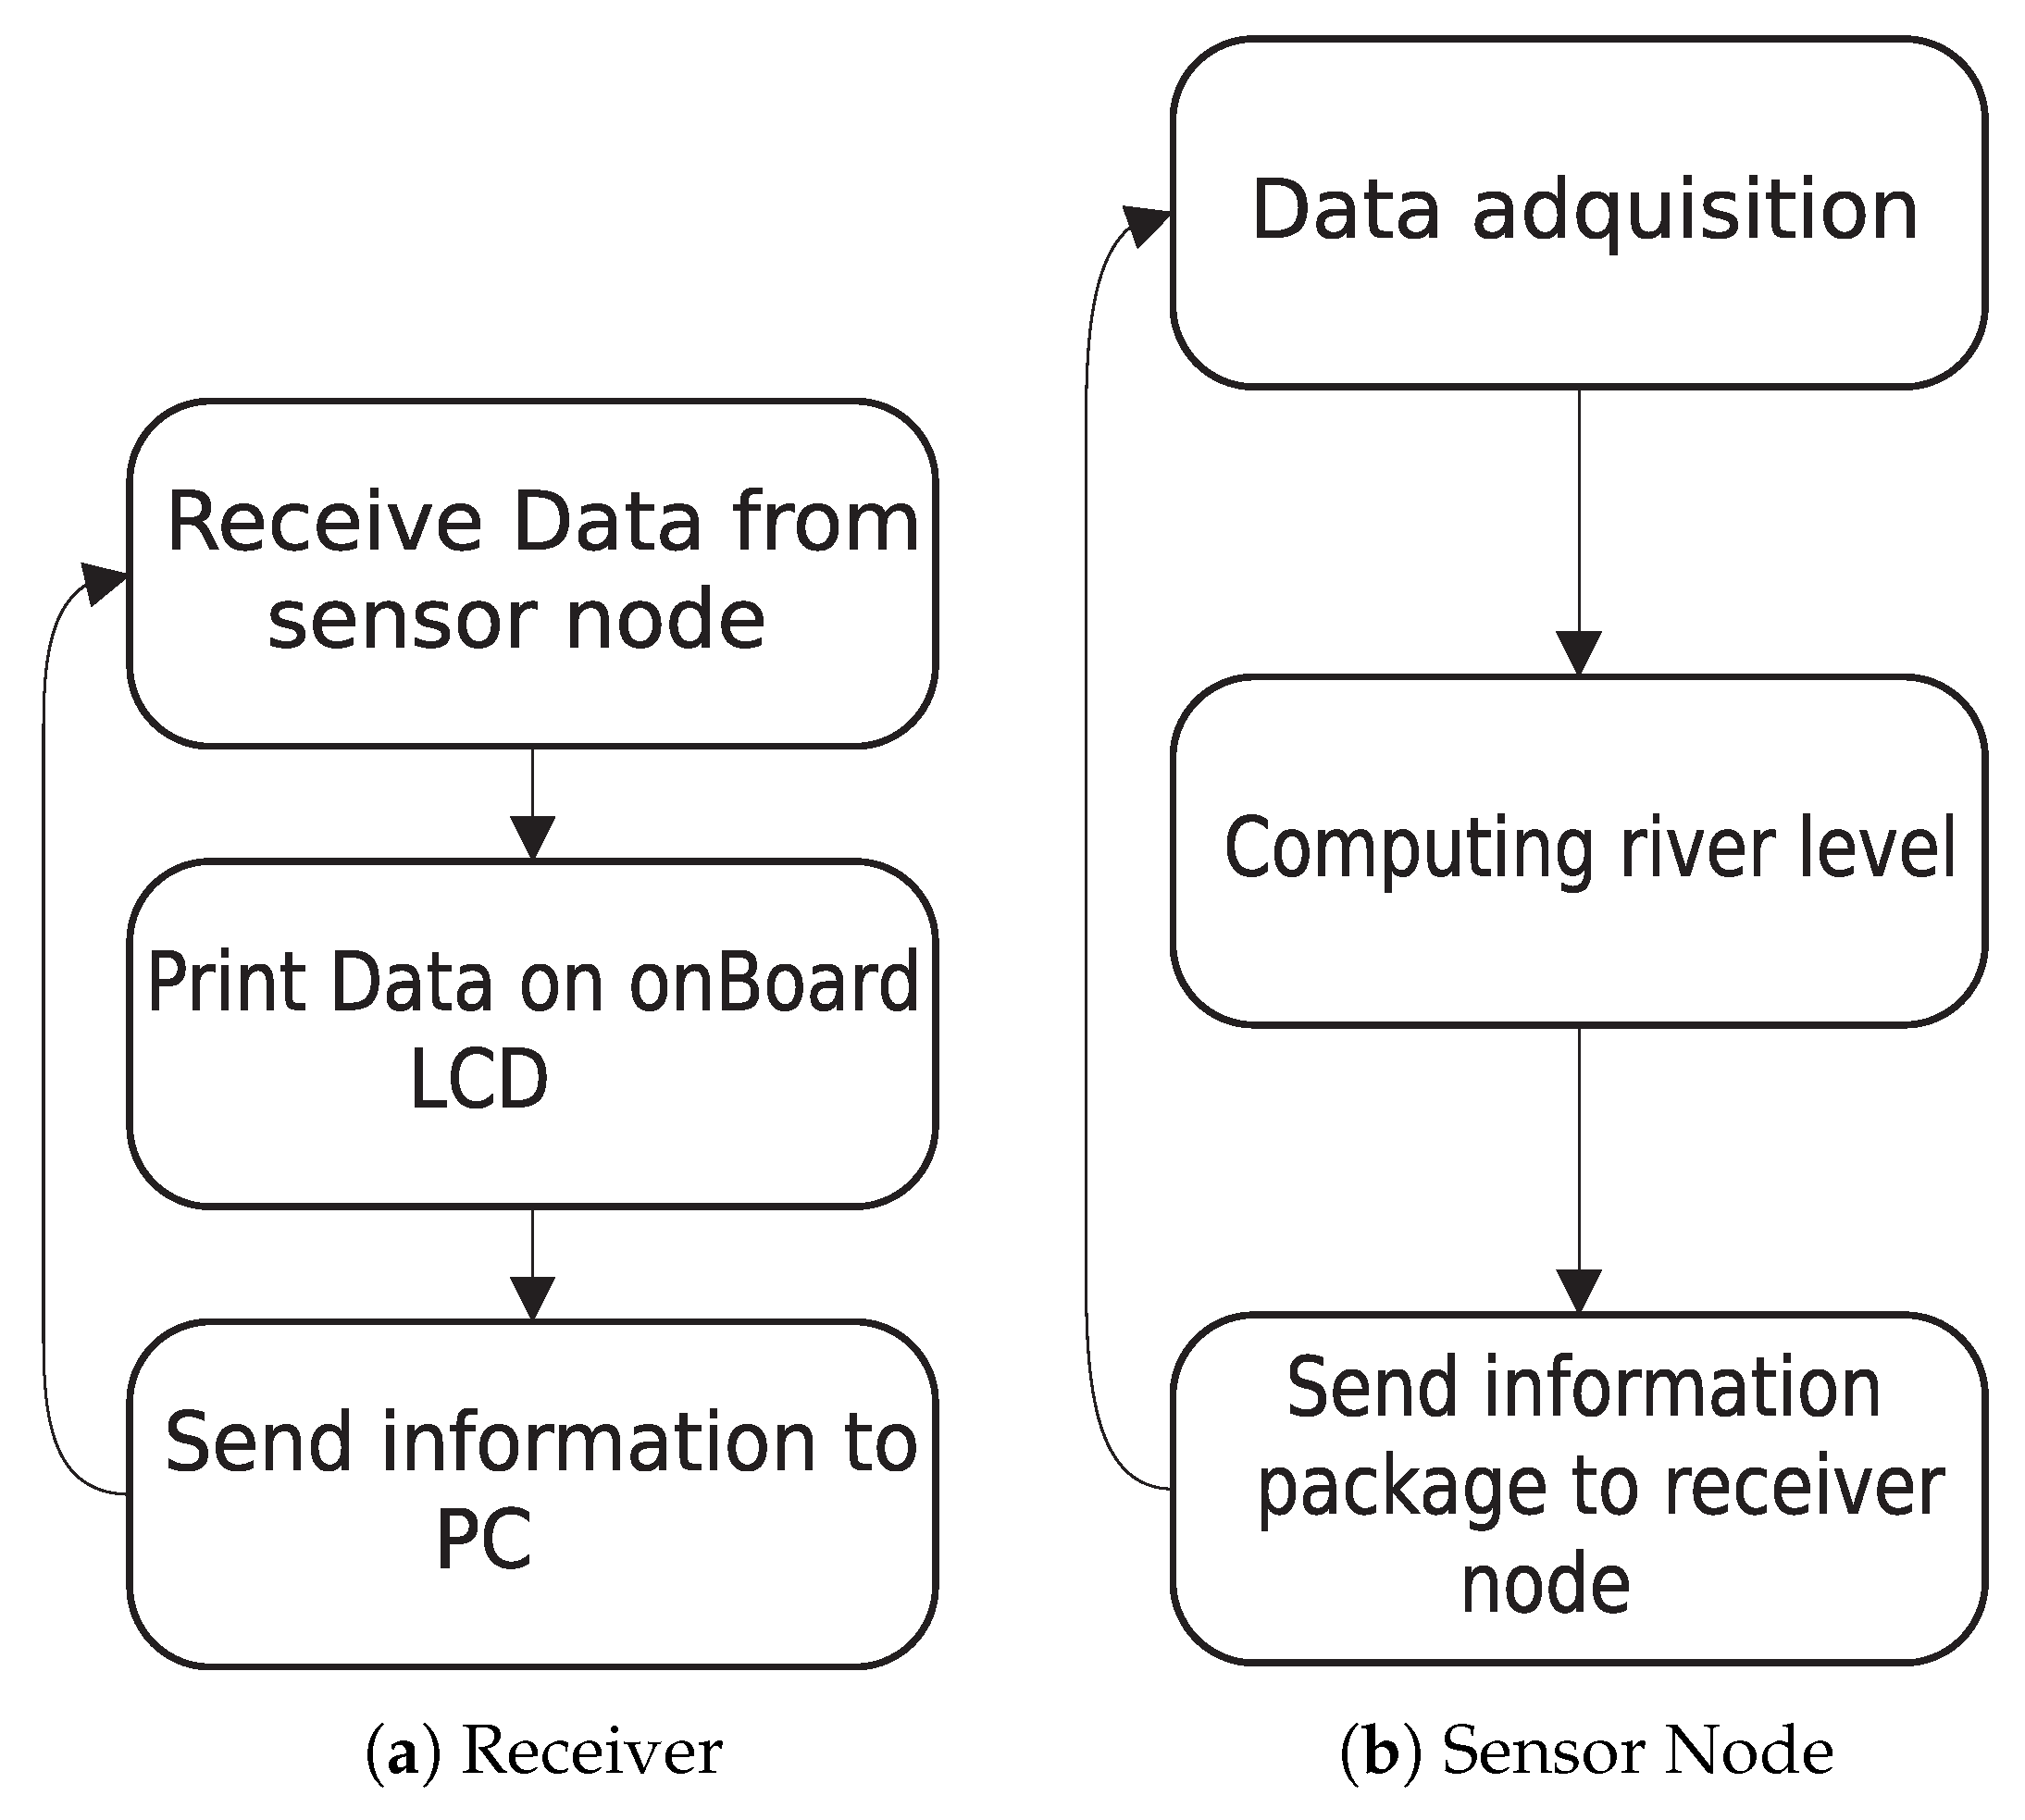
  • The sensor reads the input variable, that in this case is the distance (in cms) of the water from the edge of the river.
  • A mathematical operation is performed: The depth of the river (which is declared as constant in the program) minus the distance obtained.
  • The result of this operation is sent into a data package of type string to the receiver node. This string is composed of the word depth, a blank space and the result of the operation converted into ASCII code.
Receiving node
  • Receive the data package from the sensor node.
  • Print the received data on the LCD screen.

5. Results

5.1. Prototype

Figure 4 shows how the initial prototype of this stage of the project was assembled.
As shown in Figure 4a the receiver has its antenna and its power supply and it uses a USB port.
The sensor node (Figure 4b) is made up of the ultrasonic sensor, and the cards that perform the conversion and transmission of the information. These cards use the same USB connection as the power source.

5.2. Assessment

To evaluate the prototype, measurements were made over the entire measurement range, i.e., from 20 cm to 3 m in order to visualize the behavior.
Table 1 shows that the sensor node captures very accurate measurements on the ground, although in some cases the tests showed incorrect measurements, which had a margin of error of one centimeter more than the correct measurement and was presented on one occasion an incorrect measurement of one centimeter less than the correct measurement.
Table 2 shows how the sensor node collects the measurements precisely, but also it has a margin of error of one centimeter over the correct measurement and three times showed a reading of one centimeter less than the correct one.

6. Conclusions and Future Works

So far, the ultrasonic sensor and the communication between the cards were tested. Since the sensor node took the reading of the distance of the sensor with respect to a water body, the tests were performed on land and in water, these measurements received by the receiver node were made by LoRa modulation, the tests performed showed that the sensor measures with acceptable accuracy, 1 cm of margin of error.
The work will continue with the development of a system with a database and an interface, that has an alert published in Twitter.
This first stage of the project, together with the previously mentioned system, will produce an EWS prototype for river overflows.
It is recommended to add additional protocols to the EWS prototype, i.e., a communication system that allows for a level of security of the transmitted information and mesh network functionalities between the nodes. In addition, it is recommended to integrate the EWS with other systems such as water precipitation (rainfall) system and integrate this information with algorithms that allow estimating the growth that the river will have.

Acknowledgments

This paper was supported by Programa de Fortalecimiento de la Calidad Educativa (PFCE) 2018 number: P/PFCE-2018-27MSU0018V-11. We would also like to express our gratitude to the Juarez Autonomous University of Tabasco for supporting the academic resources needed for this research.

Conflicts of Interest

The authors declare no conflict of interest. The founding sponsors had no role in the design of the study; in the collection, analyses, or interpretation of data; in the writing of the manuscript, and in the decision to publish the results.

References

  1. Pickering, P. Develop with LoRa for Low-Rate, Long-Range IoT Applications. Available online: https://www.digikey.com/en/articles/techzone/2017/jun/develop-lora-for-low-rate-long-range-iot-applications (accessed on 26 June 2017).
  2. Hernández-Nolasco, J.A.; Ovando, M.A.; Acosta, F.D.; Pancardo, P. Water level meter for alerting population about floods. In Proceedings of the International Conference on Advanced Information Networking and Applications, AINA, Crans-Montana, Switzerland, 23–25 March 2016. [Google Scholar]
  3. Wister, M.A.; Hernandez-Nolasco, J.A.; Pancardo, P.; Acosta, F.D.; Jara, A. Emergency population warning about floods by social media. In Proceedings of the 2016 10th International Conference on Innovative Mobile and Internet Services in Ubiquitous Computing, IMIS 2016, Fukuoka, Japan, 6–8 July 2016. [Google Scholar]
  4. Nasimuzzaman Chowdhury, M.; Shiblee Nooman, M.; Sarker, S. Access Control of Door and Home Security by Raspberry Pi Through Internet. Int. J. Sci. Eng. Res. 2013, 4, 550–558. [Google Scholar]
  5. Campos Avila, P.E. Evaluación del Rango de Transmisión de LoRa Para Redes de Sensores Inalámbricas con LoRaWAN en Ambientes Forestales. Ph.D. Thesis, Universidad de Cuenca, Cuenca, Ecuador, 2017. [Google Scholar]
  6. Sakib, S.N.; Ane, T.; Matin, N.; Kaiser, M.S. An intelligent flood monitoring system for Bangladesh using wireless sensor network. In Proceedings of the 2016 5th International Conference on Informatics, Electronics and Vision (ICIEV) 2016, Dhaka, Bangladesh, 13–14 May 2016; pp. 979–984. [Google Scholar]
  7. Rodríguez Moreno, E.S.; López Ordoñez, V.F. Diseño e Implementación de un Sistema Inteligente para un Edificio Mediante IOT Utilizando el Protocolo de Comunicación LORAWAN. 2018. Available online: http://hdl.handle.net/11349/7394 (accessed on 15 April 2018).
  8. Monagas, M.G. Sistema automatizado de alerta temprana ante el peligro de inundaciones Automated system for early warning of potential flooding. Ingenieria Hidraulica y Ambiental 2013, XXXIV, 30–43. [Google Scholar]
  9. Neumann, P.; Montavont, J.; Noel, T. Indoor deployment of low-power wide area networks (LPWAN): A LoRaWAN case study. In Proceedings of the International Conference on Wireless and Mobile Computing, Networking and Communications, New York, NY, USA, October 17–19 2016. [Google Scholar]
  10. Coll, M.A.A. Sistemas de Alerta Temprana (S.A.T) para la Reduccion del Riesgo de Inundaciones Subitas y Fenomenos Atmosfericos en el Area Metropolitana de Barranquilla. Scientia et Technica 2013, 18, 303–308. [Google Scholar]
  11. Gutierrez, J. Medidor ultrasónico de nivel de agua para estanques. IngenierIa, Investigación y Tecnología 2006, VII, 234–244. [Google Scholar] [CrossRef]
  12. Ibrahim, M.; Elgamri, A.; Babiker, S.; Mohamed, A. Internet of things based smart environmental monitoring using the Raspberry-Pi computer. In Proceedings of the 2015 Fifth International Conference on Digital Information Processing and Communications (ICDIPC), Sierre, Switzerland, 7–9 October 2015; pp. 159–164. [Google Scholar]
Figure 1. System architecture raised.
Proceedings 02 01213 g001
Figure 2. Current architecture implemented.
Proceedings 02 01213 g002
Figure 3. First prototype flux diagram.
Proceedings 02 01213 g003
Figure 4. First prototype implemented.
Proceedings 02 01213 g004
Table 1. Measurements taken on land
ItemN ° SamplesTape Measure [cm]Sensor Mean [cm]Sensor Standard Desv.Standard Error
1105050.0990.3160.1
210100100.1990.4210.133
310150150.1990.4210.133
410200200.1990.4210.133
510250250.2990.4830.152
610300300.0990.5670.179
Table 2. Measurements taken on water
ItemN ° SamplesTape Measure [cm]Sensor Mean [cm]Sensor Standard Desv.Standard Error
1102020.2950.4830.153
2104039.9970.4710.149
3106060.1990.4220.133
4107069.7990.4220.133
Publisher’s Note: MDPI stays neutral with regard to jurisdictional claims in published maps and institutional affiliations.

