1. Introduction
European air transport market was compelled to evolution to face the two mayor changes in his recent history. In the one hand, the irruption and consolidation of low cost carriers [
1], that in the present day represent a significant share of intra-European flights and that oblige the airports to develop active strategy in order to maintain the traffic volume and their competitive offer oriented to the user demands. In the other hand, the change in the way the airports were managed, from public to private ownership and/or management established the necessity of economic activity not directly related to the air transport itself [
2,
3]. Their main objective: to make the airports profitable [
4,
5].
It is also worth mentioning that the growing importance of the commercial area of airports is a direct consequence of the worldwide trend to reduce in-flight food services [
6]. The provision of F&B services prior to boarding is an increasing source of revenue, as well as a way to enhance the travelers’ experience if the offer is wide and diverse [
7].
The growth of the interconnected (personal or public) systems provide valuable information, non-directly related to the flights or the air sector. The new airport paradigm is user-centered and offers a wide range of commercial and value-added services to the passengers. As this information volume and quality increases, so does the complexity of its treatment. It is at this point where the use of IoT and sensors could be key, allowing to collect large amounts of information in a non-intrusive way, helping in the classification of travelers by profiles according to their behavior.
This characterization of travelers is one of the entry points of the tool presented in this paper, which through the analysis of such data and behavior simulation techniques enables intelligent visualization and optimization of the airport environment. This opens great opportunities for generating economic activity by means of exploitation of this information and, at a time, encourage customer loyalty by enhancing the passenger’s experience [
8,
9].
Due to the increasing importance of customer orientation to a competitive advantage, airport managers emphasize passengers’ perceptions and expectations of airport services quality. Operators are trying to reduce the level of anxiety suffered by passengers to a minimum. As such anxiety tends to decrease significantly once security screening is passed, this area provides a stress-free environment that is perfect for increasing passenger consumption and thus increasing airport revenues [
10,
11].
At the moment, about half of revenues of airports in Europe come from the on-site non-aeronautical services offered to the travelers, especially from the shops and restaurants (retail) [
7]. So, the optimization of the existing resources is critical to maximize the benefits and profitability of the physical rented spaces [
12,
13]. Despite the importance that this type of analysis has in the user satisfaction and the revenue of airport [
12,
14,
15], the tools proposed so far in literature are focused on operational or security aspects. For example, one of the first works in this regard was presented by Gatersleben et al. in [
16], where in the context of a project called LOT, they presented some simulation tools for identification of bottlenecks in the passenger handling. Another interesting work is found in [
17], where the authors developed a simulation tool for pedestrian flows in public transport facilities, including airports. The tool was designed to measure aspects as travel times, waiting times, queue building, visit to shops, etc. with an especial emphasis in the boarding and alighting processes. Wilson et al. provided another system for airports in [
18] but for simulating different aspects related to security. Concretely, the system was a security checkpoint optimizer based on discrete event simulation that could be used to evaluate aspects as passenger and bag throughput, security effectiveness, resource utilization and operational costs.
A more holistic simulator for airports was proposed in [
19], based on a mesoscopic approach and using systems dynamics. The systems aimed at representing service processes and flows of arrival, departure or transit in airports through the different terminal facilities and functional areas. In [
20], the authors proposed a tool for optimizing checking services, and more concretely, to determine the number of opened gates as a function of the passenger demand of the departing flights with the aim of balancing the cost and the waiting time of the users. Another related work is found in [
21], where Tsai et al. presented a system to evaluate the gap between passengers’ perception of the service quality and their expectations using different multicriteria methods. More recently, a passenger flow simulator was described in [
22]. The tool modelled the space requirements and flow management in the main terminal building and related areas of a hub airport, and it was designed to cover aspects as the design and construction of airport spaces taking into account economic, social forecasting and strategic considerations, as well as produce and evaluate operational alternative scenarios dynamically. Finally, in [
23] Majid et al. described a tool that combines agent-based simulation and discrete event simulation in order to model travelers’ behavior at check-in counters with very promising results.
As mentioned before, we can see that most of the research done on airport simulation tools are usually focused on operational and security issues or in a more generic modelling of the passenger flows. For this reason, as far as we know, a tool for the simulation of traveler’s behavior focused on the non-aeronautical services has not been proposed in literature, so far. Having this idea in mind, the main objective of this work is to present the design and development of a simulator that models and emulates the behavior of categorized groups of travelers likely to use an airport. The research aims to improve competitiveness in the air transport sector by using ICT to evaluate the non-aeronautical services provided to the traveler. For all purposes, the behavior is quantified in relation to the time that such travelers spend in the various areas of the airport (land side and the secure airside portion of the terminal) and the use that they made of the different services and spaces.
As part of the developed tool, potential scenarios can be visualized and analyzed by means of a submodule that implements configurable toggles. The activation and deactivation of this toggles allows managers to optimize the use of the different spaces according to their strategy, interests or preferences.
The paper is divided into the following sections. The second chapter introduces the design of the software platform, pointing out the different functional modules and emphasizing the implementation of the toggles, a key mechanism to characterize the behavior of the travelers at the airport. Chapter three shows in detail the development done by specifying the design and implementation process of each of the modules. The fourth chapter exemplifies the results offered by the tool by executing a use case with real data from the Girona airport. Finally, the fifth chapter summarizes the main conclusions and further lines of research.
2. Design of the Software Platform
The research done aims to improve competitiveness in the air transport sector by using ICT as a tool that favors greater satisfaction of user demands, offering value-added services tailored to their needs. The practical result of this research is embodied in a software tool for the simulation of traveler behavior and the improvement of airport processes, whose design is explained below.
2.1. Main Functional Modules of the Simulator
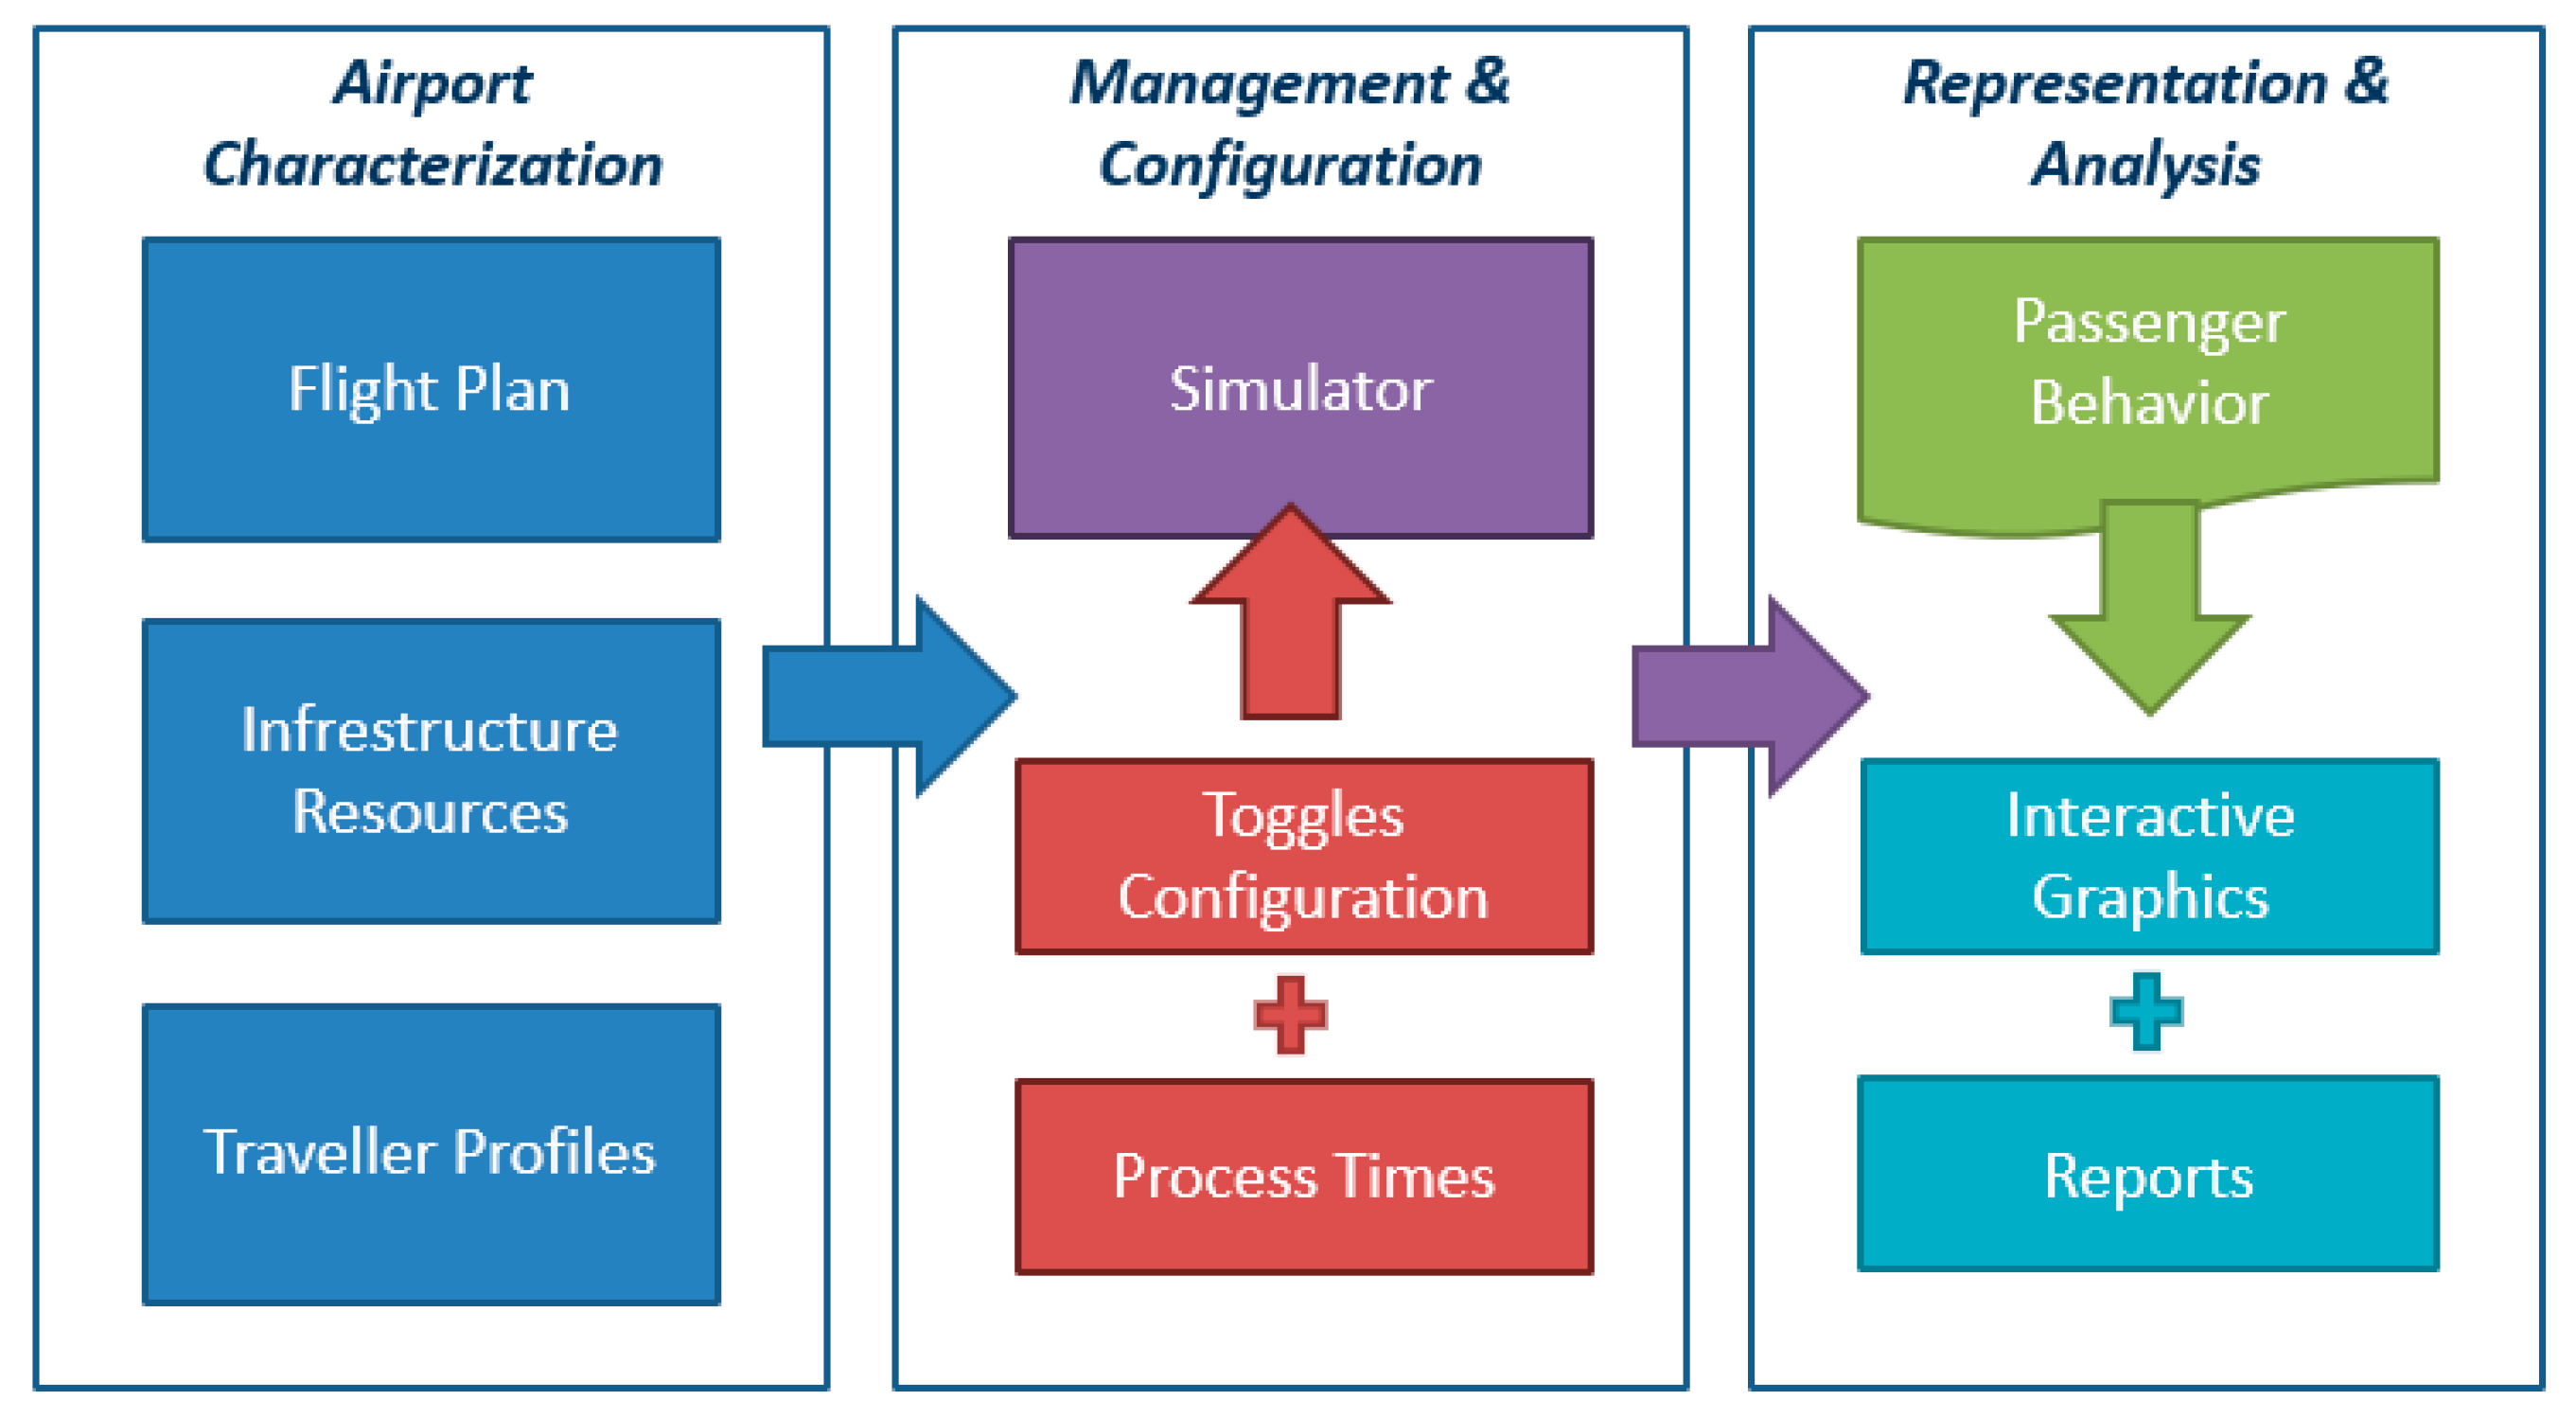
There are three different functional modules of sequential organization: (1) airport characterization; (2) configuration/management and (3) representation/analysis.
Figure 1 shows the conceptual design of the tool.
The characterization module is responsible for collecting all the available information from the airport to be modeled: its flight plan, its infrastructure resources (airport check-ins, baggage carousels, boarding gates, etc.), as well as the information of the travelers, established based on their suitability for profiles already developed.
The
management and configuration module incorporates into the previously modeled airport information a set of toggles (more detail in
Section 2.2) in order to modify the different processes (in terms of number of available resources, level of service, waiting time, etc.), establishing a simulation of the profiles’ behavior and, consequently, their impact in airport operations.
The representation/analysis module is responsible for showing the results of the simulation both in the form of a printable report and in the form of an interactive graphic suite. A total of five different graphs have been developed, parametrized and dynamically updated according to the value of the different toggles.
2.2. Description of the Modelling of Toggles in Passengers’ Behavior
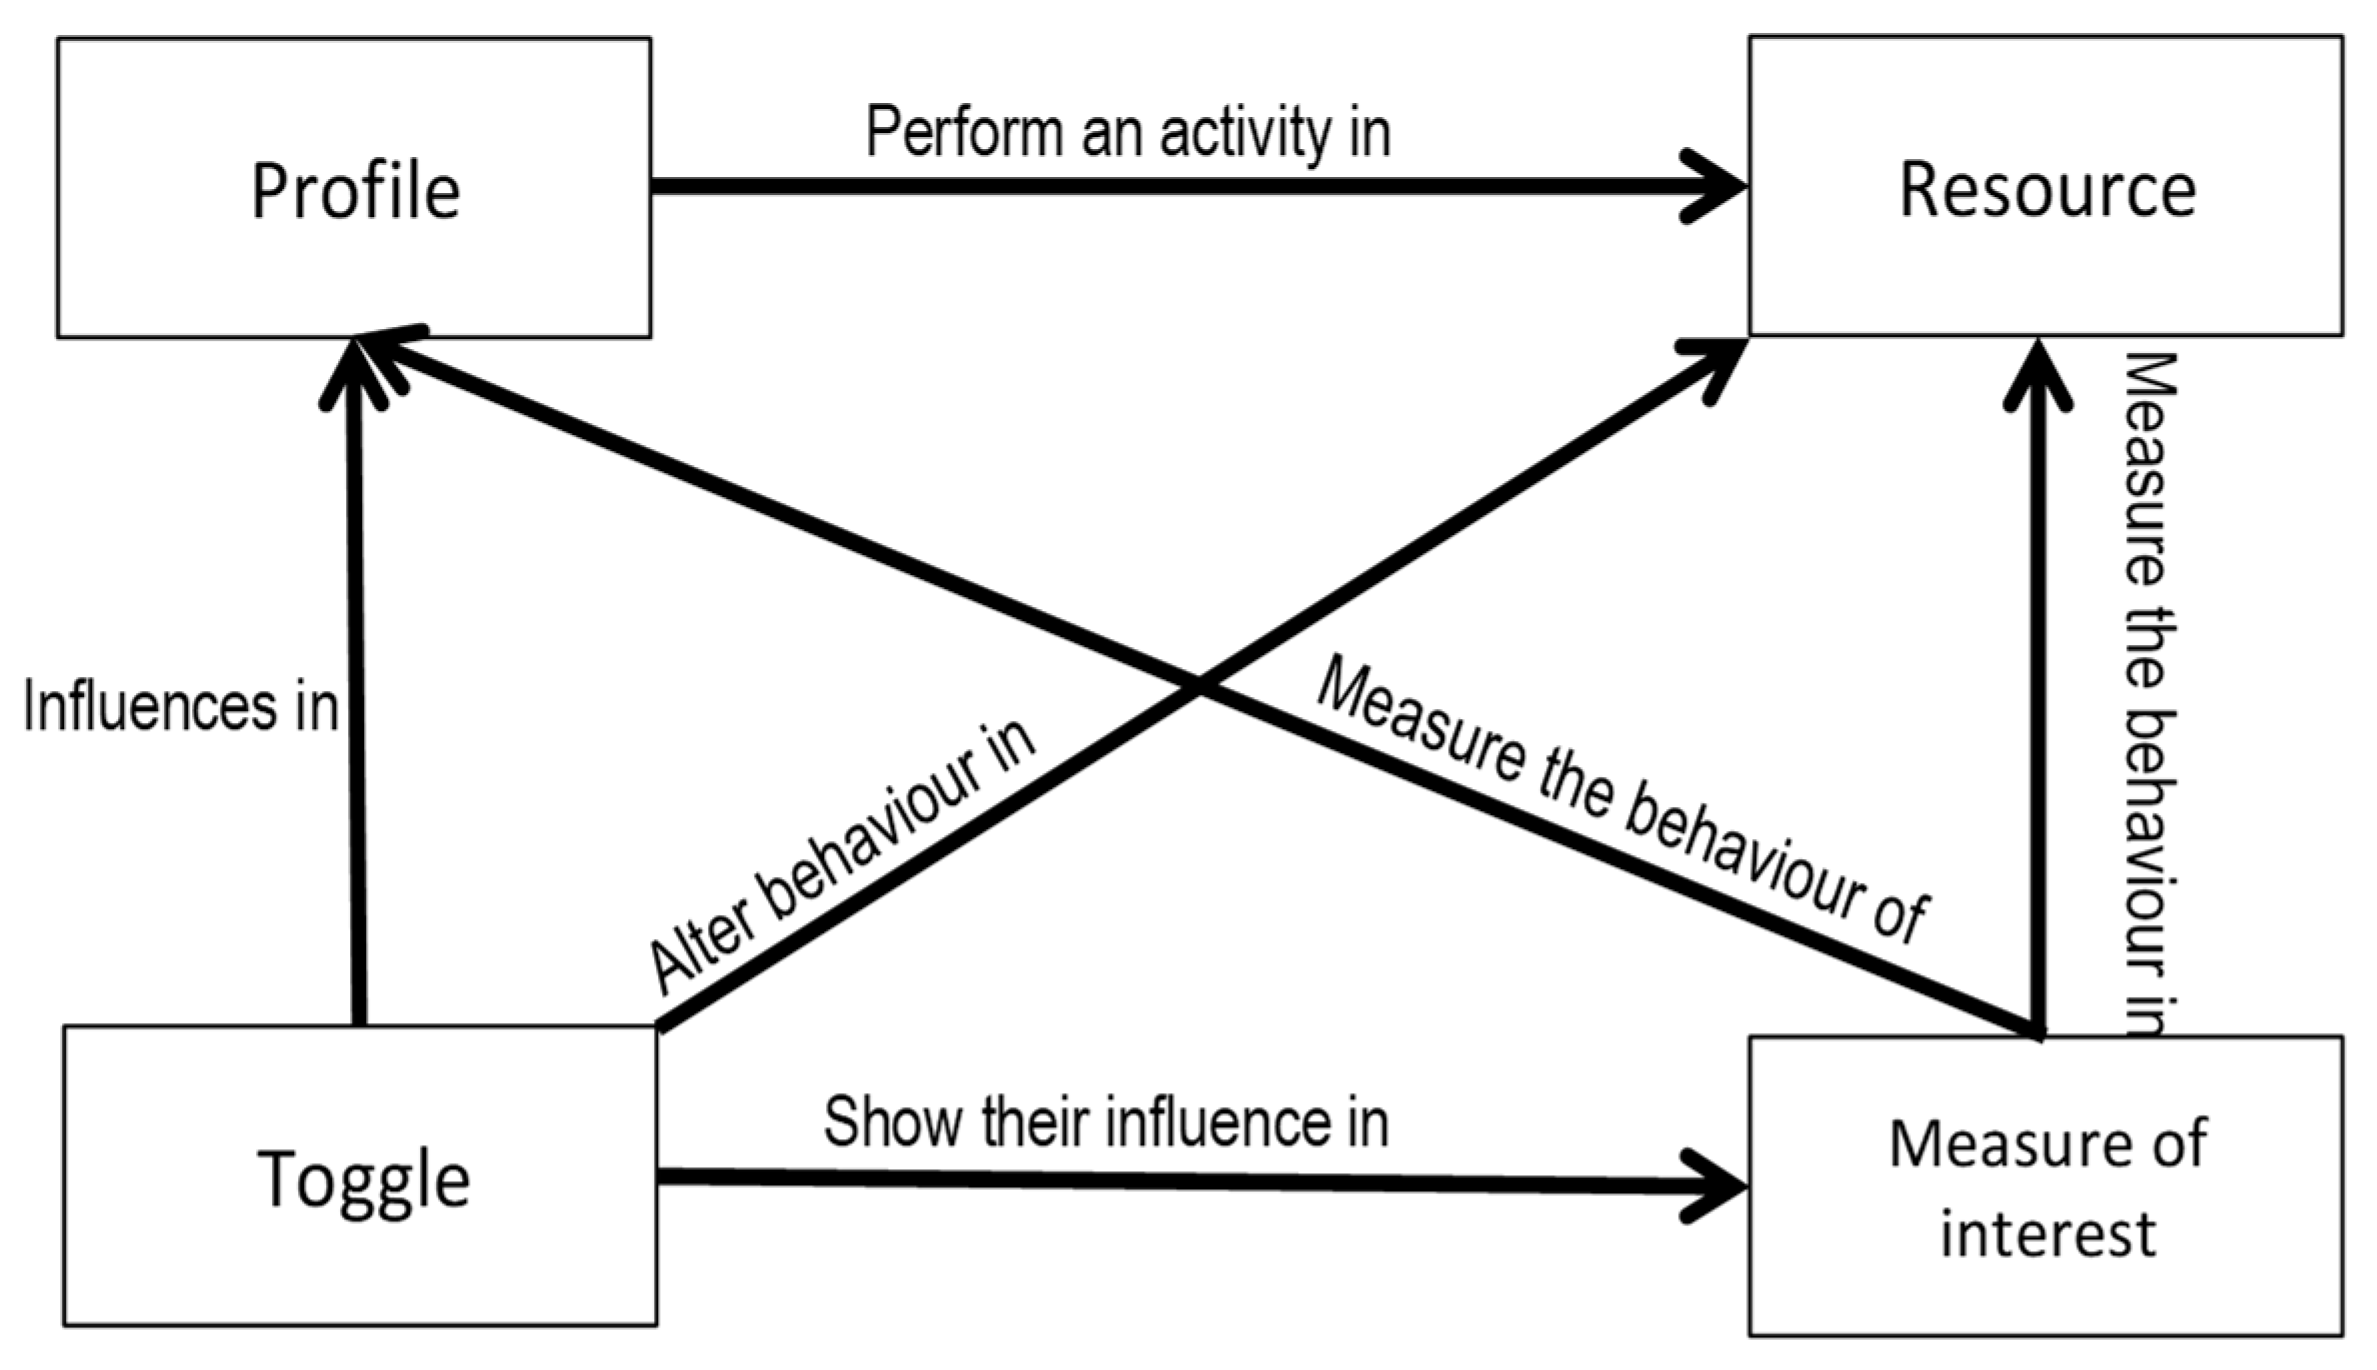
One of the most important functionalities of the software platform presented in this paper are the toggles. A toggle can be seen as a switch that enable/disable a certain resource in the airport. These resources (WiFi, VIP room, children’s area, etc.) have impact in the behavior of the all or some passenger profiles. Given the wide variety of resources that can be considered and their type of impact in user’s behavior, it is important to establish a modelling that abstracts the main elements of this system and their interactions [
10]. In the methodology designed for these purposes, we define four types of elements (
Figure 2):
User Profiles: Characterization of the most common groups of passengers for a certain airport or a specific flight obtained from the statistical analysis of passenger surveys.
Infrastructure resources: These represent the different resources that we can find inside the airport, and in which users carry out some type of activity such as waiting, shopping, etc.
Measures of interest: These are measures that quantitatively collect the behavior of the different profiles in one or more infrastructure resources. These measures can be the time passengers spend in a given space (resource) or the probability with which they will make a purchase.
Toggles: Identify certain optional services or resources of an airport that may alter the generic behavior of the profiles. Toggles can activate or deactivate certain infrastructure resources, in which users perform some type of activity.
The mathematical formulation of the methodology is defined as follows. Let us define a set of user profiles P = {P1, …, Pn}, a set of resources R = {R1, …, Rm} and a set of toggles T = {T1, …, Ts}. Then, a measure of interests can be seen as an application M: P × R → ℝ, that is, for each pair profile-resource it establishes the value of a corresponding measure. To facilitate the understanding of the methodology we will use a toy example with one user profile (P = {A}), three resources (R = {WiFi, Commercial Zone, Boarding Lounge}), and time spent in a zone (TSZ) as measure of interest.
From the former elements, for each profile Pi, we calculate a behavior vector BViM = (v1, …, vm) where vj = M(Pi,Rj). This vector contains the values of the measure of interest M for the profile Pi in each resource, which summarizes the behavior of the profile in the airport. In our toy example, the behavior vector BVATSZ = (0 min, 10 min, 5 min).
Finally, in order to model the influence of the activation/deactivation of a toggle Tk in the behavior of a user profile, for each Pi and measure M, we define a influence matrix IMk,iM of m rows and m columns, one for each possible pair of resources. Each element of the influence matrix ajj’ it is a value in the interval [0,1] indicating how much quantity of the measure M goes from the resource Rj to the resource Rj’. In this way, we can obtain the new behavior of a profile Pi with respect to the measure M when the toggle Tk is activated by multiplying the behavior vector BViM by the influence matrix IMi,kM which leads to a new behavior vector BV’iM.
With this methodology we can model influences of the next types, which were the most commonly found in airports:
When the toggle Tk is activated, the passengers of the profile Pi will increase/decrease an ajj ∗ 100% the measure M in the resource Rj.
When the toggle Tk is activated, the passenger of profile Pi will transfer a percent-age ajj’ ∗ 100 from resource Rj to Rj’.
Following our toy example, if WiFi toggle influences the behavior of profile A in the next way:
We can model it by means of the influence matrix (see
Table 1), and the resulting behavior vector VB’
AM = (0 min, 7 min, 6.5 min).
2.3. Technical Description and Simulator Architecture
The developed simulator provides an advanced analysis tool to support decision making in airport processes. For this, the behavior of different types of travelers is modeled and its performance is evaluated in function of known factors. The behavior will be measured in relation to the time that travelers spend in the various spaces/infrastructures of the airport.
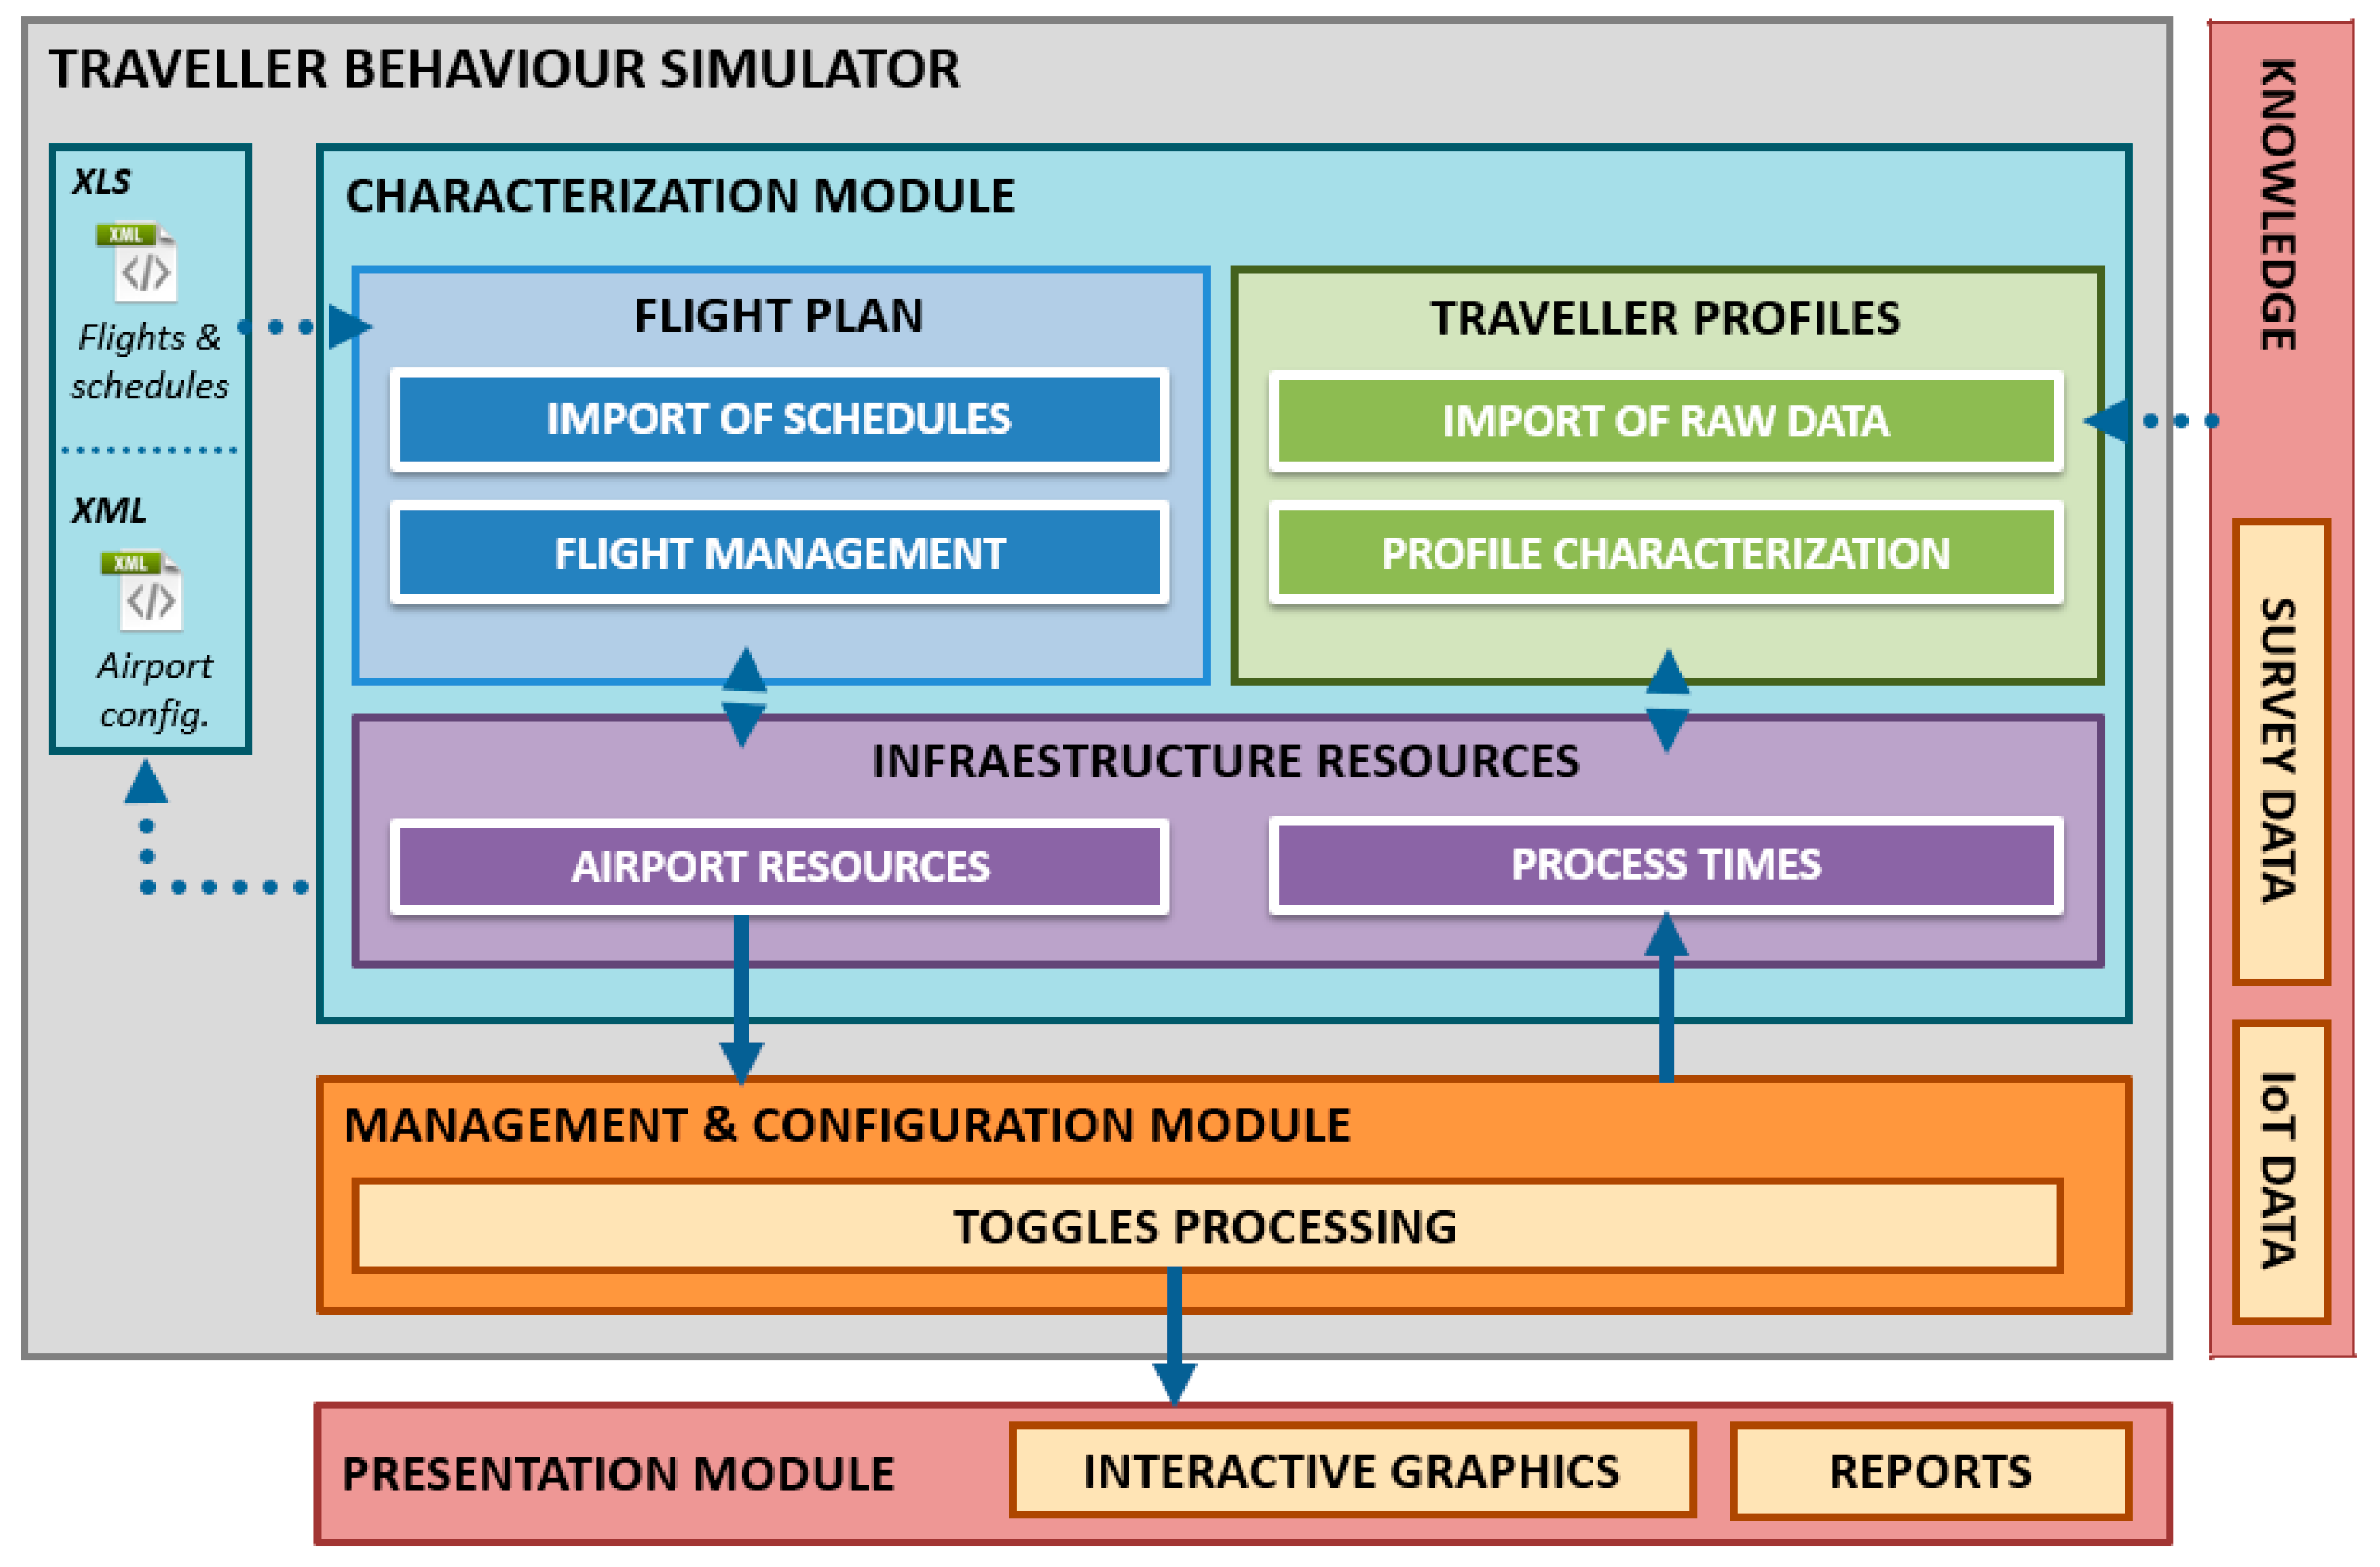
The software architecture used (
Figure 3) divides the functionality into the three principal areas or modules already defined in
Section 2.1, in addition to exposing data input and output. The application has been developed in .Net as a desktop application being compatible with Windows computers on all OS versions (32 and 64 bits).
The application follows a classic model-view-controller (MVC) structure, where from the input information referred to both the basic data of the airport and the characterization of the different profiles (area marked in blue in the figure), performs the simulation process (orange area), to finish showing the results through interactive graphs and reports (red marked area).
In this regard, to ensure the validity of the development and its subsequent integration into optimization tools, the simulator uses standard formats as data source and storage (JSON editable files for the model and XLS files for the flight plan) in each simulation project.
3. Implementation of the Software Platform
In order to achieve the objectives and following the design specified in the previous section, it is decided to develop a software platform or simulator by which to collect, analyze and provide information about airport management, helping in the optimization of processes and passenger experience. Flexibility and extensibility have been sought, including the following functionality:
Management (CRUD) of infrastructures, user profiles and all other basic project resources.
Management of the flight plan and occupation by profile and flight.
Management of the process time table (average waiting time in each of the resources/infrastructures) for each profile.
Management of toggles and configuration of their effect on user profiles or other toggles.
This information is stored locally as the basic project configuration, allowing its direct modification from an external text editor to later load it on the tool transparently. In order to show the results of the simulation projects several graphs have been implemented from which to visualize the information obtained by the tool. These graphs together with the project data are also attached as a report to facilitate their printing and subsequent consultation.
The implementation of the simulator is detailed below, taking into account its separation in functional modules, decoupling the business logic from the presentation and the configuration, thus favoring extensibility. The following subsections describe the technical details of the different simulator components.
3.1. Characterization Module
This module is responsible for managing the configuration of the projects generated by the simulator. It should be borne in mind that each simulation project requires sufficient input data, along with a manual editing by responsible personnel, so that the final results obtained are valid and useful.
Currently, and in order to collect relevant information from travelers (such as their age, frequency of use of the airport, average time in advance of the flight, etc.) a complementary mobile application has been developed that allows surveys to be carried out. From these surveys the traveler’s characterization has been established, taking into account that it is total dependent on each airport. It is considered the addition of elements such as presence sensors, to be installed in the different areas of the airport, allowing to collect this information in an automated and non-intrusive way, thus improving the results obtained by the tool.
Three separate interfaces are provided for the configuration of the three basic elements of an airport: Infrastructure resources, Flight plan and Traveler profiles. The final configuration based on these elements is exportable and editable and facilitates the creation of new simulation projects.
Infrastructure resources. Allows to establish the infrastructure to simulate, considering the available own resources. i.e., for low-volume or only operating at national level airports, passport or customs resources can be deactivated. It also includes information on the traveler’s time and permanence in each infrastructure resource. The necessary information must be entered manually by responsible personnel.
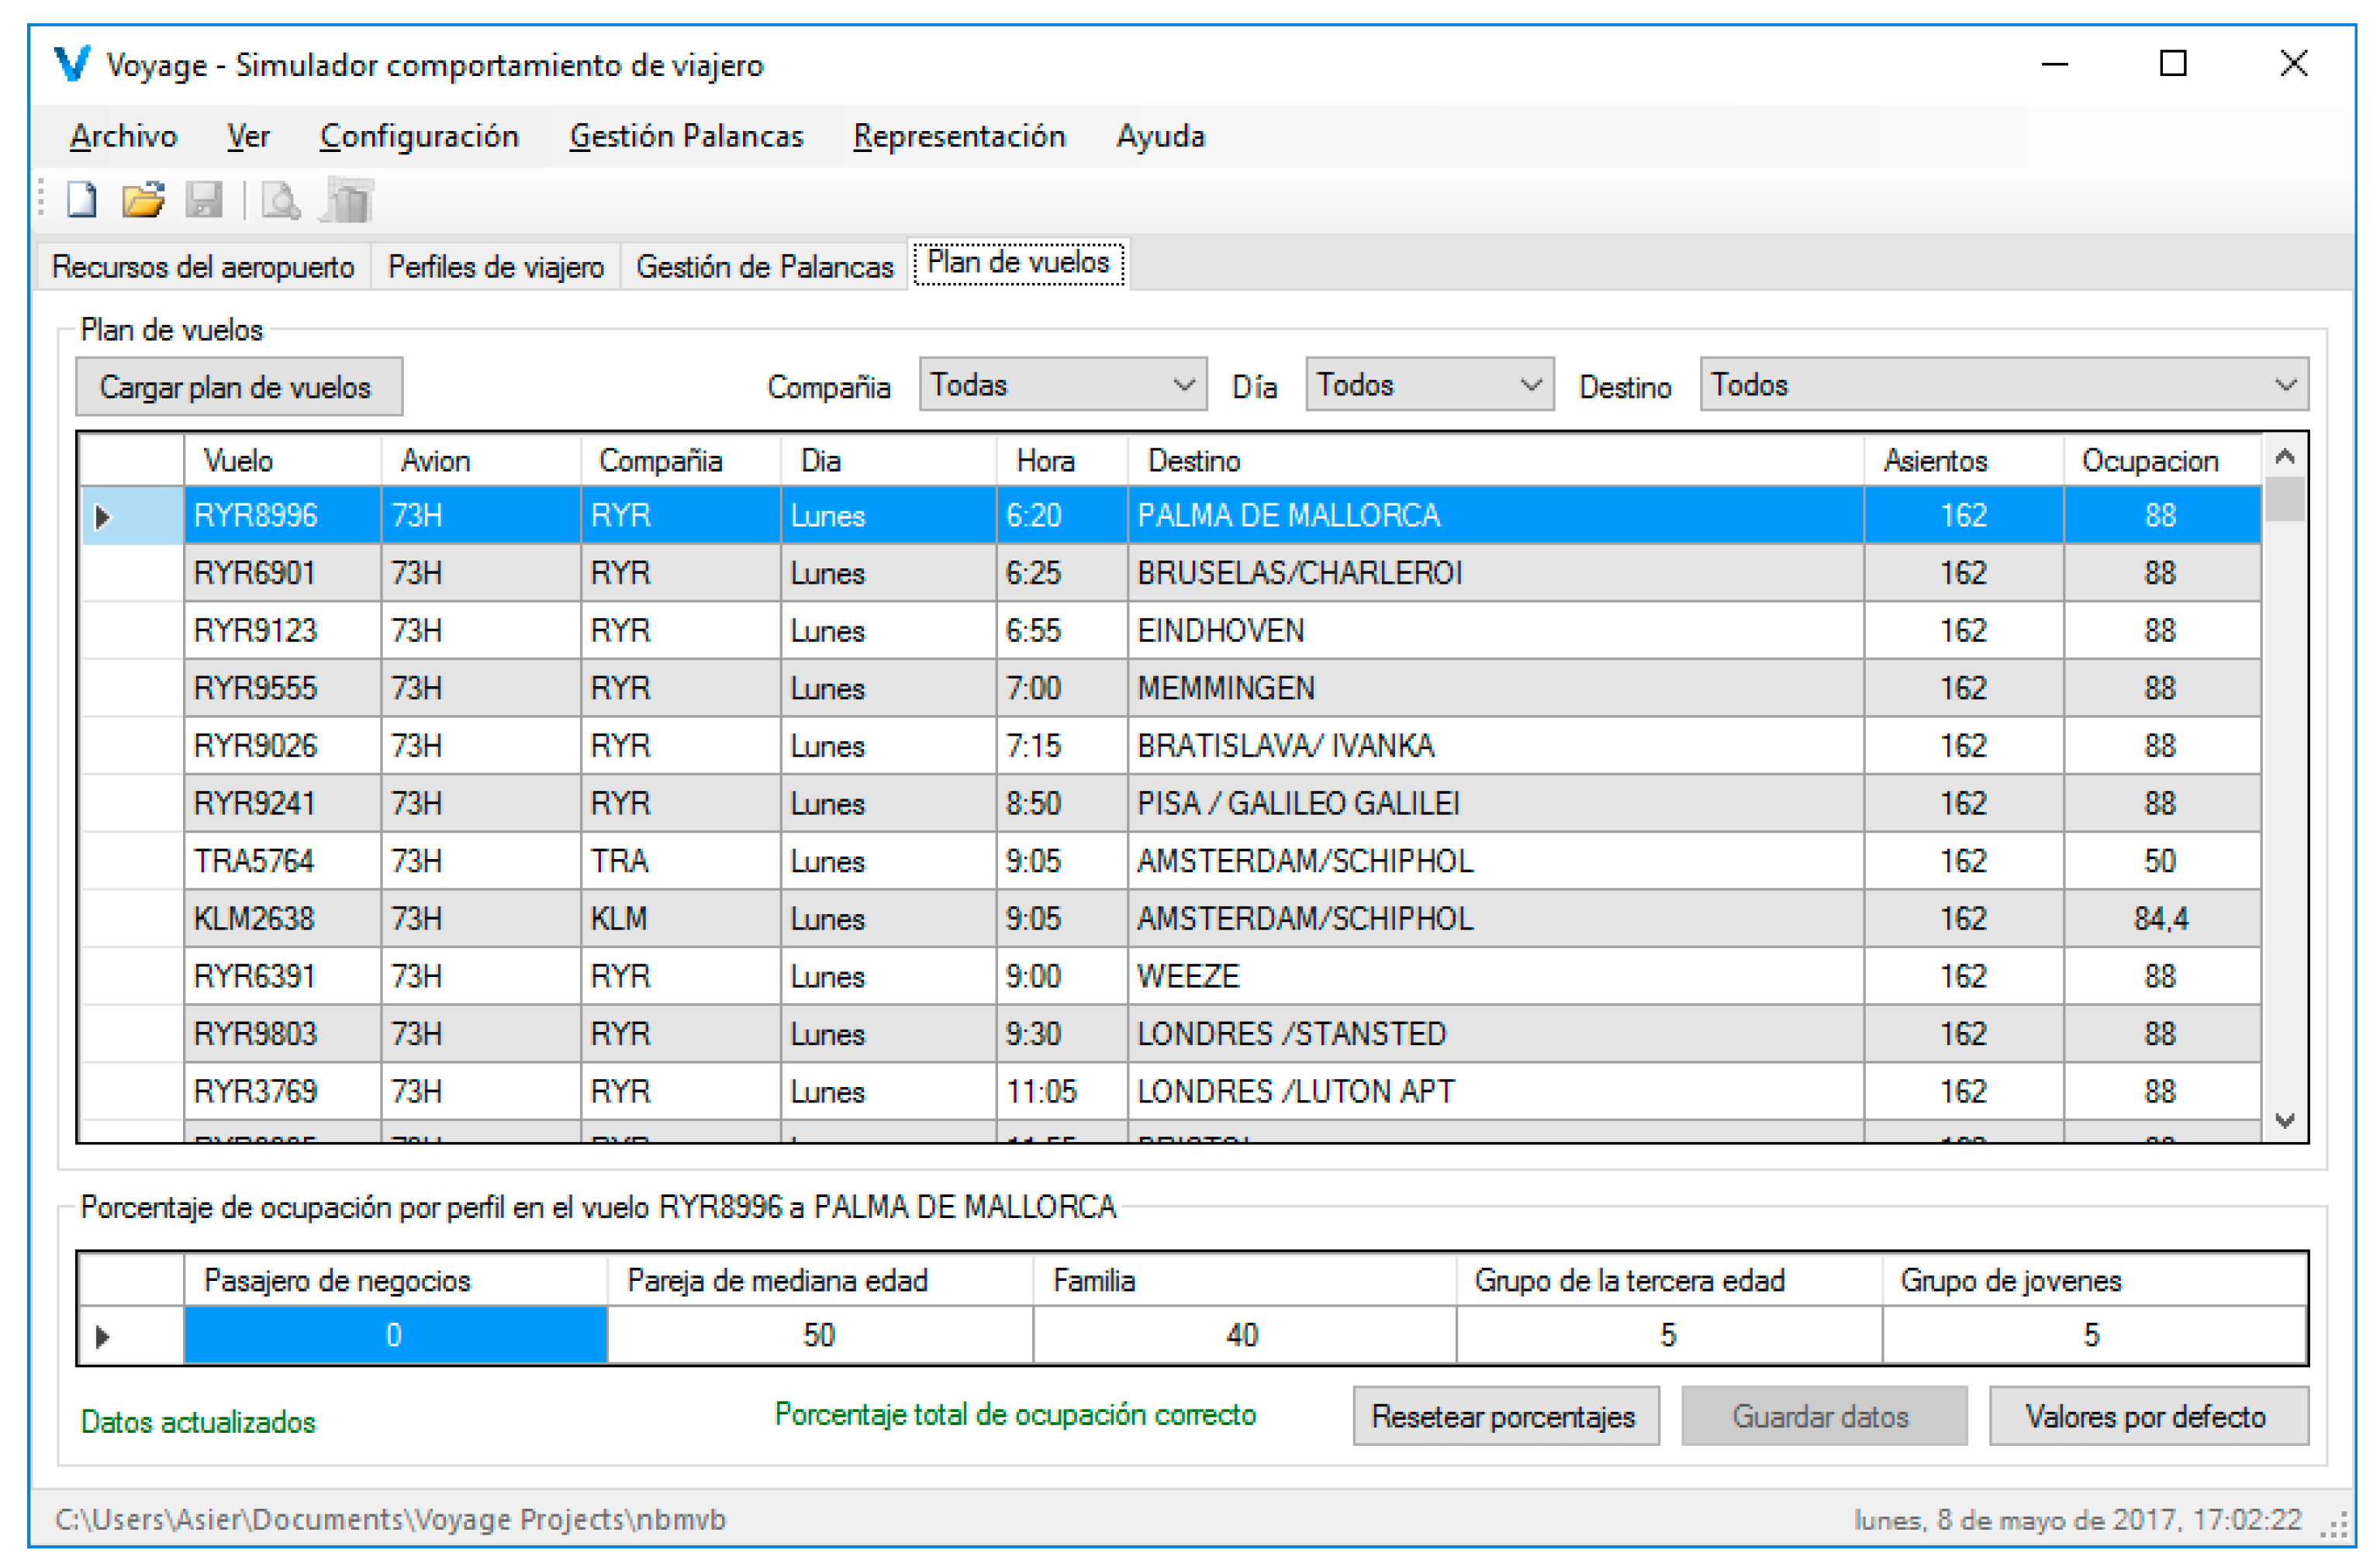
Flight plan. It allows attaching the scheduling of flights that operate at the airport. A module has been developed that automates the import of such planning from Excel files, commonly used at airports, greatly facilitating the management of such data (
Figure 4). It also includes information on the capacity of different aircrafts and the average occupation of different airlines.
Traveler profiles. Characterization of each type of traveler, establishing profiles based on their expected behavior. Some of these profiles may be: families, business travelers, senior citizens, etc. The required information (including pre-flight times) should be entered by responsible personnel. A complementary mobile application has been developed which allows the execution of surveys of travelers, facilitating the collection of data for the generation of the profiles.
3.2. Management and Configuration Module
The management and BI module fulfills the task of incorporating and processing all the data collected in the previous module. Such prior information, together with the necessary business logic will give rise to a detailed analysis of the behavior expected by profile and resource, depending on the date and the operational flight plan, and bonded to the constraints as toggles applied in real time.
As explained above, the toggles define “optional” airport resources or changes in the characterization of a resource (for example, free internet access for limited time can increase the travelers’ stay in several zones). The activation of these toggles allows analyzing the change in the behavior defined for the different profiles in the previous configuration modules and their influence in the airport operation. The methodology designed to estimate the influence of different toggles in the airport operation has been already described.
The simulator provides a specific interface from which to define and configure the available set of toggles. A form has been designed from which, making use of the various available drop-down selectors (toggles and profiles) and the corresponding cells, it is possible to define the percentage change in the behavior of the selected profile affecting one or more infrastructure resources.
Depending on the type of profile, as well as the presence of each profile in the airport, the passengers will act in one way or another by activating the different toggles, thus allowing to observe the different reactions of the profiles to the simulated operational changes.
3.3. Presentation Module
The management module provides results in terms of the modification of the behavior of the different profiles with respect to the different resources. Such changes, including those produced by the application of the toggles, are difficult to translate into improvements in processes without the aid of graphical tools that facilitate their interpretation and analysis.
The presentation module is responsible for this task. To this end, it provides a total of five different representations classified into two large groups: presentation curves and analysis of theoretical behavior, from which to visualize and interpret the information obtained by the tool more easily. Below, the information provided by mentioned set of graphics is detailed.
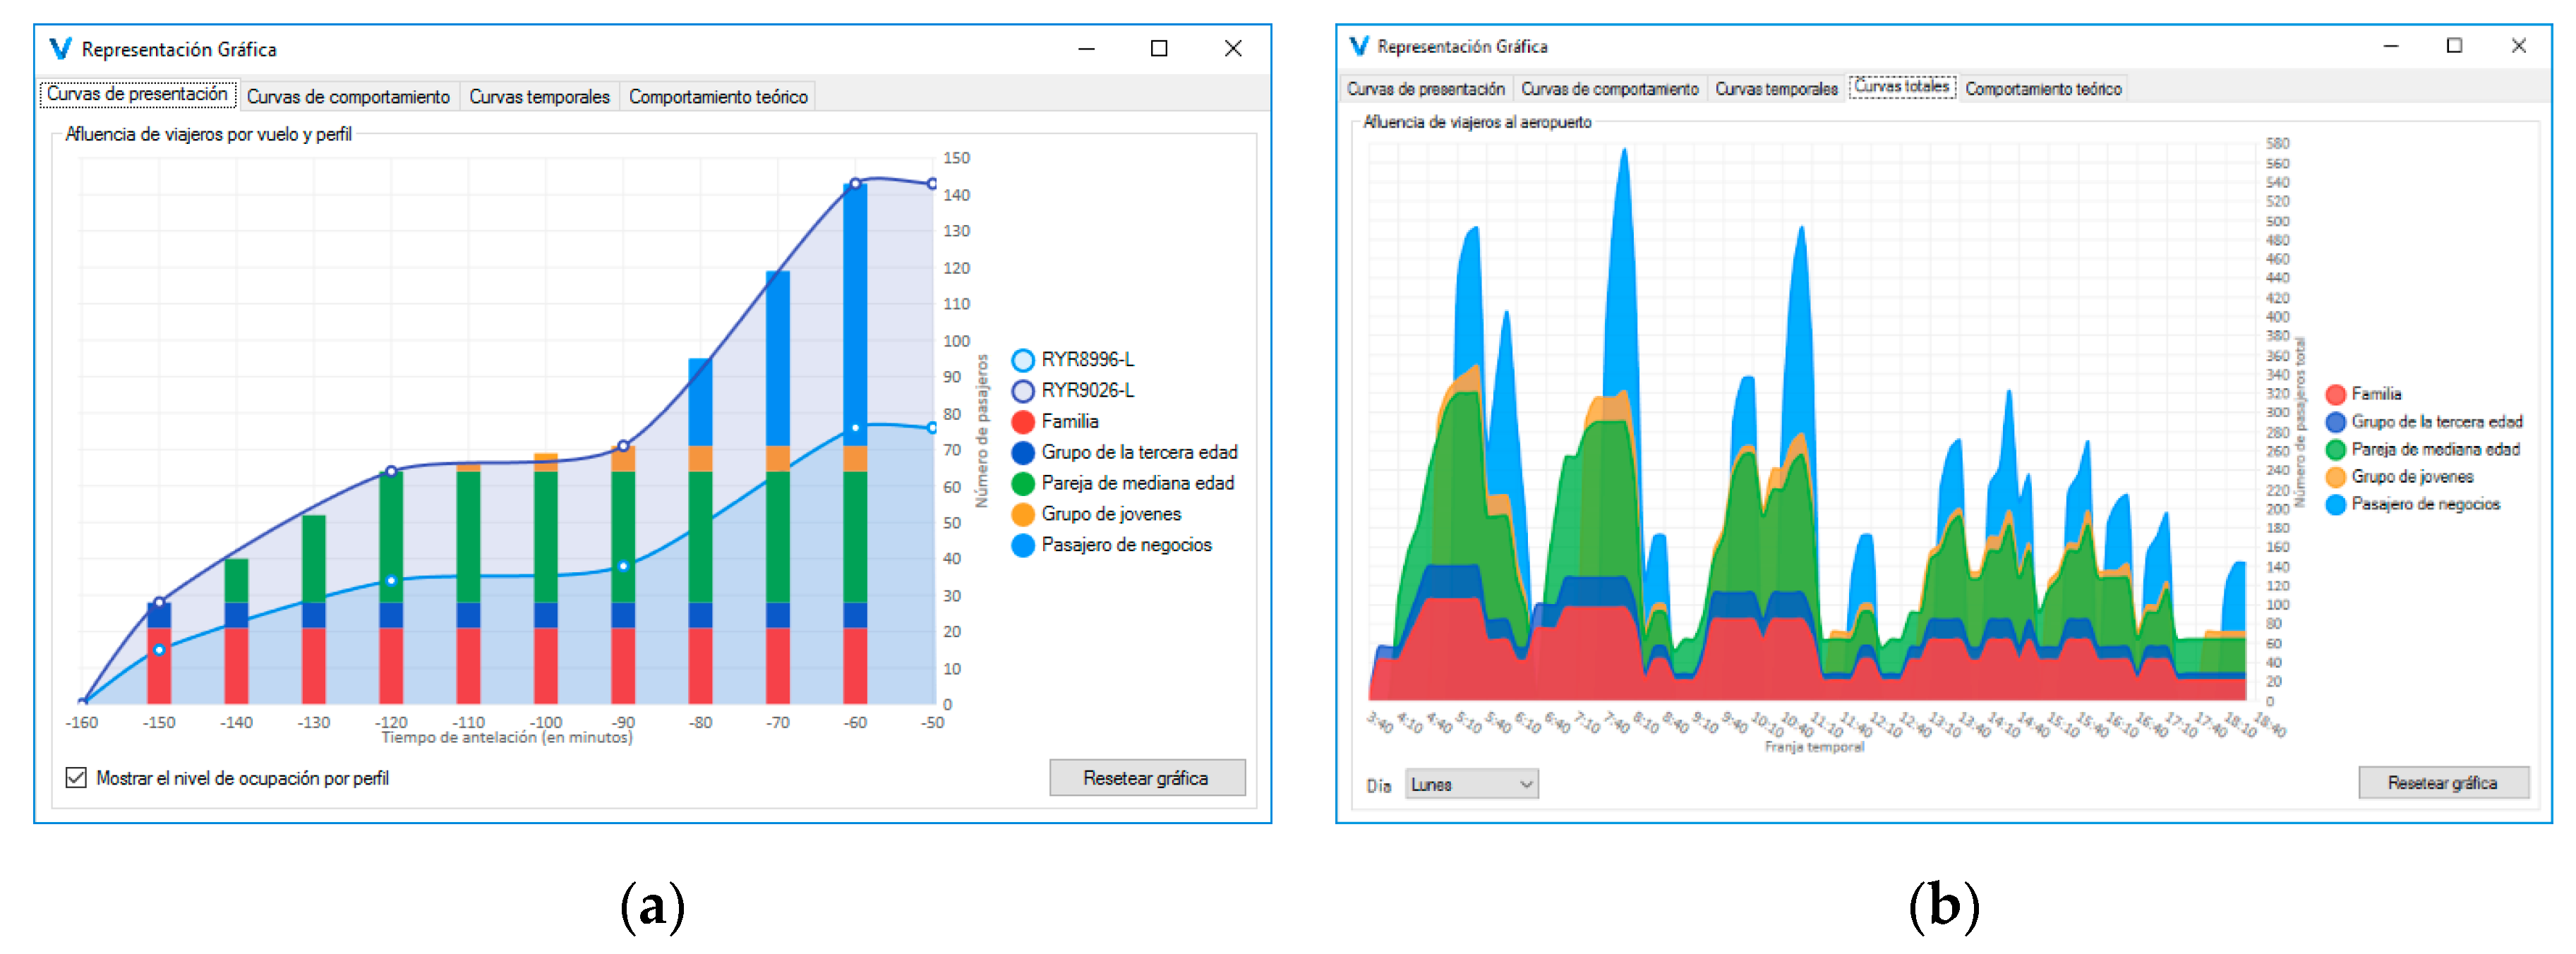
Presentation curves. The purpose of the presentation curves is to graphically display the inflow of travelers in advance to their flight departure time. Or, in the case of the arrivals terminal, the flow of passengers leaving the airport.
Figure 5a shows the number of travelers (Y axis) present at the airport for a given flight with respect to the anticipation time (X axis) for each profile (stacked bars). The simulator takes into account the historical occupancy of each profile on that flight, the number of seats available in the airplane and the average anticipation established for each profile. The graph shows the occupancy level by profile compared to the total occupancy at each instant.
In addition to the previous representation, the tool provides graphs with the daily and cumulative daily presentation curves (
Figure 5b). The difference is that in these two graphs the X axis represents the hours of an entire day in accordance with the established flight plan, allowing to know the number of passengers at the airport at any time of day (regardless of the flight to which they belong).
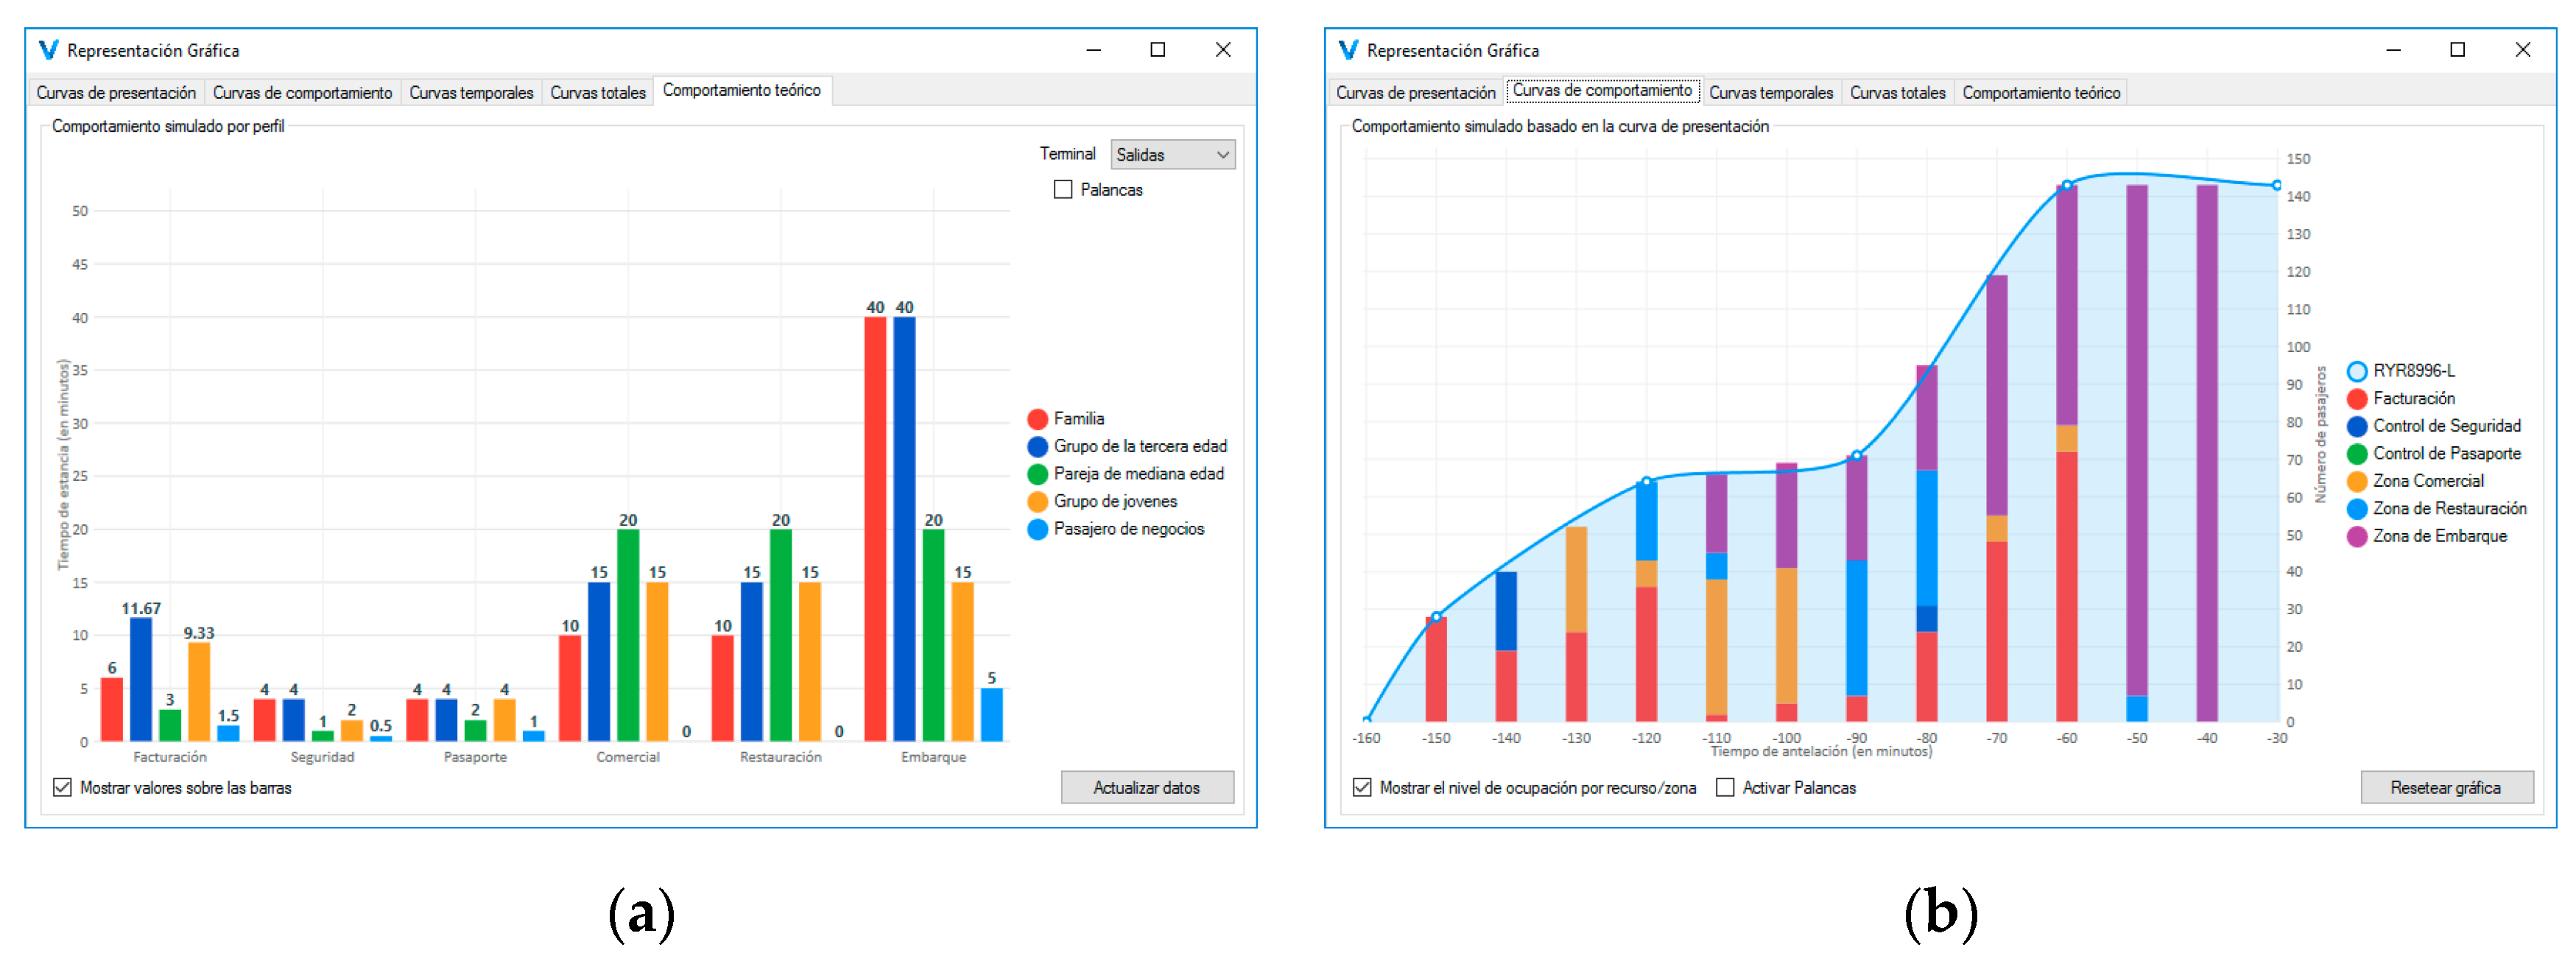
Analysis of theoretical behavior. Descriptive graphs are used to show the behavior of each profile within the airport depending on the processing times per infrastructure resource.
Figure 6a shows the time of stay in minutes (Y axis) for each profile in each predefined area of the airport (X axis). An area is composed of several resources or infrastructures; e.g., the check-in area consists of counters, self-check-in kiosks and luggage delivery machines. Once the toggles are configured and activated, the variations produced on the initial theoretical behavior can be visualized in real time, with variations in the graph in relation to the height of the different bars.
In addition to the previous representation, the tool provides an additional graph with the behavior curve per area and departure time anticipation (
Figure 6b). This graph is analogous to the presentation curve per profile, representing in this case in the bars the occupancy level by area. The graph shows the number of travelers (Y axis) present at the airport for a given flight with respect to the anticipation time (X axis) on each area (stacked bars). The simulator takes into account the occupancy of each profile on that flight, the average anticipation established and the time of stay in minutes for each pair profile/area.
On the other hand, the simulator includes the option to generate reports according to the selections made in the tool at any given time and can be parameterized to show only the desired information. The complete reports consist of four pages, the first two detailing the basic configuration data of the project (resources, profiles and flights selected) and the last two showing the different graphs generated according to said data. These reports can be printed or stored in PDF format.
4. Case Study
It has been decided to validate the operation and check the results provided by the simulator through a real use case. For this particular test case, data from the Girona Airport have been used. Girona Airport or Costa Brava airport IATA (GRO) is the second most important airport in the Barcelona area. It has one main Terminal with two levels. The airport operates with domestic and international flights and has, among other infrastructure resources, 33 check-in desks, 15 boarding gates, 5 baggage reclaim carousels, conference rooms, WiFi, and other services and commodities such as bars, restaurants (6), and shops.
In addition to the infrastructure resources, it has been necessary to gather information about the existing traveler profiles in the airport and its percentage of the total number of travelers. This information has been collected by conducting questionnaires to travelers, thus facilitating their classification within the following profiles: business traveler (A), middle-aged couple (B), family (C), senior citizen group (D) and youngsters group (E).
The last set of key information for the implementation of the simulator is the flight plan. The flight plan collects regular information about the flights scheduled at the airport, including timetables, airline, type of aircraft, number of seats and average occupancy. For this case study, the flight plan corresponding to the summer season of 2017 at the Girona Airport has been incorporated into the simulation tool.
4.1. Description of the Use Case
The objective is to validate the operation of the simulator by expanding the example shown in
Section 2.2, affecting all profiles and areas of the airport. Thus, the set of toggles, weights and process times with which to simulate the change in behavior of the different profiles has been generated. In this case the airport will be affected by the opening of a children’s playground in the restoration area (T
PLAYGROUND) and by the extension of the installation of free WiFi to departure lounge (T
WIFI).
The playground zone directly affects family profile, halving the time spent in the commercial area, and doubling the length of stay in the restoration area. On the other hand, the WiFi extension affects a greater number of profiles, including the family profile, which will modify its time matrix again, but its effect on the juvenile profile is more pronounced, where the stay in the commercial area goes down 90% due to the existence of free WiFi.
The following formulation shows the behavior change associated with the time of stay (TSZ, in minutes) in each area of the airport.
We delimited the vector to the profiles and affected areas, in this case: the commercial area, the restoration area and the departure lounge. Equation (1) shows the change in the behavior vector (BV) for the family profile (C), affected by the influence matrix (IM) implemented for the playground toggle. Equations (2) and (3) shows similar changes in the behavior of different profiles influenced by the WiFi toggle.
4.2. Test Case Results
Once the airport data and behavioral data are entered, we proceed to execute the simulation and to visualize the results provided by the tool, which should agree with the results of the previous formulation. For this, we will use two of the graphs described in
Section 3.
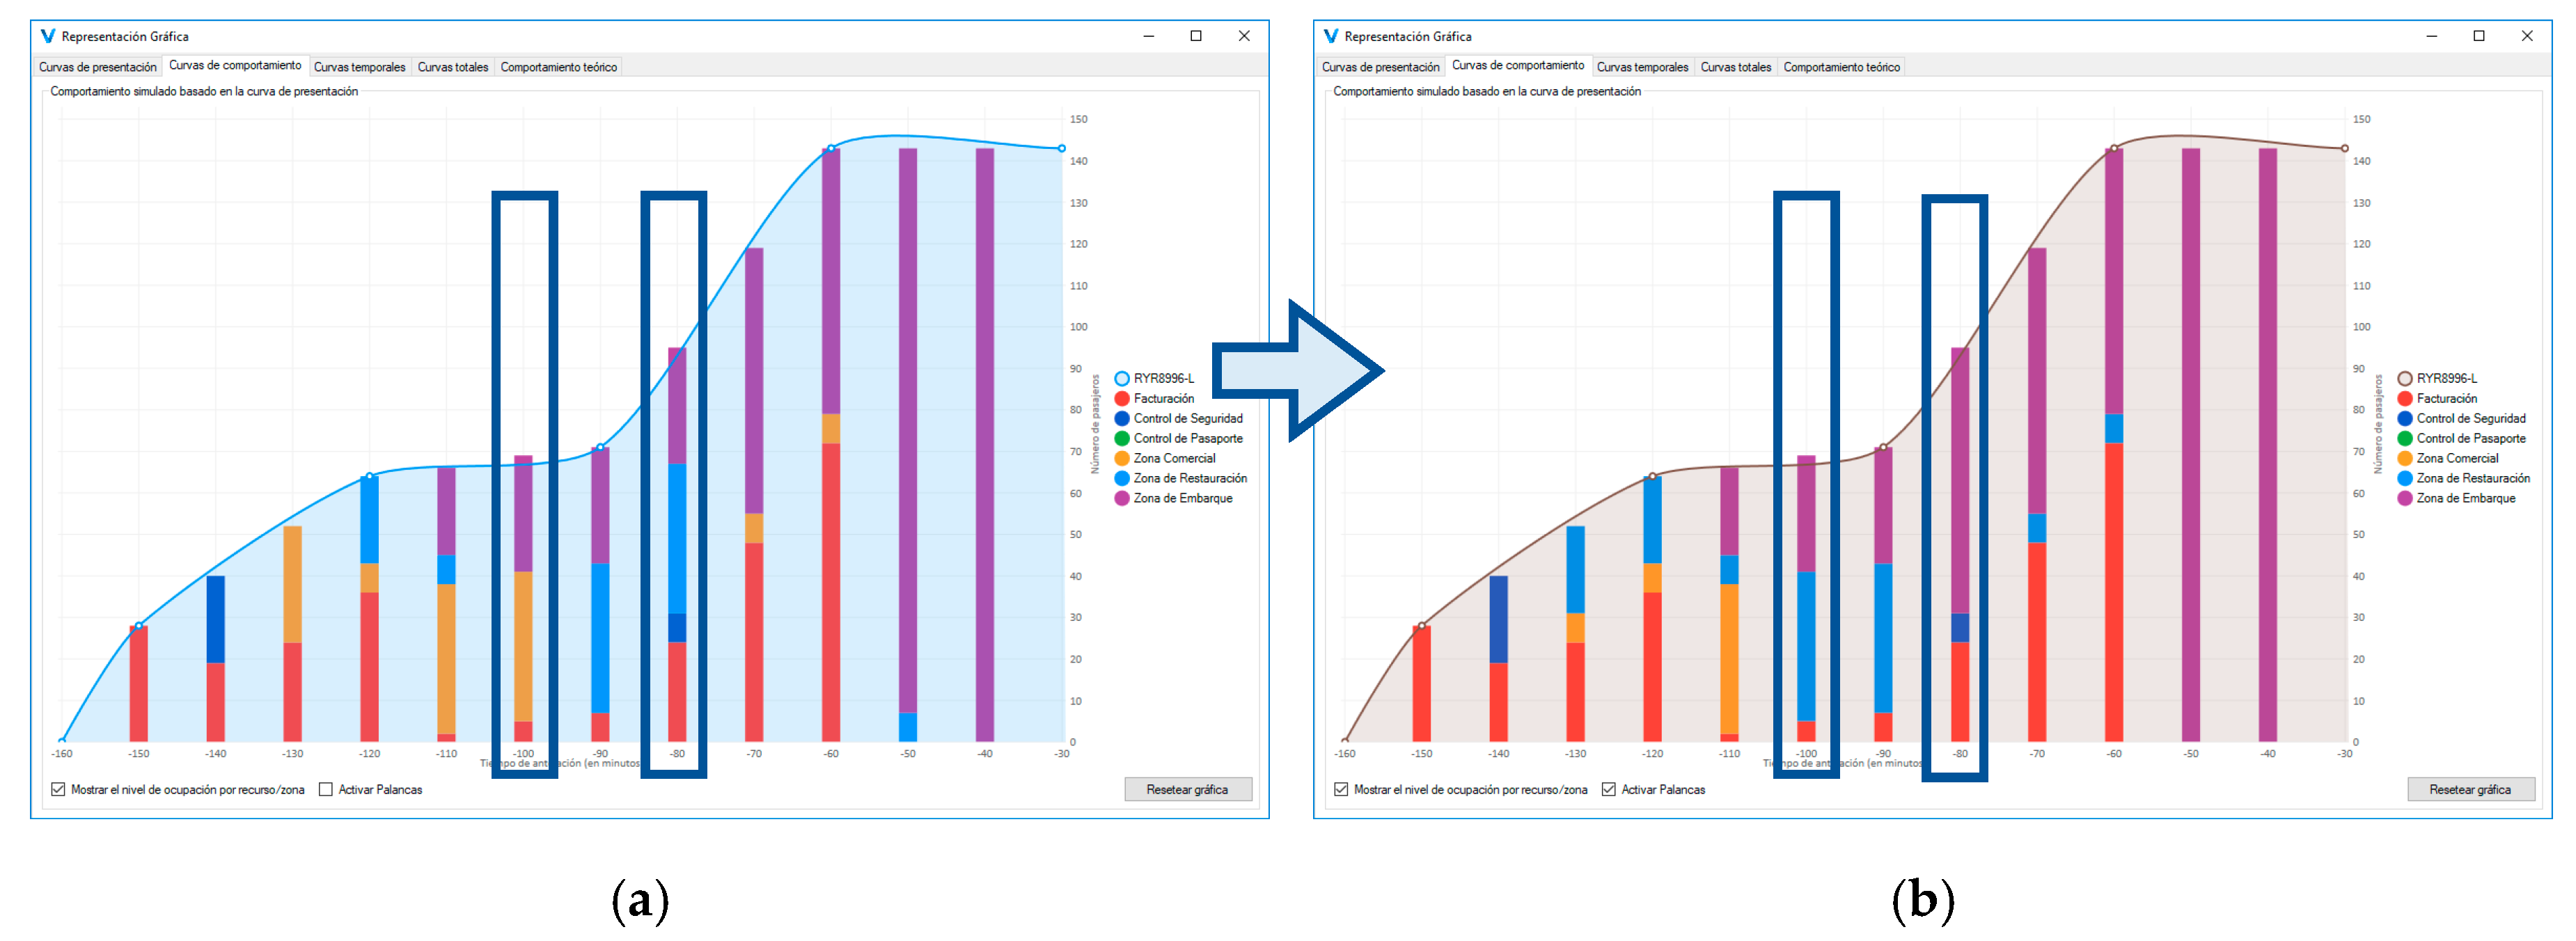
First, the behavior curve (
Figure 7), indicating the total number of people (Y axis) in each zone of the airport (colors of the bars) at a given time prior to flight departure (X axis). An evident variation can be observed in the period between 100 and 80 min before the flight in terms of the number of people present in each zone.
At 80 min from the departure of the flight (first marked area) 52% of passengers who were in the commercial area go to the restoration area. At 100 min for the departure of the flight (second marked area) 38% of passengers who were in the restoration area go directly to the boarding area (purple segment).
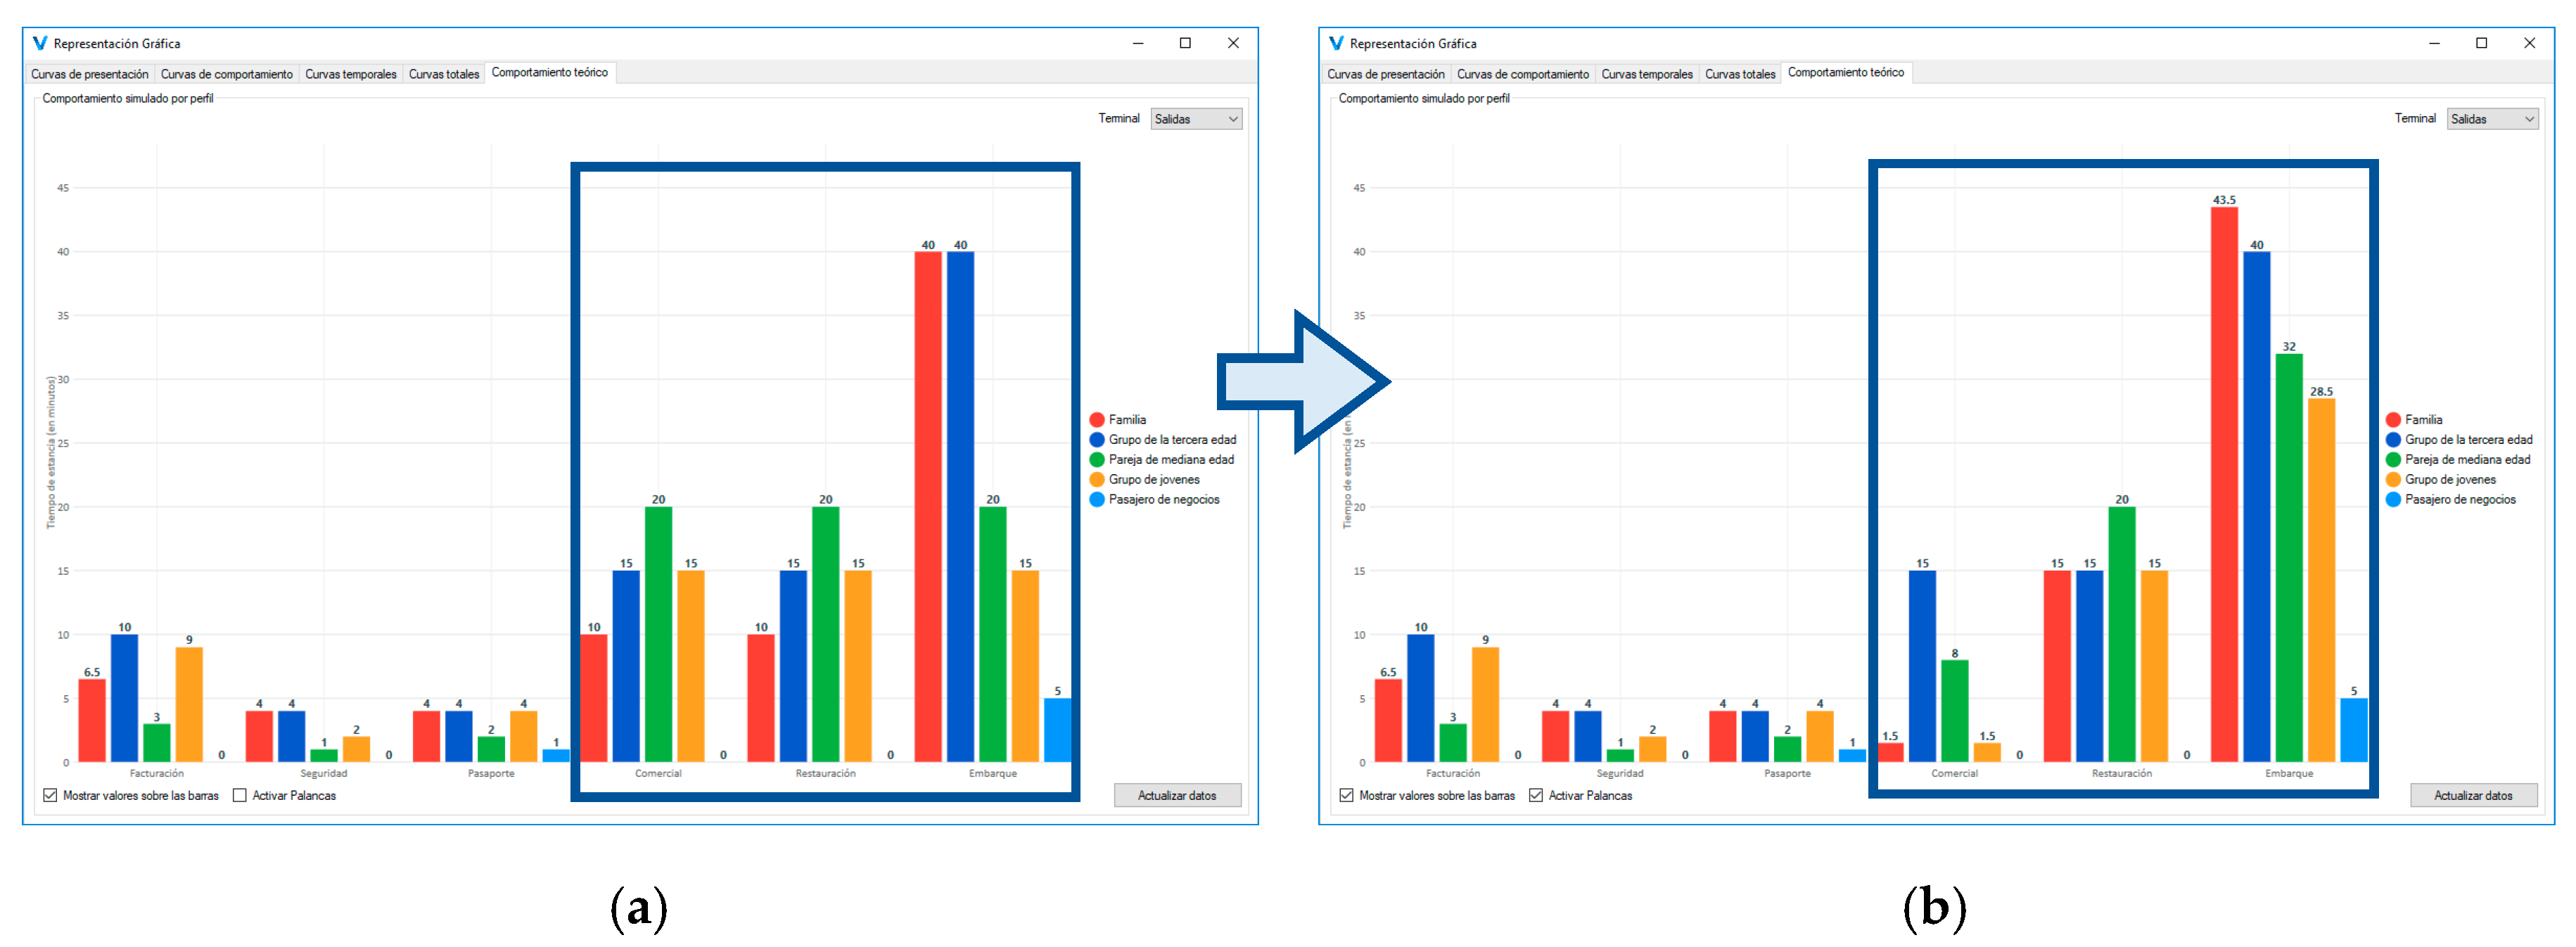
Secondly, the theoretical behavior graph (
Figure 8), directly indicating the total stay times in each of the zones (TSZ) for each profile. When applying the toggles, the result of the previous formulation can be visualized graphically. Thus, there is a significant decrease in the length of stay in the commercial area, especially for family and youth profiles, and an equivalent increase in time divided between the areas of resto-ration (family profile) and boarding.
