Proceeding Paper

Seven-Rod Dielectric Sensor for Determination of Soil Moisture in Small Volumes †

by
Justyna Szerement
1,*,
Aleksandra Woszczyk
1,
Agnieszka Szypłowska
1,
Marcin Kafarski
1,
Arkadiusz Lewandowski
2,
Andrzej Wilczek
1 and
Wojciech Skierucha
1
1
Institute of Agrophysics, Polish Academy of Sciences, Doświadczalna 4, 20-290 Lublin, Poland
2
Institute of Electronic Systems, Warsaw University of Technology, Nowowiejska 15/19, 00-665 Warsaw, Poland
*
Author to whom correspondence should be addressed.
Presented at the 7th International Symposium on Sensor Science, Napoli, Italy, 9–11 May 2019.
Proceedings 2019, 15(1), 49; https://doi.org/10.3390/proceedings2019015049
Published: 22 March 2020
(This article belongs to the Proceedings of 7th International Symposium on Sensor Science)

Abstract

:
The paper presents the performance of a seven-rod dielectric probe for determination of soil dielectric permittivity using FEM simulations as well as FDR and TDR measurements. The volume of the sensitivity zone of the tested probe was assessed basing on the simulations and measurement in liquids. The probe was also tested in two soils, sandy loam and silt loam. The obtained results suggested that the seven-rod probe can be used to accurately measure the dielectric permittivity spectrum in a small sample volume of about 8 cm3 in a frequency range from 20 MHz to 200 MHz.

1. Introduction

Nondestructive and in situ measurements of soil moisture are of fundamental importance to many agricultural applications [1,2]. Therefore, the development of methods for accurate measurement of soil water content is still in the area of interest. Water content may be determined by dielectric sensors using time-domain reflectometry (TDR) and frequency-domain reflectometry (FDR) measurement techniques. The TDR technique allows non-destructive, quick and repetitive measurements of soil moisture but the sensors are generally very expensive [3]. The application of the sensors based on the FDR method could significantly reduce the cost of moisture measurement devices [4].
The aim of the study was to construct, digitally simulate and test a seven-rod probe of a simplified coaxial geometry [5], consisting of a signal conductor surrounded by six ground ones, for dielectric measurement of soil moisture in a small volume for laboratory applications. This work presents (i) FEM (finite element method) simulations of the seven-rod probe to verify sensitivity zone using Ansys HFSS software, (ii) vector network analyzer (VNA) measurements of real part of dielectric permittivity ( ε ) of tested soils using the seven-rod probe in the determined operational frequency range, (iii) transient-state electronic simulations in ADS software used for apparent dielectric permittivity ( ε a ) determination (TDR method), (iv) comparison between ε , ε a and volumetric moisture content from the experiment, (v) determination of the permittivity-moisture content calibration curve and its comparison to the Topp’s equation as the reference.

2. Materials and Methods

Measurement experiments with VNA were performed in laboratory conditions in temperature 20 ± 1 °C in three independent replications. The measurement frequency range was from 1 MHz to 6 GHz.

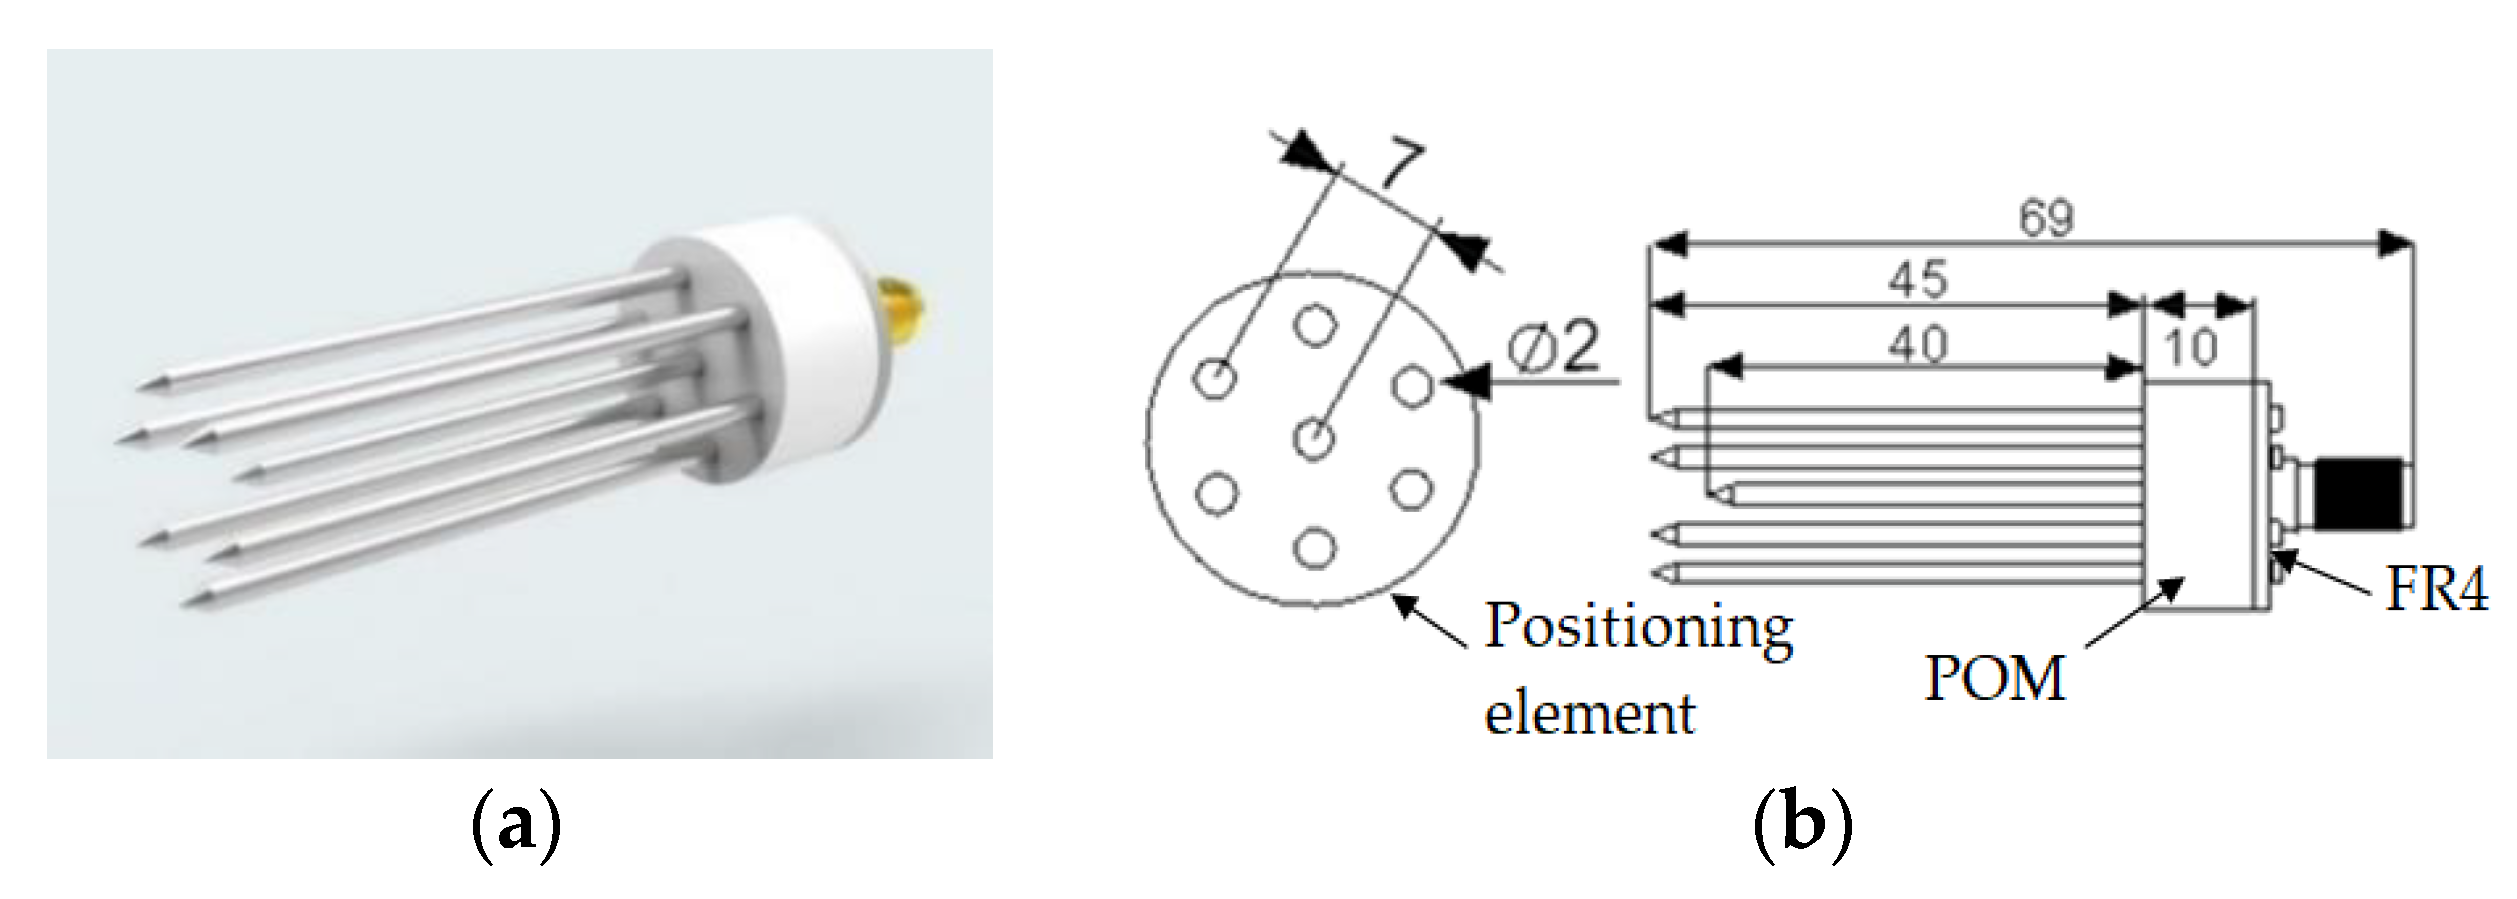
2.1. Determination of the Sensitivity Zone

The dielectric spectra were obtained using a seven-rod probe manufactured at the Laboratory of Dielectric Spectroscopy of the Institute of Agrophysics PAS, Lublin, Poland (Figure 1a). The dimensions of the probe were shown in Figure 1b.
Simulations of the seven-rod probe were carried out using Ansys HFSS software pack, which uses FEM for calculations. The probe was placed inside the containers 70 mm in height and 15, 20, 35, 70 mm in diameter filled with air, distilled water, ethanol and isopropanol. The respective S 11 parameters were determined in the frequency from 1 MHz to 6 GHz. The measurements using the probe prototype (Figure 1a) connected to VNA (Cooper Mountain type R60), inserted into the same liquids and containers with the same geometry were conducted. The conversion from S 11 parameters to complex permittivity ( ε * ) was obtained using bilinear equation:
ε * = c 1 S 11 c 2 c 3 S 11
where the calibration constants c 1 , c 2 , and c 3 are complex numbers determined in the open-water-liquid (OWL) calibration using air, distilled water, and ethanol as the calibration media [6]. The obtained ε of isopropanol (from the simulation and the experiment) was compared with literature available data [7].

2.2. Soil Samples Measurement

The soils of various texture: silt loam (GRT) and sandy loam (SKR) were examined (Table 1).
The experimental setup consisted of the seven-rod probe connected to the VNA and a sample container with diameter of 70 mm and height of 70 mm. The experiment was conducted on soils moisturized with distilled water in order to achieve 6 moisture levels from air dry to saturation. After VNA measurements, volumetric water content was determined for each sample using thermogravimetric method according to PN-ISO 11465: 1999—Polish version. The probe calibration and conversion of S 11 parameters to ε * was performed using the OWL procedure described earlier. The S 11 parameters were imported to the electronic design software (Keysight Advanced Design System—ADS) for further processing in the time domain to receive ε a of the measured soil samples.

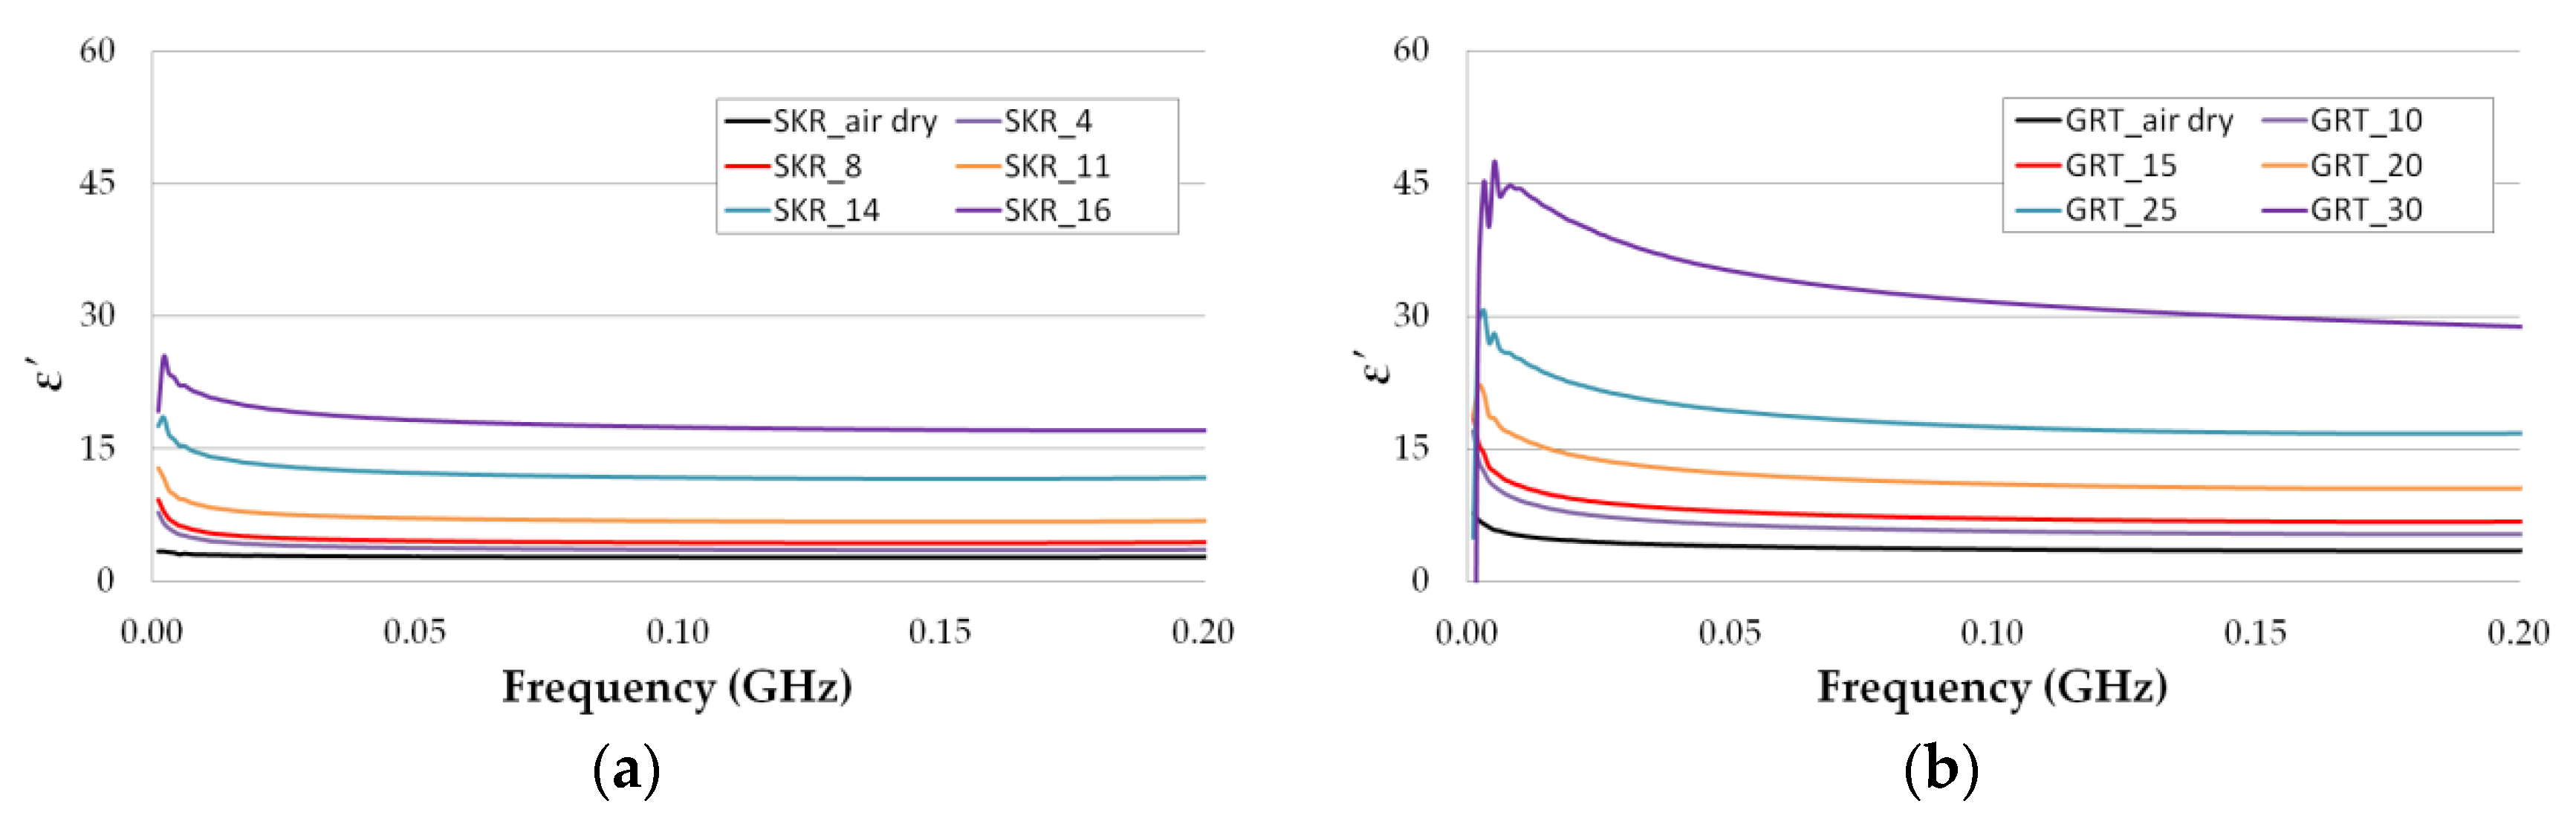
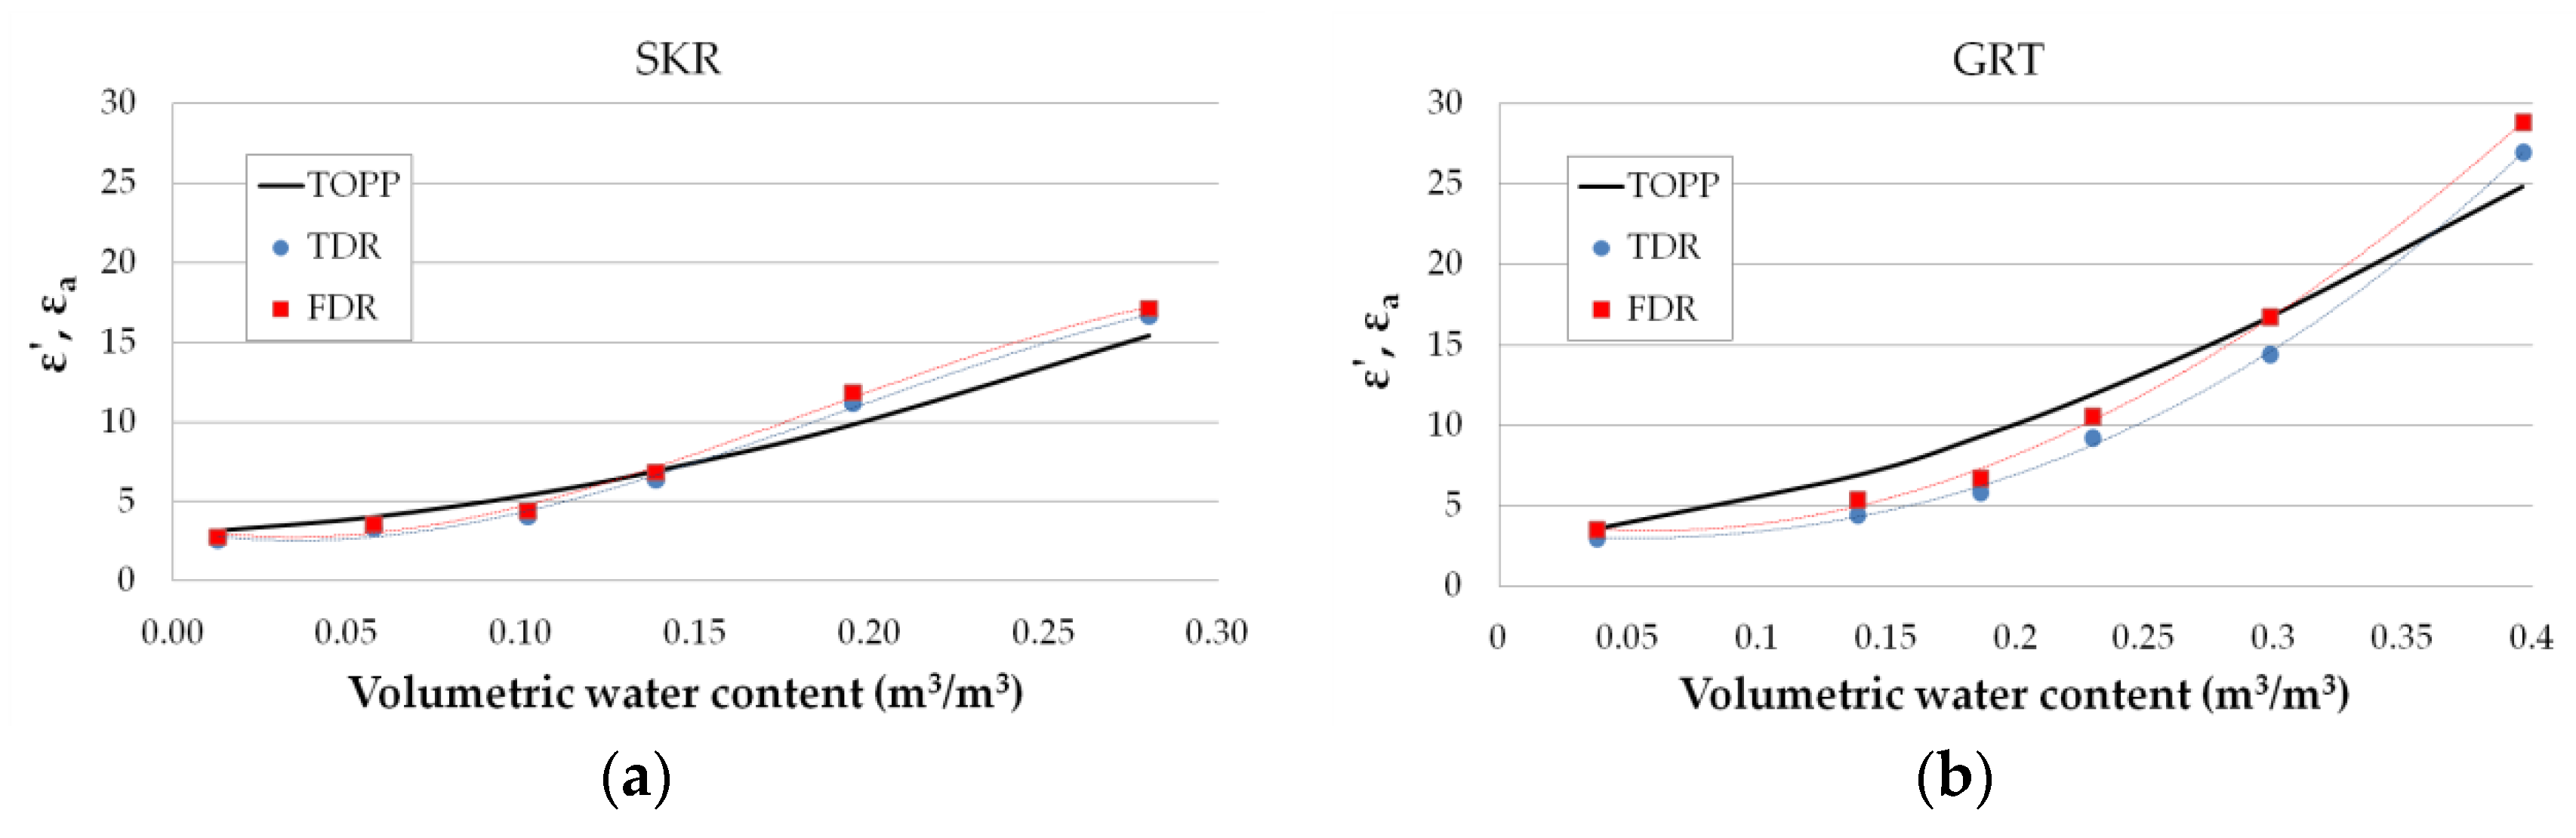
3. Results and Discussion

The results of the simulations showed that the diameter of the container did not affect the measurement of the ε of isopropanol (data not shown). Therefore, the sensitivity zone of the seven-rod sensor corresponded to the volume confined between the six ground conductors (about 8 c m 3 ). The conversion of S 11 parameter to ε * (Equation (1)) gave reliable data in the frequency range from 20 MHz to 200 MHz. To assess the ability of the sensor to measure ε of heterogeneous materials, an measurement experiment was carried out on soil samples and the results are in Figure 2.
The ε increased with increasing water content which is consistent with other studies [8]. The different texture of tested soils were reflected in dielectric spectra. The GRT soil containing more clay and silt fractions was characterized by a higher point of saturation. The dielectric permittivity is strongly related to the soil water content. The relations between ε (FDR), ε a (TDR—ADS simulation) and volumetric moisture content for tested soils were shown in Figure 3. The value of ε a (black solid lines) was calculated from the Topp’s formula [9]:
ε a = 3.03 + 9.3 θ v + 146.0 θ v 2 76.7 θ v 3
The obtained data did not match exactly the Topp’s calibration. The best fit to Topp’s equation was observed for soil characterized by higher sand content (SKR). Roth et al. [10] have observed that the equation proposed by Topp et al. does not fit well for fine textured soils. This may occur due to the increase in the specific surface of the soil with the increase in clay content, which is the reason for significant influence of the adsorbed layer of water. For each soil, the lower value of the permittivity was observed for the data obtained from simulation using ADS (TDR). It was due to the fact that the conversion data from S 11 parameters to time domain was taken from the whole operational frequency range of the probe (from 1 MHz to 6 GHz), not as in case of FDR up to 200 MHz. The time domain ε a data calculated from ADS represent higher frequency values of ε , which are smaller than for 200 MHz. Also, it is possible that at high frequencies the electrical field leaks out of the zone between the sensor rods. This will be investigated in a future study.

4. Conclusions

The obtained data indicated that the geometry of the proposed seven-rod sensor enabled to measure soil moisture in a small volume (about 8 c m 3 ) in the 20–200 MHz frequency range under laboratory conditions. Due to the geometry, the proposed probe can be useful for water content determination also in semi-liquid and liquid materials. In order to extend the operational frequency range, the development of other conversion formulas ε * = f S 11 , dedicated for the presented sensor are planned for future work.

Funding

This research was funded by the National Centre for Research and Development, grant number BIOSTRATEG3/343547/8/NCBR/2017.

References

  1. Jones, S.B.; Blonquist, J.M.; Robinson, D.A.; Rasmussen, V.P.; Or, D. Standardizing characterization of electromagnetic water content. Vadose Zone J. 2005, 4, 1048–1058. [Google Scholar] [CrossRef]
  2. Skierucha, W.; Wilczek, A. A FDR Sensor for Measuring Complex Soil Dielectric Permittivity in the 10–500 MHz Frequency Range. Sensors 2010, 10, 3314–3329. [Google Scholar] [CrossRef] [PubMed]
  3. Skierucha, W.; Wilczek, A.; Szypłowska, A.; Sławiński, C.; Lamorski, K. A TDR-Based Soil Moisture Monitoring System with Simultaneous Measurement of Soil Temperature and Electrical Conductivity. Sensors 2012, 12, 13545–13566. [Google Scholar] [CrossRef] [PubMed]
  4. Robinson, D.A.; Campbell, C.S.; Hopmans, J.W.; Hornbuckle, B.K.; Jones, S.B.; Knight, R.; Ogden, F.; Selker, J.; Wendroth, O. Soil Moisture Measurement for Ecological and Hydrological Watershed-Scale Observatories: A Review. Vadose Zone J. 2008, 7, 358–389. [Google Scholar] [CrossRef]
  5. Xu, J.; Ma, X.; Logsdon, S.D.; Horton, R. Short, Multineedle Frequency Domain Reflectometry Sensor Suitable for Measuring Soil Water Content. Soil Sci. Soc. Am. J. 2012, 76, 1929–1937. [Google Scholar] [CrossRef]
  6. Kafarski, M.; Wilczek, A.; Szypłowska, A.; Lewandowski, A.; Pieczywek, P.; Janik, G.; Skierucha, W. Evaluation of Apple Maturity with Two Types of Dielectric Probes. Sensors 2018, 18, 121. [Google Scholar] [CrossRef] [PubMed]
  7. Buckley, F.; Maryott, A.A. Table of Dielectric Dispersion Data for Pure Liquids and Dilute Solutions; Bureau of Standards Circular: Washington, DC, USA, 1958; pp. 1–101. [Google Scholar]
  8. Liu, C.; Zhang, L.; Peng, J.; Srinivasakannan, C.; Liu, B.; Xia, H.; Zhou, J.; Xu, L. Temperature and moisture dependence of the dielectric properties of silica sand. J. Microw. Power Electromagn. Energy 2013, 47, 199–209. [Google Scholar] [CrossRef] [PubMed]
  9. Topp, G.C.; Davis, J.L.; Annan, A.P. Electromagnetic determination of soil water content: Measurements in coaxial transmission lines. Water Resour. Res. 1980, 16, 574–582. [Google Scholar] [CrossRef]
  10. Roth, K.; Schulin, R.; Fluhler, H.; Attinger, W. Calibration of time domain reflectometry for water content measurement using a composite dieletric approach. Water Resour. Res. 1990, 26, 2267–2273. [Google Scholar]
Figure 1. Tested seven-rod probe and the elements of the measurement setup; (a) a probe, (b) respective dimensions of the probe (dimensions in mm).
Proceedings 15 00049 g001
Figure 2. The real part of complex dielectric permittivity of SKR (a) GRT (b) soil samples with different water content over the frequency range from 1 MHz to 200 MHz. The name of sample consist of the type of soil and the mass of water per 100 g of dry soil in a given sample. Three VNA measurements from various soil samples were performed for each moisture content. The curves present average values with the maximum value of the standard error ± 3%.
Proceedings 15 00049 g002
Figure 3. Relations between ε (FDR), ε a (TDR—ADS simulation) and volumetric water content for SKR and GRT soils for frequency 200 MHz (FDR) and range of frequency from 1 MHz to 6 GHZ (TDR). Black solid lines correspond to the Topp’s equation.
Proceedings 15 00049 g003
Table 1. Soil texture.
Texture [%]
ClaySiltSand
SKR3.728.867.5
GRT10.176.513.4

