Herein, formaldehyde sensors based on gallium-doped In2O3 inverse opal (IO-(GaxIn1-x)2O3) microspheres were purposefully prepared by simple ultrasonic spray pyrolysis method combined with self-assembly sulfonated polystyrene spheres template. The well-aligned inverse opal structure, with three different-sized pores, plays dual roles of accelerating the diffusion of gas molecules and providing more active sites. The Ga substitutional doing can alter the electronic energy level structure of (GaxIn1-x)2O3, leading to the elevation of Fermi level and the modulation of band gap closed to a suitable value (3.90 eV), hence, effectively optimizing the oxidative catalytic activity for preferential CH2O oxidation and increasing the amount of absorbed oxygen. More importantly, the gas selectivity could be controlled by varying the energy level of adsorbed oxygen. Accordingly, the IO-(Ga0.2In0.8)2O3 microspheres sensor showed high response toward formaldehyde with fast response and recovery speeds, and ultralow detection limit (50 ppb). Our findings finally offer implications for designing Fermi level-tailorable semiconductor nanomaterials for the control of selectivity and monitoring indoor air pollutant.
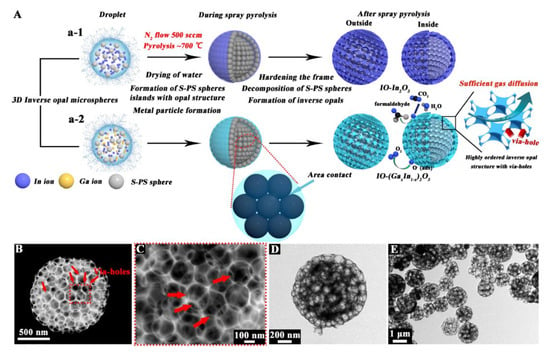
Figure 1A illustrated the process of fabrication of inverse opal microspheres. As shown in Figure 1(B,C), the interconnected and well-aligned 3D inverse opal skeletons were observed in IO-(Ga0.2In0.8)2O3, and the sample yielded a long-range ordered hexagonal arrangement of the inverse opal microsphere structure. And, it also could be found that the individual inverse opal microsphere was assembled by packed small nanoparticles. Accordingly, due to the closer distance between the adjacent S-PS spheres (increase in contact area), the IO-(Ga0.2In0.8)2O3 microsphere displayed additional viaholes among the oxide side walls (as indicated by the red arrow in Figure 1C). As shown in Figure 1D,E, a highly aligned inverse opal structure was found in every IO-(Ga0.2In0.8)2O3 microsphere, and it could be found that the IO morphology remained after Ga doping. Besides, all spherical pores (mean pore size, ∼160 nm) reflecting the shape of S-PS spheres were well developed and uniform inside the microspheres, and the oxide side walls formed stably between these pore walls, indicating that the inverse opal structure accumulated by many S-PS spheres could be retained even after decomposition of the S-PS sphere templates.

Figure 1.
(A) Schemes illustrating the preparation of (a-1) inverse opal-In2O3 (IO-In2O3) microspheres, (a-2) Ga-doped IO-In2O3 microspheres (IO-(Ga0.2In0.8)2O3); (B and C) SEM and (D and E) TEM images of IO-(Ga0.2In0.8)2O3 microspheres.
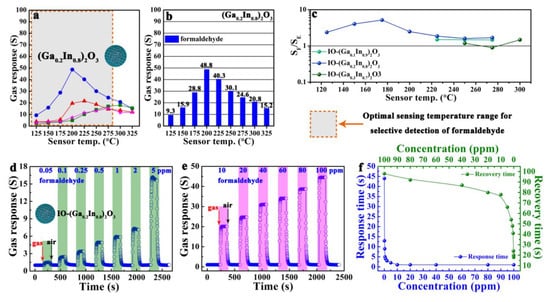
As shown in Figure 2a,b, the IO-(Ga0.2In0.8)2O3 sensor showed the highest formaldehyde response, and reached the maximum (Ra/Rg = 48.8-100 ppm formaldehyde) at the optimal operating temperature of 200 °C. The orange dotted boxes in Figure 2 highlighted the optimal sensing temperature ranges of the IO-(Ga0.2In0.8)2O3 sensor for selective detection of formaldehyde. The selectivity to formaldehyde over ethanol interference (SF/SE) of the IO-(GaxIn1-x)2O3 (x = 0.1, 0.2, and 0.3) sensors were calculated (Figure 2c). Note that the SF/SE value of the IO-(Ga0.2In0.8)2O3 sensor was significantly higher than that of the IO-(Ga0.1In0.9)2O3 and IO-(Ga0.3In0.7)2O3 sensors. The gas-sensing transients of the IO-(Ga0.2In0.8)2O3 sensor toward 0.05-100 ppm formaldehyde at 200 °C are shown in Figure 2(d, e). Obviously, the IO-(Ga0.2In0.8)2O3 sensor possessed excellent response-recovery kinetic characteristics in a broad formaldehyde concentration range. And it can be observed that the IO-(Ga0.2In0.8)2O3 sensor still had a response of 1.53 when the formaldehyde concentration was as low as 50 ppb. As shown in Figure 2f, for the IO-(Ga0.2In0.8)2O3 sensor, the response time tended to decrease with increasing formaldehyde concentration, and the sensor showed a long response time at low formaldehyde concentration. However, the recovery time tended to increase when the gas concentration and gas response increased, which emanated mainly from the sluggish surface kinetics of adsorption, dissociation, and ionization of oxygen during the recovery.

Figure 2.
Gas responses (S) of the (a, b) IO-(Ga0.2In0.8)2O3 sensor to 100 ppm of various gases at 125–325 °C. (c) formaldehyde selectivity (Sformaldehyde/Sethanol, SF/SE) of the IO-(Ga0.2In0.8)2O3 sensor at 125–325 °C. Formaldehyde-sensing characteristics of the IO-(Ga0.2In0.8)2O3 sensor at 200 °C: (d, e) dynamic sensing transients to 0.05–100 ppm formaldehyde, and (f) response/recovery times toward formaldehyde in the concentration range of 0.05–100 ppm.
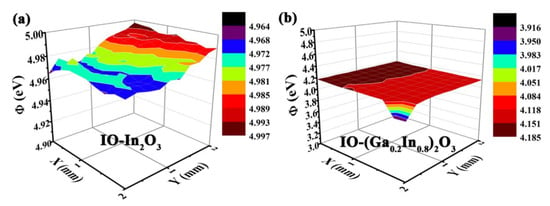
As shown in Figure 3, the work function area maps recorded for pure In2O3 and Ga-doped In2O3 are evaluated by employing the Kelvin probe measurements. According to the measured results of the work function values of different IO-(GaxIn1−x)2O3 (x = 0 and 0.2) samples, it can be concluded that the Ga doping will cause the elevation of the Fermi level in Ga-doped In2O3 samples.

Figure 3.
(a,b) work function area scan recorded for IO-(GaxIn1-x)2O3 (x = 0 and 0.2) samples via Kelvin probe measurements.
Funding
This research was funded by the National Key Research and Development Program (No. 2016YFC0207300), National Nature Science Foundation of China (Nos. 61722305, 61833006, 61520106003), Science and Technology Development Program of Jilin Province (No. 20170520162JH), China Postdoctoral Science Foundation funded project Nos. 2017T100208 and 2015M580247, and Graduate Interdisciplinary Research Fund of Jilin University (No. 10183201833).
Conflicts of Interest
The authors declare no conflict of interest.
Publisher’s Note: MDPI stays neutral with regard to jurisdictional claims in published maps and institutional affiliations. |
© 2019 by the authors. Licensee MDPI, Basel, Switzerland. This article is an open access article distributed under the terms and conditions of the Creative Commons Attribution (CC BY) license (https://creativecommons.org/licenses/by/4.0/).