Abstract
Vibro-thermography is an effective nondestructive testing technique for detecting closed defects like cracks and delaminations through frictional heat generated under ultrasonic excitation. However, its accuracy is often reduced by standing wave patterns that create periodic temperature artifacts in non-defective areas, leading to false positives. To overcome this, we propose an image processing approach using 2D Fourier Transform (2D-FFT) to reduce SW-induced patterns in the frequency domain. This enhances defect visibility by suppressing unwanted heat signatures. The method is evaluated on a cracked PMMA plate and a hollow tube of the same material.
1. Introduction
Active thermography (AT) is a widely used nondestructive testing and evaluation method applied in the aerospace and automotive [1], civil engineering [2], and cultural heritage monitoring industries [3], to name just a few. AT involves applying a heat stimulus to a sample to break its thermal equilibrium. As heat diffuses, an IR camera records the surface temperature evolution. Defects like cracks or voids appear as regions with abnormal temperatures compared to their surroundings [4]. Heat can be delivered by various sources, typically halogen lamps, lasers, flash heads, or LEDs. Alternatively, methods like eddy-current or frictional heating from mechanical vibrations can be used [5]. Ultrasound-excited AT—vibro-thermography (VT)—leverages frictional heating at defect sites to detect closed defects such as cracks and delaminations [6,7]. However, VT often suffers from standing wave (SW) patterns that create periodic temperature artifacts, causing false positives [8]. Existing solutions like frames averaging are often inadequate [9]. We propose an automated image processing method using 2D Fourier Transform (2D-FFT) to isolate and remove SW patterns in the frequency domain, preserving true defect signals. The approach is validated on cracked CFRP and PMMA samples using both qualitative and quantitative metrics.
2. Vibro-Thermography Fundamentals and SWs Pattern Problem
VT operates on two primary principles. First of all, defects within a material have different elastic characteristics compared to the surrounding intact areas. This difference leads to increased acoustic damping, and thus greater heat generation in the defective regions. Secondly, defects alter the material’s thermal properties, which in turn affects heat flow through the sample. These combined effects make defects appear as temperature irregularities, which can be detected by monitoring the sample surface temperature via an IR camera. Furthermore, when a time-varying stress is applied to a sample, the resulting mechanical vibrations are dampened during their propagation, and this loss is converted into heat. This conversion is the result of two effects, namely the thermoelastic and hysteresis (or loss angle), , with and being complex constants denoting the thermoelastic and hysteresis effects, respectively. In general, a good thermal signal can be obtained from polymers as they provide high acoustic damping. In addition, the thermal conductivity of such materials is relatively low, so that acoustic energy dissipated at defects sites remains localized, aiding, in turn, their detection. Frictional rubbing between contacting asperities is a good example of such a localization effect [6].
However, considering the ultrasonic excitation frequency range usually employed in VT, the size and thickness of the tested specimens, and their shape, standing waves (SWs) might be triggered and established, which results in undesired heat spots at locations corresponding to the SW antinodes. As a result, the faithful detection of potential defects can be hindered by such heat patterns, especially when their thermal fingerprints are similar, or when these are superimposed (an example is shown in Figure 1).
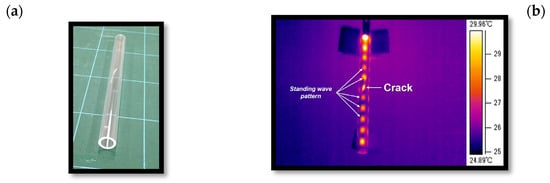
Figure 1.
(a) Picture of a cracked PMMA hollow cylinder; (b) thermogram obtained from VT inspection. The detection of the crack is partially hindered by the SW heat pattern.
3. Proposed Algorithm
The pivot of the proposed algorithm is that SW-induced heat patterns manifest, in general, as relatively low-frequency modulations in thermograms, in contrast to the typically higher-frequency components associated with defect-induced thermal signatures. Moreover, they are often oriented along a distinct spatial direction. Thus, they can be separated—filtered—from each other if their thermal signatures are compared in the wavevector domain using 2D Fast Fourier Transform . To further aid this comparison, detrending, a spatial domain, is implemented as a pre-processing step using a polynomial surface fitting.
3.1. Pre-Processing: Polynomial Surface Fitting for Detrending
Thermograms are a series of IR images captured at different time instants . To remove low-frequency spatial trends, which are mainly due to inhomogeneous heating across the sample, a 2D polynomial surface of degree is fitted to each frame t. To achieve this, a set of minima along each row are extracted:
Then, a polynomial basis is constructed, such that
with coefficients by solving the normal equations in the least-square sense:
with A being the model matrix constructed from the spatial coordinates ( of the detected minima and a corresponding observation vector containing their intensity values (see Equation (1)). The detrended data are then obtained as follows:
3.2. Frequency Domain Analysis and Adaptive Masking
A specific frame captured at time is considered here, i.e., , which is one frame at which a given defect is highly visible. Two regions of interest (ROI) are then manually selected, i.e., a background ROI () that is a pixel area showing the SW heating pattern and one on the defect (). Both ROIs are then zero-padded before computing their 2D-FFTs up to the pixel dimensions of the full frame, and , with and v being the spatial frequency coordinate. To identify how the spectral energy is distributed radially, is computed from as follows:
with , with () denoting the center coordinates of the frequency domain. Then, the maximum of is identified, i.e., where the signal energy peaks and an annular region of an arbitrary width is defined around it with an inner radius and outer radius . This initial annular mask is then adapted to spot the differences between the two ROIs by computing and obtaining the refined binary mask suppression as follows:
with T being a percentile threshold arbitrarily set to 70%. Additionally, a morphological dilation can be applied to to ensure a comprehensive suppression of SWs, especially when the pattern is not spatially aligned with the defect signature. Finally, the filtered frames are obtained by .
4. Results and Conclusions
This experimental setup comprises an ultrasonic welder (HW-D250H-28, Nippon Avionics Co., Ltd., Yokohama, Japan), with an ultrasonic horn attached to the specimen surface, exciting it with a 28 kHz ultrasound wave. The surface temperature distribution during the vibration was recorded using an infrared camera (A315, FLIR). Two samples have been inspected, i.e., the PMMA cylinder shown in Figure 1 and a cracked PMMA plate (see [9]). The qualitative results of the algorithm are shown in Figure 2. The signal-to-noise ratio has also been computed as , and this is shown in Table 1.
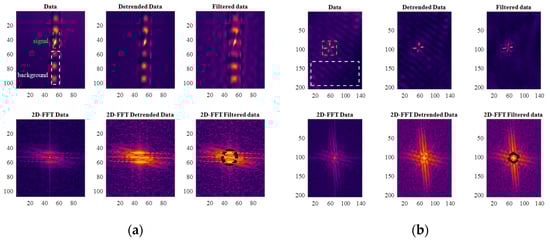
Figure 2.
(a) Series of thermograms (top row) showing the steps of the filtering algorithms, the selected pixel areas, and the obtained results for the PMMA hollow cylinder, together with the corresponding 2D-FFTs; (b) same as (a) but for the PMMA plate.

Table 1.
SNR values.
It can be concluded that the suppression mask (black circular masks) enhances the defect detection, making the whole length of the crack visible for the cylinder specimen, while for the plate specimen, this leads to a dramatic reduction in the standing wave pattern. It should be noted that removing the SW pattern is more difficult for the cylinder specimen than for the plate specimen; the crack signature is on top of the heat pattern, connecting two of the heat spots. This can be appreciated in the computed SNRs.
Author Contributions
Conceptualization, S.L. and M.I.; methodology, M.I., H.N., S.L., M.R. and R.Z.; software, S.L. and R.Z.; validation, M.I., H.N., S.L., M.R. and R.Z.; investigation S.L. and M.I.; data curation, S.L.; writing—original draft preparation, S.L.; writing—review and editing, M.I., H.N., S.L., M.R. and R.Z.; visualization, S.L.; All authors have read and agreed to the published version of the manuscript.
Funding
This research was supported by the Japan Society for the Promotion of Science (JSPS) KAKENHI Grant Number JP 21K04550.
Institutional Review Board Statement
Not applicable.
Informed Consent Statement
Not applicable.
Data Availability Statement
Data will be made available from the authors upon reasonable request.
Acknowledgments
Stefano Laureti acknowledges the EU funded MSCA-DN-2022-01 “MetacMed” project (GA n°101119738) for financial support (www.metacmed.eu).
Conflicts of Interest
The authors declare no conflicts of interest.
References
- Hung, Y.; Chen, Y.; Ng, S.; Liu, L.; Huang, Y.; Luk, B.; Ip, R.; Wu, C.; Chung, P. Review and comparison of shearography and active thermography for nondestructive evaluation. Mater. Sci. Eng. R Rep. 2009, 64, 73–112. [Google Scholar] [CrossRef]
- Milovanović, B.; Banjad Pečur, I. Review of active IR thermography for detection and characterization of defects in reinforced concrete. J. Imaging 2016, 2, 11. [Google Scholar] [CrossRef]
- Laureti, S.; Sfarra, S.; Malekmohammadi, H.; Burrascano, P.; Hutchins, D.; Senni, L.; Silipigni, G.; Maldague, X.; Ricci, M. The use of pulse-compression thermography for detecting defects in paintings. Ndt Int. 2018, 98, 147–154. [Google Scholar] [CrossRef]
- Maldague, X. Applications of infrared thermography in nondestructive evaluation. In Trends in Optical Nondestructive Testing; Elsevier: Amsterdam, The Netherlands, 2000; pp. 591–609. [Google Scholar]
- Ciampa, F.; Mahmoodi, P.; Pinto, F.; Meo, M. Recent advances in active infrared thermography for non-destructive testing of aerospace components. Sensors 2018, 18, 609. [Google Scholar] [CrossRef] [PubMed]
- Rantala, J.; Wu, D.; Busse, G. Amplitude-modulated lock-in vibrothermography for NDE of polymers and composites. Res. Nondestruct. Eval. 1996, 7, 215–228. [Google Scholar] [CrossRef]
- Renshaw, J.; Chen, J.C.; Holland, S.D.; Thompson, R.B. The sources of heat generation in vibrothermography. Ndt Int. 2011, 44, 736–739. [Google Scholar] [CrossRef]
- Ishikawa, M.; Maeda, R.; Nishino, H.; Koyama, M.; Fukui, R. Waves causing undesired heat pattern detected via ultrasound-excited active thermography. Infrared Phys. Technol. 2025, 145, 105652. [Google Scholar] [CrossRef]
- Takahashi, S.; Ishikawa, M.; Nishino, H.; Koyama, M.; Fukui, R. An Examination of a Method to Reduce the Effect of Standing-Wave Heat Generation in Ultrasound-Excited Thermography Inspection. Eng. Proc. 2023, 51, 22. [Google Scholar]
Disclaimer/Publisher’s Note: The statements, opinions and data contained in all publications are solely those of the individual author(s) and contributor(s) and not of MDPI and/or the editor(s). MDPI and/or the editor(s) disclaim responsibility for any injury to people or property resulting from any ideas, methods, instructions or products referred to in the content. |
© 2025 by the authors. Licensee MDPI, Basel, Switzerland. This article is an open access article distributed under the terms and conditions of the Creative Commons Attribution (CC BY) license (https://creativecommons.org/licenses/by/4.0/).