Non-Destructive Testing and Evaluation (NDT & E) plays a vital role in the inspection of wide varieties of materials without influencing their future serviceability. Among the widely used NDT&E techniques such as Ultrasonic Testing, Radiographic Testing, Eddy Current Testing, and Magnetic Particle Inspection, Infrared Thermography gained importance due to its inherent merits. However, NDT & E demands a safe, remote, fast, quantitative inspection approach which can be easily deployed for on-field inspection services.
Infrared Thermography involves mapping of the thermal profile over the object under inspection to reveal its surface and sub-surface features [
1]. This can be implemented either in a passive or in an active approach. Even though passive approach has several merits such as being simple, fast, and easy to deploy in field inspection, it has a major limitation in providing quantitative information regarding the sub-surface features of smaller spatial dimensions, especially those located deep inside the test object. To identify these types of smaller and deeper sub-surface features along with their quantitative details with enough detection sensitivity, active thermography is preferred. In this former approach, an active thermal stimulus is imposed on to the test object to probe the thermal waves with a predefined amplitude and bandwidth. Due to its predefined imposed thermal response, obtaining reliable quantitative information about the sub-surface features is possible.
Among the widely used active thermographic approaches, pulse-based thermographic methods and modulated thermographic approaches are more prominent. Due to limitations like shallow probing depth, the need for high peak power in pulse-based methods, and the repetitive testing required at different frequencies in lock-in thermography, these techniques are less suitable for applications that require continuous depth scanning using low-to-medium peak power sources within a moderate experimentation time. These limitations can be overcome by adopting the recently proposed Frequency-Modulated Thermal Wave Imaging (FMTWI) approaches with pulse compression favorable correlation-based matched filter post-processing [
2].
This present work highlights the capabilities of the FMTWI technique with a correlation-based post-processing approach for NDT&E of various materials such as steel and sandwich materials for inspection to identify the sub-surface anomalies/interface bond quality. The obtained results from various post-processing approaches such as frequency domain phase (FDP), time domain phase (TDP), and cross-correlation coefficient (CCC) have been considered based on their superiority while detecting the sub-surface defects [
3].
Metal and sandwich materials are used in the experimental investigation which are commonly utilized in the shipbuilding, automotive, and aerospace industries [
4,
5,
6].
Experiments have been carried out and thermal data has been acquired during the experimentation for pulse, lock-in, Frequency-Modulated Thermal Wave Imaging and other coded excitation schemes using the active thermal imaging system developed by InfraRed Vision and Automation Pvt. Ltd., Rupnagar, Punjab, India, along with state-of-the-art associated post-processing software. Two high-intensity (each 1200 W) Light-Emitting Diode (LED) lamps were used to impose predefined incident heat flux over the sample under examination. The sample was placed 1 m away from the lamps to ensure uniform heating across the surface. Lamp intensity was modulated via a source control unit for the specific adopted excitation scheme.
Thermal response was captured using a FLIR A655sc uncooled infrared camera (Wilsonville, OR, USA), offering a spatial resolution of 640 × 480 pixels and operating within a spectral range of 8 µm to 12 µm in the far-infrared region. The camera monitors the surface temperature variations across the sample and acquired the thermal response at a rate of 25 frames per second (fps), providing detailed temporal and spatial thermal data for post-analysis. Post-analysis on the obtained thermographic sequences for the selected excitation schemes was carried out using both conventional frequency domain and advanced time domain approaches, such as cross-correlation coefficient and time domain phase analysis, across various test samples.
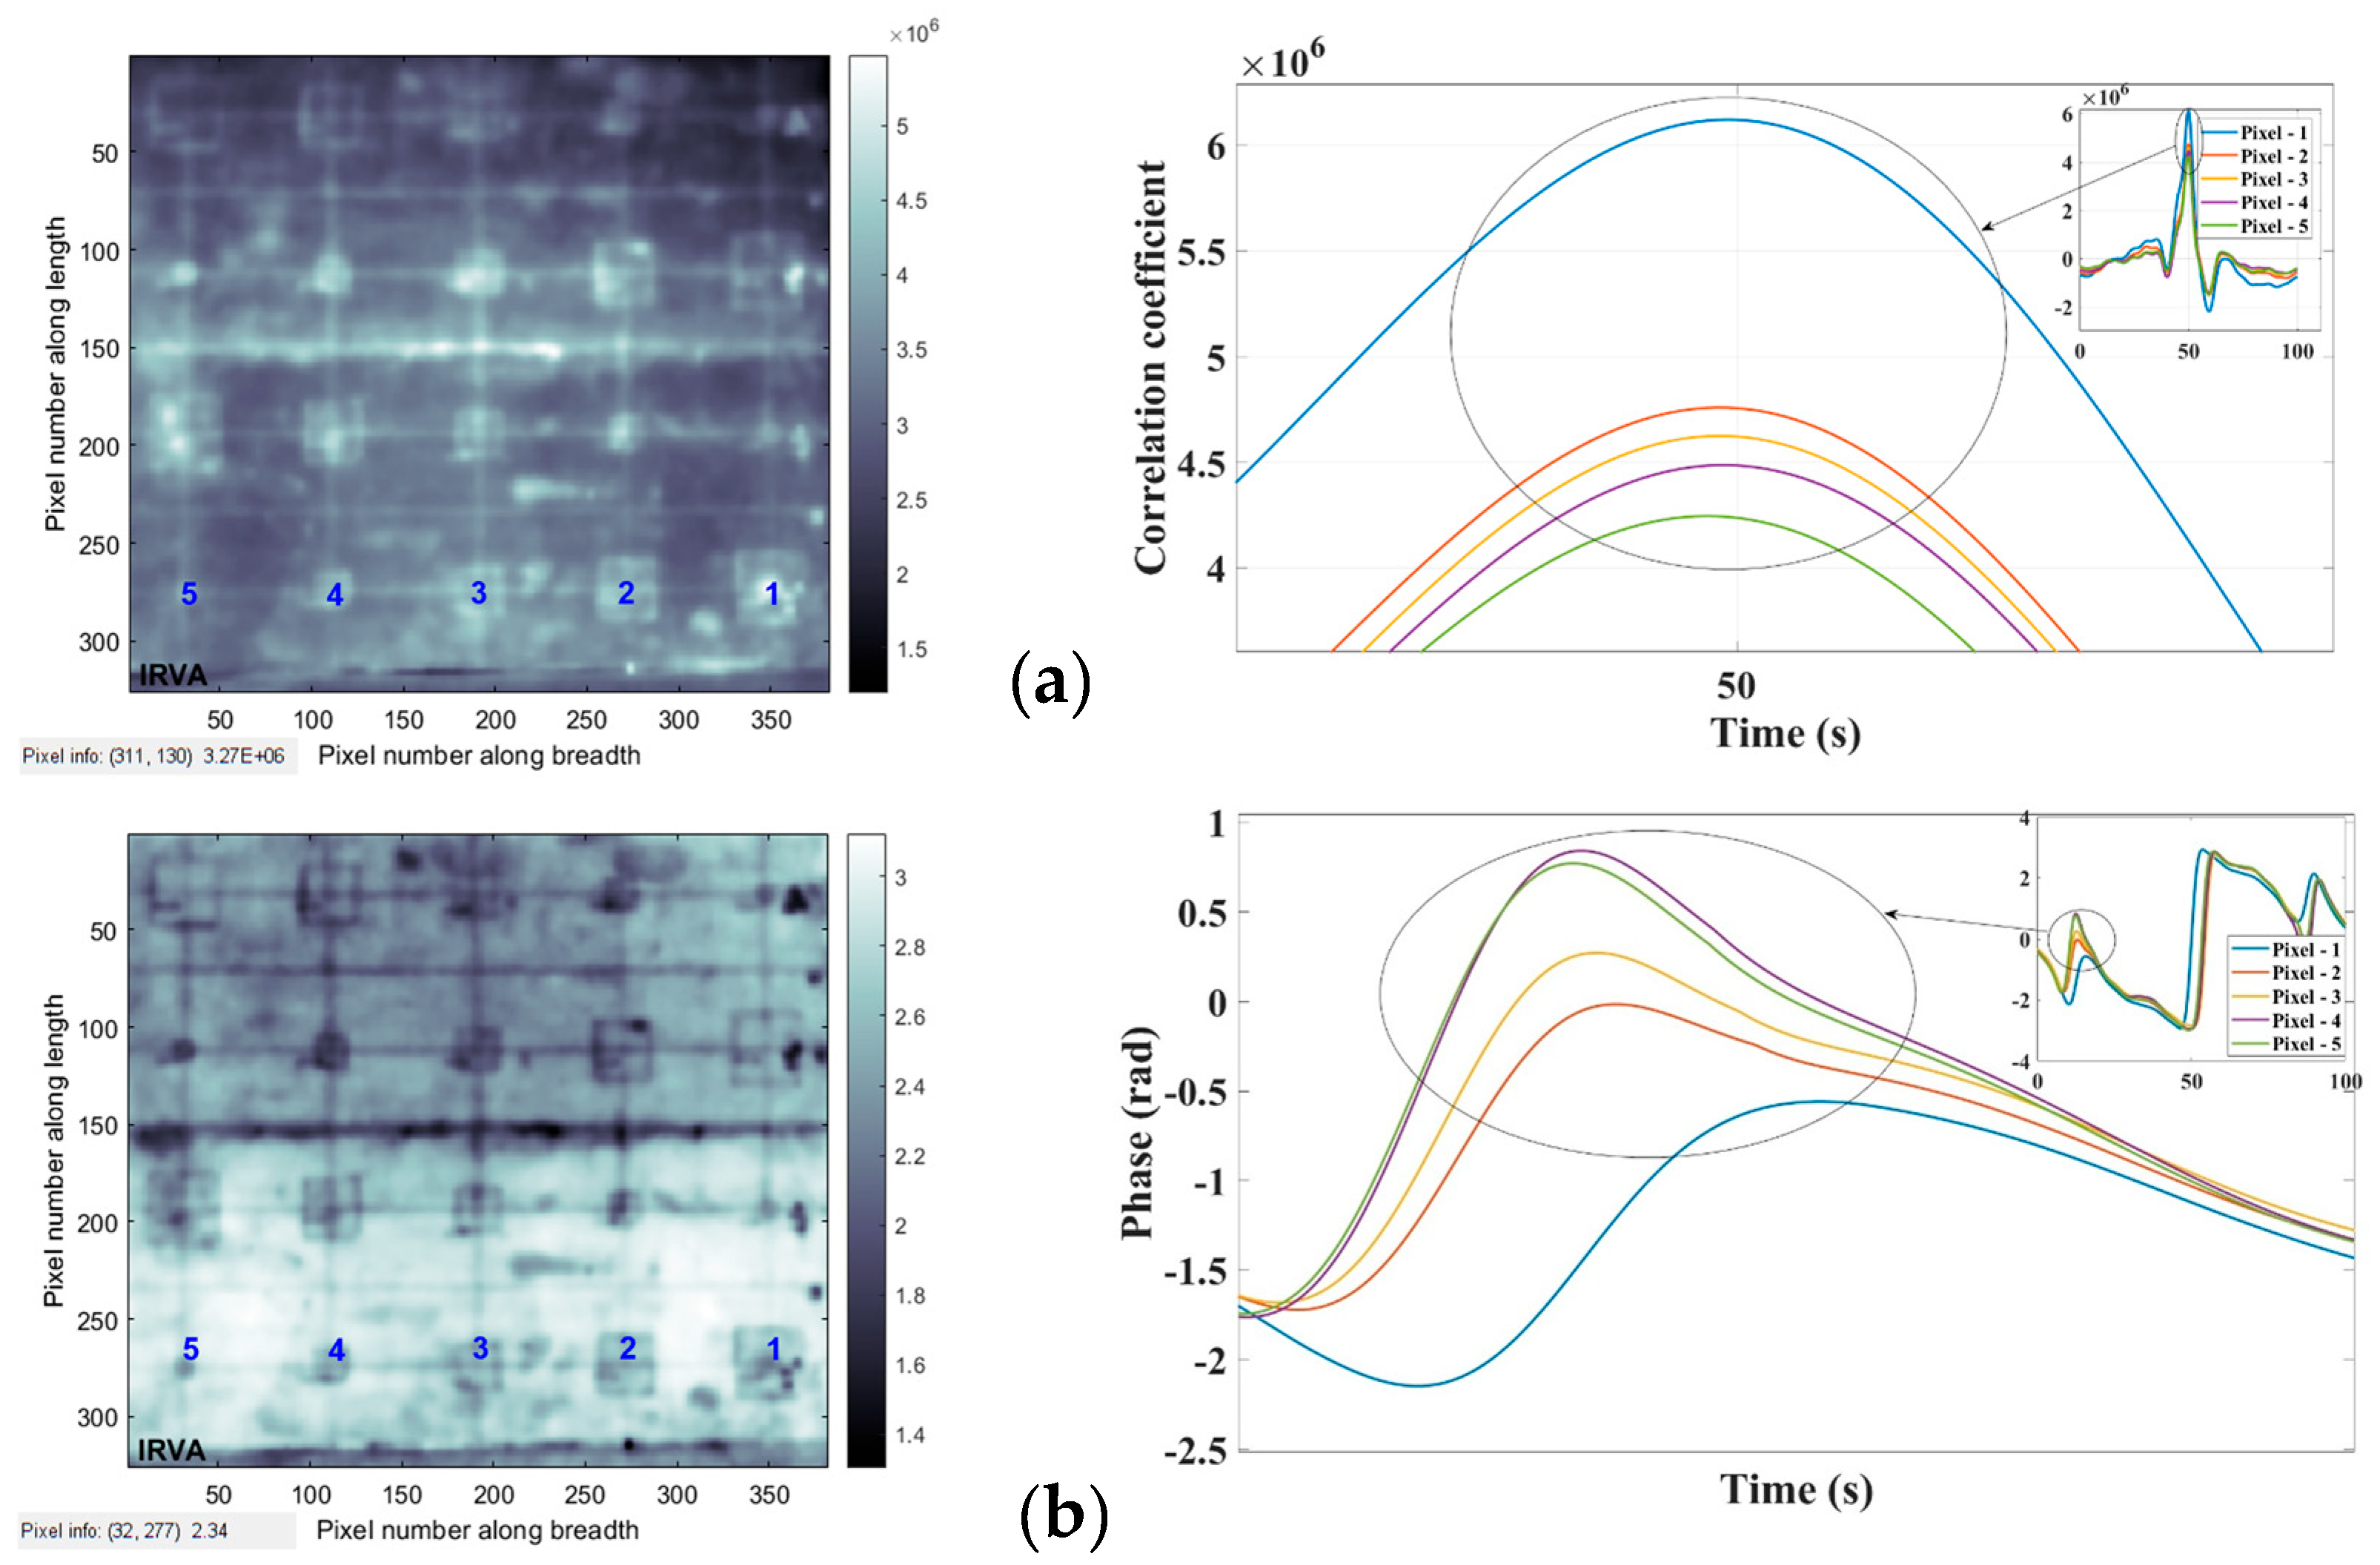
Figure 1 shows the interface bond quality of the metal–insulator and insulator–insulator interfaces, whereas
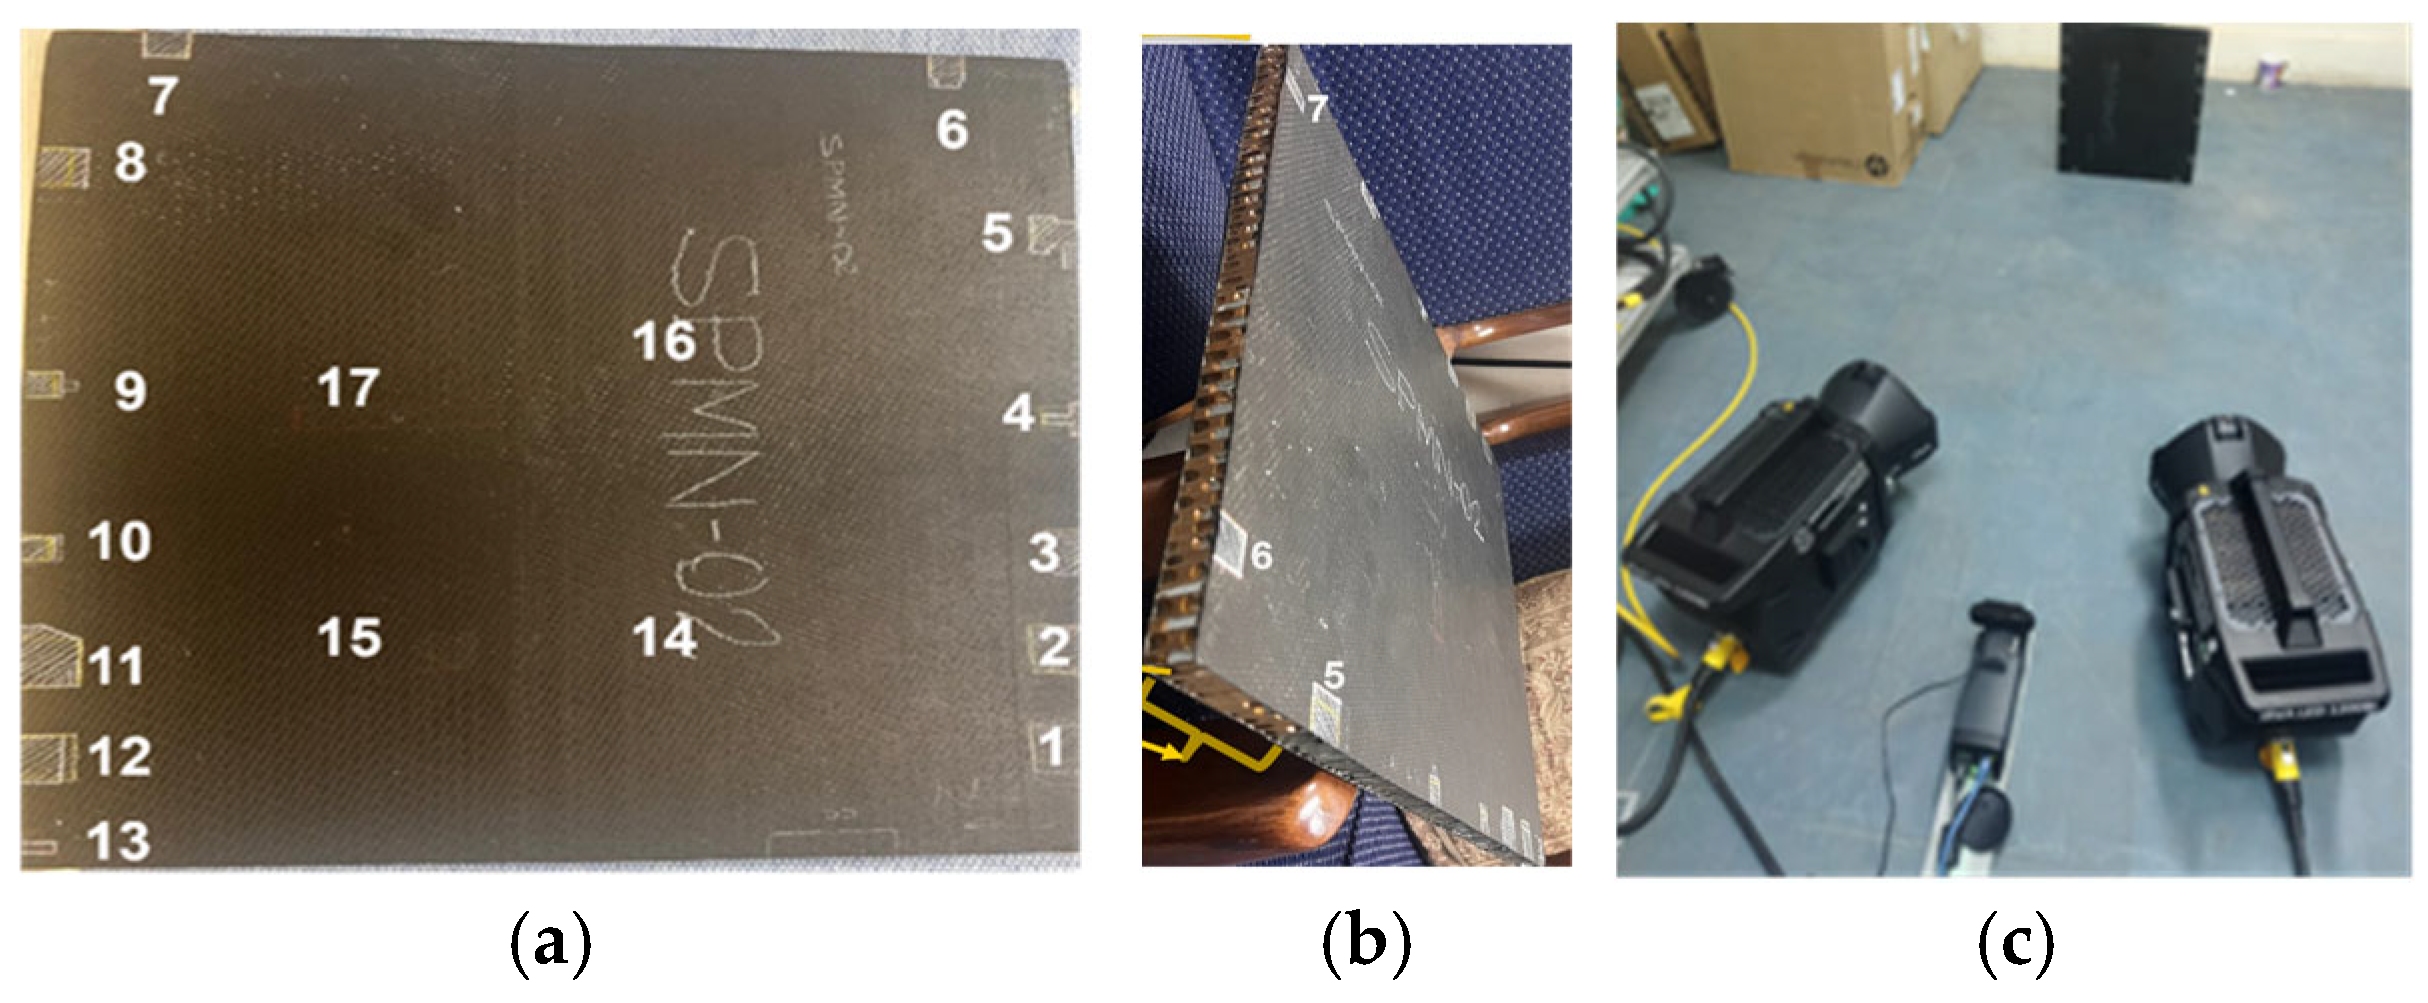
Figure 2 shows the experimental sample and arrangement used for experimentation for testing of the honeycomb specimen.
Figure 3 shows the interface quality for the honeycomb sandwich structure, whereas
Figure 4 shows the stack of the correlation coefficient image sequence. It is clear from all the obtained results for the metal and honeycomb sandwich structures that the obtained CCC post-processing with FMTWI shows the better sub-surface defect detection capabilities while identifying the interface delamination [
4]. Further, efforts were made to compare various experimental techniques and the proposed post-processing approaches both qualitatively and quantitatively.
Author Contributions
Conceptualization, R.M. and V.A.; methodology, R.M.; software, V.A.; validation, R.M. and V.A.; formal analysis, V.A.; investigation, R.M.; resources, R.M.; data curation, V.A.; writing—original draft preparation, R.M.; writing—review and editing, R.M.; visualization, V.A.; supervision, R.M.; project administration, R.M.; funding acquisition, R.M. All authors have read and agreed to the published version of the manuscript.
Funding
This work is supported by the project entitled “Artificial Intelligence based Pulse Compression Favorable Coded Excited Thermal Wave Imaging Technique for Non-destructive Testing and Evaluation of Materials and Components for Defence Application” of the Ministry of Defence (ARMREB) with Sanction Ref. No. ARMREB/HEM/2022/260, dated 23 March 2022, and also partially by the Indian Institute of Technology Delhi for the award of a seed grant to establish the basic facilities to carry out the proposed research under the grant ref no. MI02928G_SG to Prof. Ravibabu Mulaveesala, SeNSE.
Institutional Review Board Statement
Not applicable.
Informed Consent Statement
Not applicable.
Data Availability Statement
The datasets generated during and/or analyzed during the current study are available from the corresponding author on reasonable request.
Acknowledgments
The authors acknowledge Shruti Baradwaj for her help in providing her insights while preparing the manuscript.
Conflicts of Interest
Vanita Arora was employed by the InfraRed Vision & Automation Pvt. Ltd. Ravibabu Mulaveesala declares that the research was conducted in the absence of any commercial or financial relationships that could be construed as potential conflicts of interest.
References
- Maldague, X.P.V. Nondestructive Evaluation of Materials by Infrared Thermography; Springer Science & Business Media: Berlin/Heidelberg, Germany, 2012. [Google Scholar]
- Mulaveesala, R.; Vaddi, J.S.; Singh, P. Pulse compression approach to infrared nondestructive characterization. Rev. Sci. Instrum. 2008, 79, 094901. [Google Scholar] [CrossRef] [PubMed]
- Mulaveesala, R.; Tuli, S. Theory of frequency modulated thermal wave imaging for nondestructive subsurface defect detection. Appl. Phys. Lett. 2006, 89, 191913. [Google Scholar] [CrossRef]
- Mulaveesala, R.; Arora, V.; Dua, G. Pulse compression favorable thermal wave imaging techniques for non-destructive testing and evaluation of materials. IEEE Sens. J. 2021, 21, 12789–12797. [Google Scholar] [CrossRef]
- Vavilov, V.P. Thermal nondestructive testing of materials and products: A review. Russ. J. Nondestruct. Test. 2017, 53, 707–730. [Google Scholar] [CrossRef]
- Busse, G.; Eyerer, P. Thermal wave remote and nondestructive inspection of polymers. Appl. Phys. Lett. 1983, 43, 355–357. [Google Scholar] [CrossRef]
| Disclaimer/Publisher’s Note: The statements, opinions and data contained in all publications are solely those of the individual author(s) and contributor(s) and not of MDPI and/or the editor(s). MDPI and/or the editor(s) disclaim responsibility for any injury to people or property resulting from any ideas, methods, instructions or products referred to in the content. |
© 2025 by the authors. Licensee MDPI, Basel, Switzerland. This article is an open access article distributed under the terms and conditions of the Creative Commons Attribution (CC BY) license (https://creativecommons.org/licenses/by/4.0/).


