Abstract

Cover Thickness Prediction for Steel Inside Concrete by Sub-Terahertz Wave Using Deep Learning †

1
Graduate School of Engineering, Tohoku University, Sendai 980-9579, Japan
2
Faculty of Engineering, Hokkaido University, Sapporo 060-8628, Japan
*
Author to whom correspondence should be addressed.
Presented at the 18th International Workshop on Advanced Infrared Technology and Applications (AITA 2025), Kobe, Japan, 15–19 September 2025.
Proceedings 2025, 129(1), 40; https://doi.org/10.3390/proceedings2025129040
Published: 12 September 2025

Abstract

Deep learning techniques are increasingly being incorporated into the inspection and maintenance of social infrastructure. In this study, we show that when supervised deep learning was applied to imaging data obtained from sub-THz waves, the average recall exceeded 80% for all cover thicknesses of steel plate inside concrete and more than 90% for rebar inside concrete with a cover thickness of up to 20 mm. Unsupervised deep learning enabled the classification for both steel plate and rebar, even at large cover thicknesses. These results are expected to improve the exploration depth, which has been limited in previous studies.

1. Introduction

Advanced technologies such as AI and deep learning are starting to be widely utilized in the field of concrete materials [1], which are commonly used as construction materials. Deep learning can be applied to non-destructive and non-contact inspection for social infrastructure, for example, and many studies on this topic exist [2]. We succeeded in obtaining locations of steel objects inside concrete by utilizing the high penetration and linear propagation characteristics of sub-THz waves [3], which have electromagnetic waves in the 30–300 GHz range. Furthermore, employing a sub-THz cameracapable of detecting the sub-THz range has made it possible to acquire contour plots through real-time scanning [4]. However, the applicability of these measurements has limitations, and there is a need to address these limitations in order to apply them to actual structures.
This paper proposes a deep learning method to predict the cover thickness of steel plates and rebar in concrete using sub-THz wave measurements.

2. Outline of Experiments and Analyses

2.1. Experimental Procedures

An overview of the specimens is shown in Figure 1a,b. The formwork used for beam specimens with a height of 100 mm and a length of 400 mm was used to fabricate specimens with an embedded steel plate (hereafter referred to as “steel plate specimen”) and specimens with an embedded rebar (hereafter referred to as “rebar specimen”). The internal steel plate and rebar were embedded with varying cover thicknesses from the concrete surface for each specimen. The thickness of the steel plate was 1 mm, and the diameter of the rebar was 13 mm (deformed rebar). The cover thicknesses were set at 10, 20, 30, and 40 mm. Four steel plate specimens were prepared for each cover thickness, and two rebar specimens were prepared for each combination of cover thicknesses of 10 and 20 mm and 30 and 40 mm, respectively. The water–cement ratio of the specimen was 55%.

2.2. Measurement Methods

The measurement system using the sub-THz camera (TeraSense: San Jose, CA, USA) is shown in Figure 1c. A microwave generator was used as the oscillator of the sub-THz wave, which was amplified and oscillated by a multiplier capable of oscillating from 18 to 52 GHz. In this paper, measurements were performed by continuously varying the frequency range from 30 to 50 GHz in 1 GHz steps. The sub-THz camera was used as the detector, consisting of 256 elements (16 × 16) with 1.5 mm spacing in a 2.4 cm square, which is suitable for the sub-THz band. As a result, the dataset consisted of 1680 data points for the measurement with steel plate specimens and 2100 data points for the measurement with rebar specimens. The amount of data used for supervised and unsupervised learning from this dataset is shown in Table 1.

2.3. Structure of Deep Learning Model

The structure of the deep learning model constructed in this paper by Neural Networks is shown in Figure 2. Measurement images obtained by the sub-THz camera and the input frequency value were employed as the input layer for the training data. After combining them in the input connection layer, the predicted cover thickness (PCT) was obtained by using Categorical Cross-Entropy as the output layer for the error function. In unsupervised deep learning, measurement images obtained from the actual cover thickness (ACT) of 40 mm were used as training data, and an abnormal index was calculated by squaring the difference between the input and output data.

3. Results and Discussion

3.1. Measurement Results from Sub-THz Waves

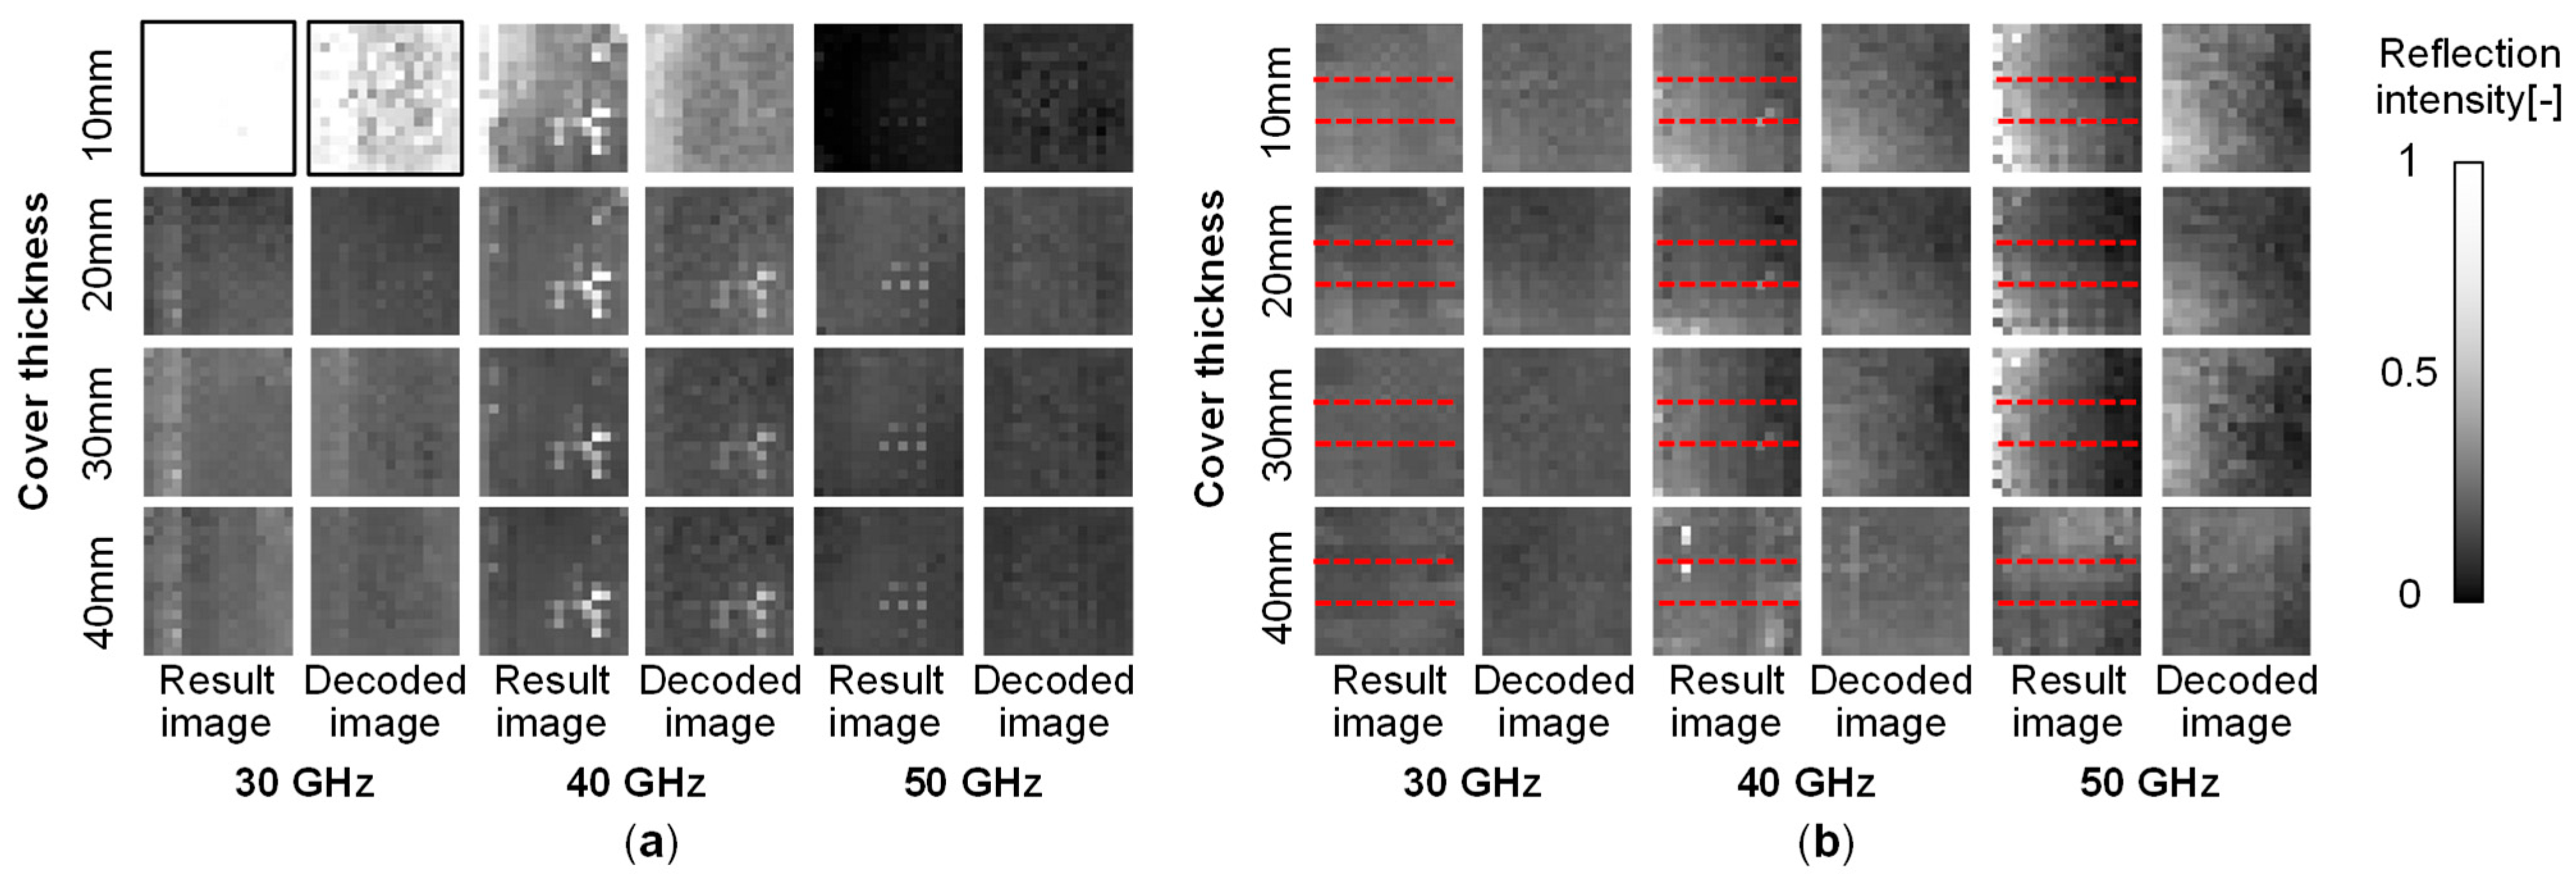
Figure 3 shows some of the measurement images in the steel plate specimens and rebar specimens at 10 GHz intervals with the decoded images, which are discussed along with the clustering results by unsupervised deep learning in Section 3.2 below. The dashed line in the figure indicates the position of the rebar. When the ACT of the steel specimen is 10 mm, the presence of the steel plate can be remarkably confirmed at 30 GHz. The reflection intensity is close to zero at 50 GHz. These results can be attributed to the fact that the reflected waves from the concrete surface and the reflected waves from the steel plate cancel each other out due to interference. For a cover thickness of 20 mm or more, no significant difference in reflection intensity was observed. The results of the rebar specimens also show that the rebar inside the specimens could not be confirmed at any of the ACTs. The above results are generally similar to those of previous research [4].

3.2. Results from Supervised Deep Learning

Table 2 shows the confusion matrix of the ACT and the PCT of the steel plate specimens and rebar specimens. In the steel plate specimens, it is confirmed that the predictions are highly accurate for all cover thicknesses, especially for the ACTs of 10 mm, 20 mm, and 30 mm. In the rebar specimens, the recall of the ACTs of 10 mm and 20 mm is 96% and 91%, respectively. The above results suggest the possibility of predicting cover thickness, although it was impossible in the previous research [4]. In contrast, the recall for the ACTs of 30 mm and 40 mm in the rebar specimens is 40% and 19%, respectively. This can be attributed to the limited availability of measurement images with sufficient reflection intensity for predicting cover thickness, due to differences in reflective surfaces.

3.3. Results from Unsupervised Deep Learning

Figure 3 shows the decoded images by the model on the steel plate specimen, and Figure 4a also shows some abnormal indexes. In this study, measurement images with the ACT of 40 mm were used for training; thus, it can be confirmed that the abnormal indexes for the data with the ACT of 40 mm are quite small. On the other hand, the abnormal indexes for data with the ACT of 10 mm are high. From these results, it is confirmed that the abnormal indexes decreased as the ACT increased, and it is possible to identify the cover thickness from the abnormal indexes with a small amount of data. Figure 4 shows the decoded images by the model on the rebar specimen, and Figure 4b also shows some abnormal indexes. These abnormal indexes indicate that it is possible to divide the cover thickness into four groups. However, unlike the steel plate specimens, no trend in abnormal indexes with respect to the change in cover thickness could be observed. Thus, it is expected to be difficult to identify the cover thickness from abnormal indexes.

4. Conclusions

In this paper, we propose a deep supervised and unsupervised learning method to estimate cover thickness using sub-THz wave measurements. The findings are as follows:
(1)
The cover thickness of steel plates in concrete can be accurately predicted and classified using both supervised and unsupervised deep learning.
(2)
Supervised learning accurately predicts rebar in concrete up to a 20 mm cover thickness, but this accuracy declines at 30 mm and 40 mm.
(3)
Unsupervised deep learning enables clustering of the cover thickness of rebar in concrete.

Author Contributions

Conceptualization, K.K. and T.N.; methodology, K.K.; software, K.K. and K.H.; validation, K.K., T.N. and K.H.; formal analysis, investigation, resources, data curation, and visualization, K.K.; writing—original draft preparation, K.K.; writing—review and editing, T.N. and K.H.; supervision, project administration, and funding acquisition, T.N. All authors have read and agreed to the published version of the manuscript.

Funding

This research was funded by THE KAJIMA FOUNDATION’s General Research Grants.

Institutional Review Board Statement

Not applicable.

Informed Consent Statement

Not applicable.

Data Availability Statement

Data will be made available upon request.

Conflicts of Interest

The funders had no role in the design of the study; in the collection, analyses, or interpretation of the data; in the writing of the manuscript; or in the decision to publish the results.

References

  1. Li, Z.; Yoon, J.; Zhang, R.; Rajabipour, F.; Srubar, W.V., III; Dabo, I.; Radlińska, A. Machine learning in concrete science: Applications, challenges, and best practices. npj Comput. Mater. 2022, 8, 127. [Google Scholar] [CrossRef]
  2. Ansari, S.S.; Ansari, H.; Khateeb, A.; Ibrahim, S.M. Comparative study of machine learning models for predicting the compressive strength of concrete using Non-Destructive Testing methods. Mater. Today Proc. 2024; in press. [Google Scholar] [CrossRef]
  3. Tanabe, T.; Oyama, Y. THz non-destructive visualization of disconnection and corrosion status cover with opaque insulator. IEEJ Trans. Electron. 2019, 139, 149–153. [Google Scholar] [CrossRef]
  4. Kobayashi, C.; Nishiwaki, T.; Tanabe, T.; Oohashi, T.; Hamasaki, H.; Hikishima, S.; Tanaka, A.; Arita, K.; Fujii, S.; Sato, D.; et al. Non-destructive testing of reinforced concrete structures using sub-terahertz reflected waves. Dev. Built. 2024, 18, 100423. [Google Scholar] [CrossRef]
Figure 1. Specimen for measurement and measurement system. (a) Steel plate specimen (unit: mm). (b) Rebar specimen (unit: mm). (c) Measurement system with sub-THz camera.
Proceedings 129 00040 g001
Figure 2. The constructed deep learning model. (a) Supervised model. (b) Unsupervised model.
Proceedings 129 00040 g002
Figure 3. Images from measurement and unsupervised deep learning every 10 GHz. (a) Measurement images from steel rebar specimen and decoded image by unsupervised deep learning. (b) Measurement images from rebar specimen and decoded image by unsupervised deep learning.
Proceedings 129 00040 g003
Figure 4. Clustering results by unsupervised deep learning. (a) Abnormal indexes by steel plate specimen every 10 GHz. (b) Abnormal indexes by rebar specimen every 10 GHz.
Proceedings 129 00040 g004
Table 1. Amount of data used for deep learning.
Amount of DataSupervised Deep LearningUnsupervised Deep Learning
TrainTestTrainTest
Steel plate specimen1260420315420
Rebar specimen1680420315420
Table 2. Confusion matrix showing the amount of data for the ACT and the PCT.
Amount of DataPCT from Steel Plate SpecimenPCT from Rebar Specimen
10203040Recall10203040Recall
ACT101040100.991010040.96
20196260.91996000.91
300110040.95131742330.40
4001612770.7328849200.19
Precision0.990.850.870.89 0.670.790.460.35
F-score0.990.880.910.800.790.850.430.25
Disclaimer/Publisher’s Note: The statements, opinions and data contained in all publications are solely those of the individual author(s) and contributor(s) and not of MDPI and/or the editor(s). MDPI and/or the editor(s) disclaim responsibility for any injury to people or property resulting from any ideas, methods, instructions or products referred to in the content.