Proceeding Paper

Atmospheric Particulate Matter Variability during 2014 at Buenos Aires City (Argentina) Comparing Ground-Based Measurements and Satellite Data †

by
Lara S. Della Ceca
1,*,
María I. Micheletti
1,2 and
Rubén D. Piacentini
1,3
1
Grupo Física de la Atmósfera, Radiación Solar y Astropartículas, Instituto de Física Rosario, CONICET—Universidad Nacional de Rosario, Rosario 2000, Argentina
2
Facultad de Ciencias Bioquímicas y Farmacéuticas, Universidad Nacional de Rosario, Rosario 2000, Argentina
3
Laboratorio de EficienciaEnergética, Sustentabilidad y CambioClimático, IMAE, FCEIA, UniversidadNacional de Rosario, Rosario 2000, Argentina
*
Author to whom correspondence should be addressed.
Presented at the 2nd International Electronic Conference on Atmospheric Sciences, 16–31 July 2017; Available online: http://sciforum.net/conference/ecas2017.
Proceedings 2017, 1(5), 180; https://doi.org/10.3390/ecas2017-04152
Published: 17 July 2017

Abstract

:
Air pollution is a major environmental risk to health. In particular, exposure to high concentrations of small particulates (PM10 and PM2.5) is related to increased mortality and morbidity. In Argentina, only at Buenos Aires city (34.4° S 58.3° W), which together with the surrounding districts accounts for the 30% of the total country population, continuous measurements of air quality are carried out. Though ground-based stations provide very accurate PM concentration values, they have very limited spatial coverage and may not be sufficient to assess the level of population exposure. Satellite-based is a valid alternative to fill these observational gaps. In this work, the MODIS 3 km × 3 km AOD retrievals for 2014, for both Terra and Aqua, were employed to evaluate the spatio-temporal variation of atmospheric aerosols over Buenos Aires and its metropolitan area in a year period. The MODIS AOD dataset is validated using the AOD dataset reported by the CEILAP_BA AERONET station (34.5° S 58.5° W). Satellite data show some areas with higher AOD values throughout the year-period in which no PM monitoring is not actually being carried out. These areas correspond mainly to a west zone within Buenos Aires territory and two other areas, at west and south Buenos Aires districts. Buenos Aires local government and the surrounding districts should make an effort to expand the monitoring network in order to make it representative of the actual exposure to particulate matter of the whole population.

1. Introduction

Clean air is considered to be a basic requirement for human health and well-being. However, according to the last Air Quality report of the World Health Organization, more than 80% of people living in urban areas where air pollution is being monitored, are exposed to air quality levels that exceed the recommended limits [1]. The epidemiological evidence shows adverse effects of aerosols or particulate matter (PM) following both short-term and long-term exposures [2]. Particulate matter health effects is broad, but predominantly affect the respiratory and cardiovascular systems [3,4]. Moreover, particulate matter from traffic emissions has recently been classified as a Group I carcinogen by the International Agency for Research on Cancer [5].
In most urban environments, particulate matter is primarily produced by mechanical processes (i.e., construction activities, road dust re-suspension and wind) and combustion sources. The concentration, size distribution and chemical composition of suspended particles varies substantially between cities around the world, depending on local geography, meteorology and specific PM sources. For this reason, local measurements are very important for a detailed knowledge of the characteristic of these particles.
In Latin America, ground stations measuring PM are only available in 6 countries and extended, nation-wide PM monitoring networks only exist in Chile, Brazil, Colombia and Ecuador [6]. In Argentina, a continuous monitoring of PM is only available in Buenos Aires city.
The Autonomous city of Buenos Aires is the capital and most populated city of Argentina, it accounts for approximately 10% of the total country population. It is surrounded by a large urban agglomeration that spreads north, south and west from Buenos Aires city constituting the ‘Gran Buenos Aires’ area. Gran Buenos Aires accounts for the 30% of the total country population and is the second metropolitan area more populated of South America and the southern hemisphere.
Though no relevant nation-wide regulation on PM exists to protect the population in Argentina, an air quality law has been established in 2006 (Ley 1356, [7]) at Buenos Aires city, which regulates the prevention and control of air pollution in the city, including policies and urban planning in relation with the health, as well as the implementation of mitigation actions. This law established the limit values of PM10 and other pollutants. In the framework of this law, a monitoring network of air quality and meteorological variables was installed.
During the last decades, measurements of air quality in Buenos Aires have been carried out by research institutions in an uncoordinated way, and consequently producing fragmented information. These research studies are focused on topics such as impact assessment of specific sources, characterization of multi-elemental aerosol composition, and source identification through receiver models [8,9,10].
Nowadays, a monitoring network composed of four stations that meet international quality standards to measure criteria pollutants provides air quality data for Buenos Aires city (http://www.agenciaambiental.gob.ar).
Until some years ago, no consistent emission inventory is available for Buenos Aires. The first systematic attempt is described in [11]. This inventory refers to on-road mobile sources of Gran Buenos Aires reports emissions for the period 2000–2006 of greenhouse gases (CO2, CH4 and N2O) and criteria pollutants (CO, NOx, NMVOCS, PM and SO2) disaggregated by district and also presented in a grid of 1 × 1 km2 using a distribution algorithm described in [12]. Another inventory for stationary sources is described in [13]. According to these data, on-road vehicles are the main contributors for almost all of the pollutants in Gran Buenos Aires with the only exception of SO2 and CO2, for which stationary sources are dominant. The main drawbacks of these inventories is their static nature, they do not identify changes in sources emissions throughout seasons.
Though ground-based monitors provide accurate measurements, they are often influenced by local emission sources. Moreover, their spatial coverage is limited and therefore may not correctly characterize the spatial-temporal distribution of aerosols in the city and the real exposure of its population [14].
Another way of studying the spatial distribution of contaminants is through remote sensing using satellite technology [15]. The most common parameter obtained by satellite sensors related to aerosols in the atmosphere is the Aerosol Optical Depth (AOD), also denoted as optical thickness, which measures the extinction of light due to dispersion and absorption by aerosols [16]. Several satellites provide global AOD coverage almost daily with different spatial resolutions (i.e., NOAA15, GOES, Suomi, Aqua, Terra).
The main objective of our work is to study the space-time variability of particulate matter at Buenos Aires city for a year-period (2014) using ground-based measurements and satellite information.
To our knowledge this is the first approach to study atmospheric aerosols dynamics at Buenos Aires metropolitan area using not only ground-based measurements but also satellite information.

2. Materials and Methods

2.1. Area of Study

In accordance with the national census carried out in 2010, Gran Buenos Aires, is the most populated area in the country, with 12.806.866 inhabitants (INDEC, 2010). The Gran Buenos Aires is located on the western shore of the estuary of the Río de La Plata (Figure 1) and is composed of Buenos Aires city and 24 radially surrounding districts that are part of the province of Buenos Aires (Figure 2).
Data obtained from the National Meteorological Service for the 2003–2013 period indicate that Buenos Aires has a humid subtropical climate with four distinct seasons (Figure 3). As a result of maritime influences from the Atlantic Ocean, the climate is temperate and extreme temperatures are rare. Summers are hot and humid. The warmest month is January, with a daily average of 24.7 °C, heat waves of short duration (less than a week) are common during summers.
Winters are cold with maximun temperatures averaging 16.3 °C and lows 8.1 °C. July is the coolest month, with an average temperature of 11.5 °C. Relative humidity averages over 70%, which means that the ocurrence of moderate-to-heavy fogs during autumn and winter is common in the city. Spring and autumn are characterized by changeable weather conditions. Cold polar air from the south can bring cooler temperatures while hot humid air from the north bring hot temperatures.
Total annual precipitation is aproximately 1.24 mm. Rains mainly occur during summer and spring.
Winds are predominantly from the east and the wind speed is relatively higher in spring and summer compared to winter and fall (Figure 4). In Anex I a detailed wind rose for each month of 2014 is show.

2.2. Particulate Matter Measurements

Air quality monitoring network at Buenos Aires city includes four EPA (United States Environmental Protection Agency) type stations located in diverse areas of the city. During 2014 three of these stations measured PM10: Centenario, Córdoba and La Boca stations.
Centenario station (34.61 S 58.43 W) is located at Centenario Park, a residential and commercial area with medium vehicular flow. Córdoba station (34.6 S 58.39 W) is located in Córdoba avenue, a residential and commercial area with high vehicular flow. It is representative of other areas close to avenues of similar characteristics in the city. Finally, La Boca station (34.63 S 58.37 W) is located at the Matanza-Riachuelo basin area, is a mixed zone with medium-low vehicular flow and a significative incidence of fixed local sources. In this basin are located numerous factories, especially tanneries, that pour large amounts of industrial waste, which makes the Matanza/Riachuelo a polluted river.
PM10 (in μg/m3) daily measurements are provided by the Ministry of Environment and Public Space and the Environmental Protection Agency (APRA) and are available at https://data.buenosaires.gob.ar.

2.3. Aerosol Optical Depth Measurements

2.3.1. Ground-Based Measurements

The AERONET (AErosol RObotic NETwork) program is a network of ground-based remote sensing aerosol networks established by NASA and PHOTONS (PHOtométrie pour le Traitement Opérationnel de Normalisation Satellitaire; Univ. of Lille 1, CNES, and CNRS-INSU). This program provides a long-term and continuous database of aerosol optical and other microphysical and radiative properties of atmospheric aerosols. This database is of public domain and is used, for example, for aerosol characterization research and validation of satellite retrievals. Data are available from the AERONET and PHOTONS web sites (https://aeronet.gsfc.nasa.gov and http://loaphotons.univ-lille1.fr/photons/).
In this study, hourly Level 2.0 data (cloud-screened and quality-assured) was obtained from the CEILAP-AERONET station (34.56 S 58.50 W, 10 meters above sea level), located approximately 15 km north of the centre of Buenos Aires city.

2.3.2. Satellite Observations

The Moderate Resolution Imaging Spectroradiometer (MODIS; https://modis.gsfc.nasa.gov/) instrument, onboard Aqua and Terra (NASA) satellites, provides high radiometric sensitivity (12 bit) in 36 spectral bands ranging in wavelength from 0.4 μm to 14.4 μm. The Dark Target algorithm uses MODIS bands 1 through 7 and 20 (prior cloud screening using MODIS data) to retrieve AOD over oceans and land at a spatial resolution of 10 km × 10 km and 3 km x 3 km [17].
For this study we used the 3 km × 3 km AOD MODIS product, since is, among the available AOD satellite products, the one with the higher spatial resolution and so more suitable for the urban scale. Data is of public domain (https://ladsweb.modaps.eosdis.nasa.gov).
Aqua and Terra datasets were combined by averaging both satellite products, daily, monthly, seasonal and annual averages were calculated for each pixel.

3. Results and Discussion

3.1. Particulate Matter

The average value of particulate matter in 2014 was higher for Centenario station (24.54 ± 2.56 μg/m3) followed by La Boca (23.33 ± 4.07 μg/m3) and Córdoba (22.13 ± 3.45 μg/m3) stations. Consequently, their values are similar, since they are within the uncertainty range. It should be noted that this average corresponds for Centenario station to January–December period, for Córdoba station to May–December period and for La Boca to January–November period.
These PM10 annual averages slightly exceeded the 20 μg/m3 annual mean guideline value recommended by the World Health Organization (WHO, 2005 and 2016). The 50 μg/m3 24-h mean guideline value was exceeded at Centenario station only during 4 days (one in May and three in June) and at Córdoba station during 2 days (in April and June). La Boca station measurements did not exceed this 24-h mean guideline value during 2014.
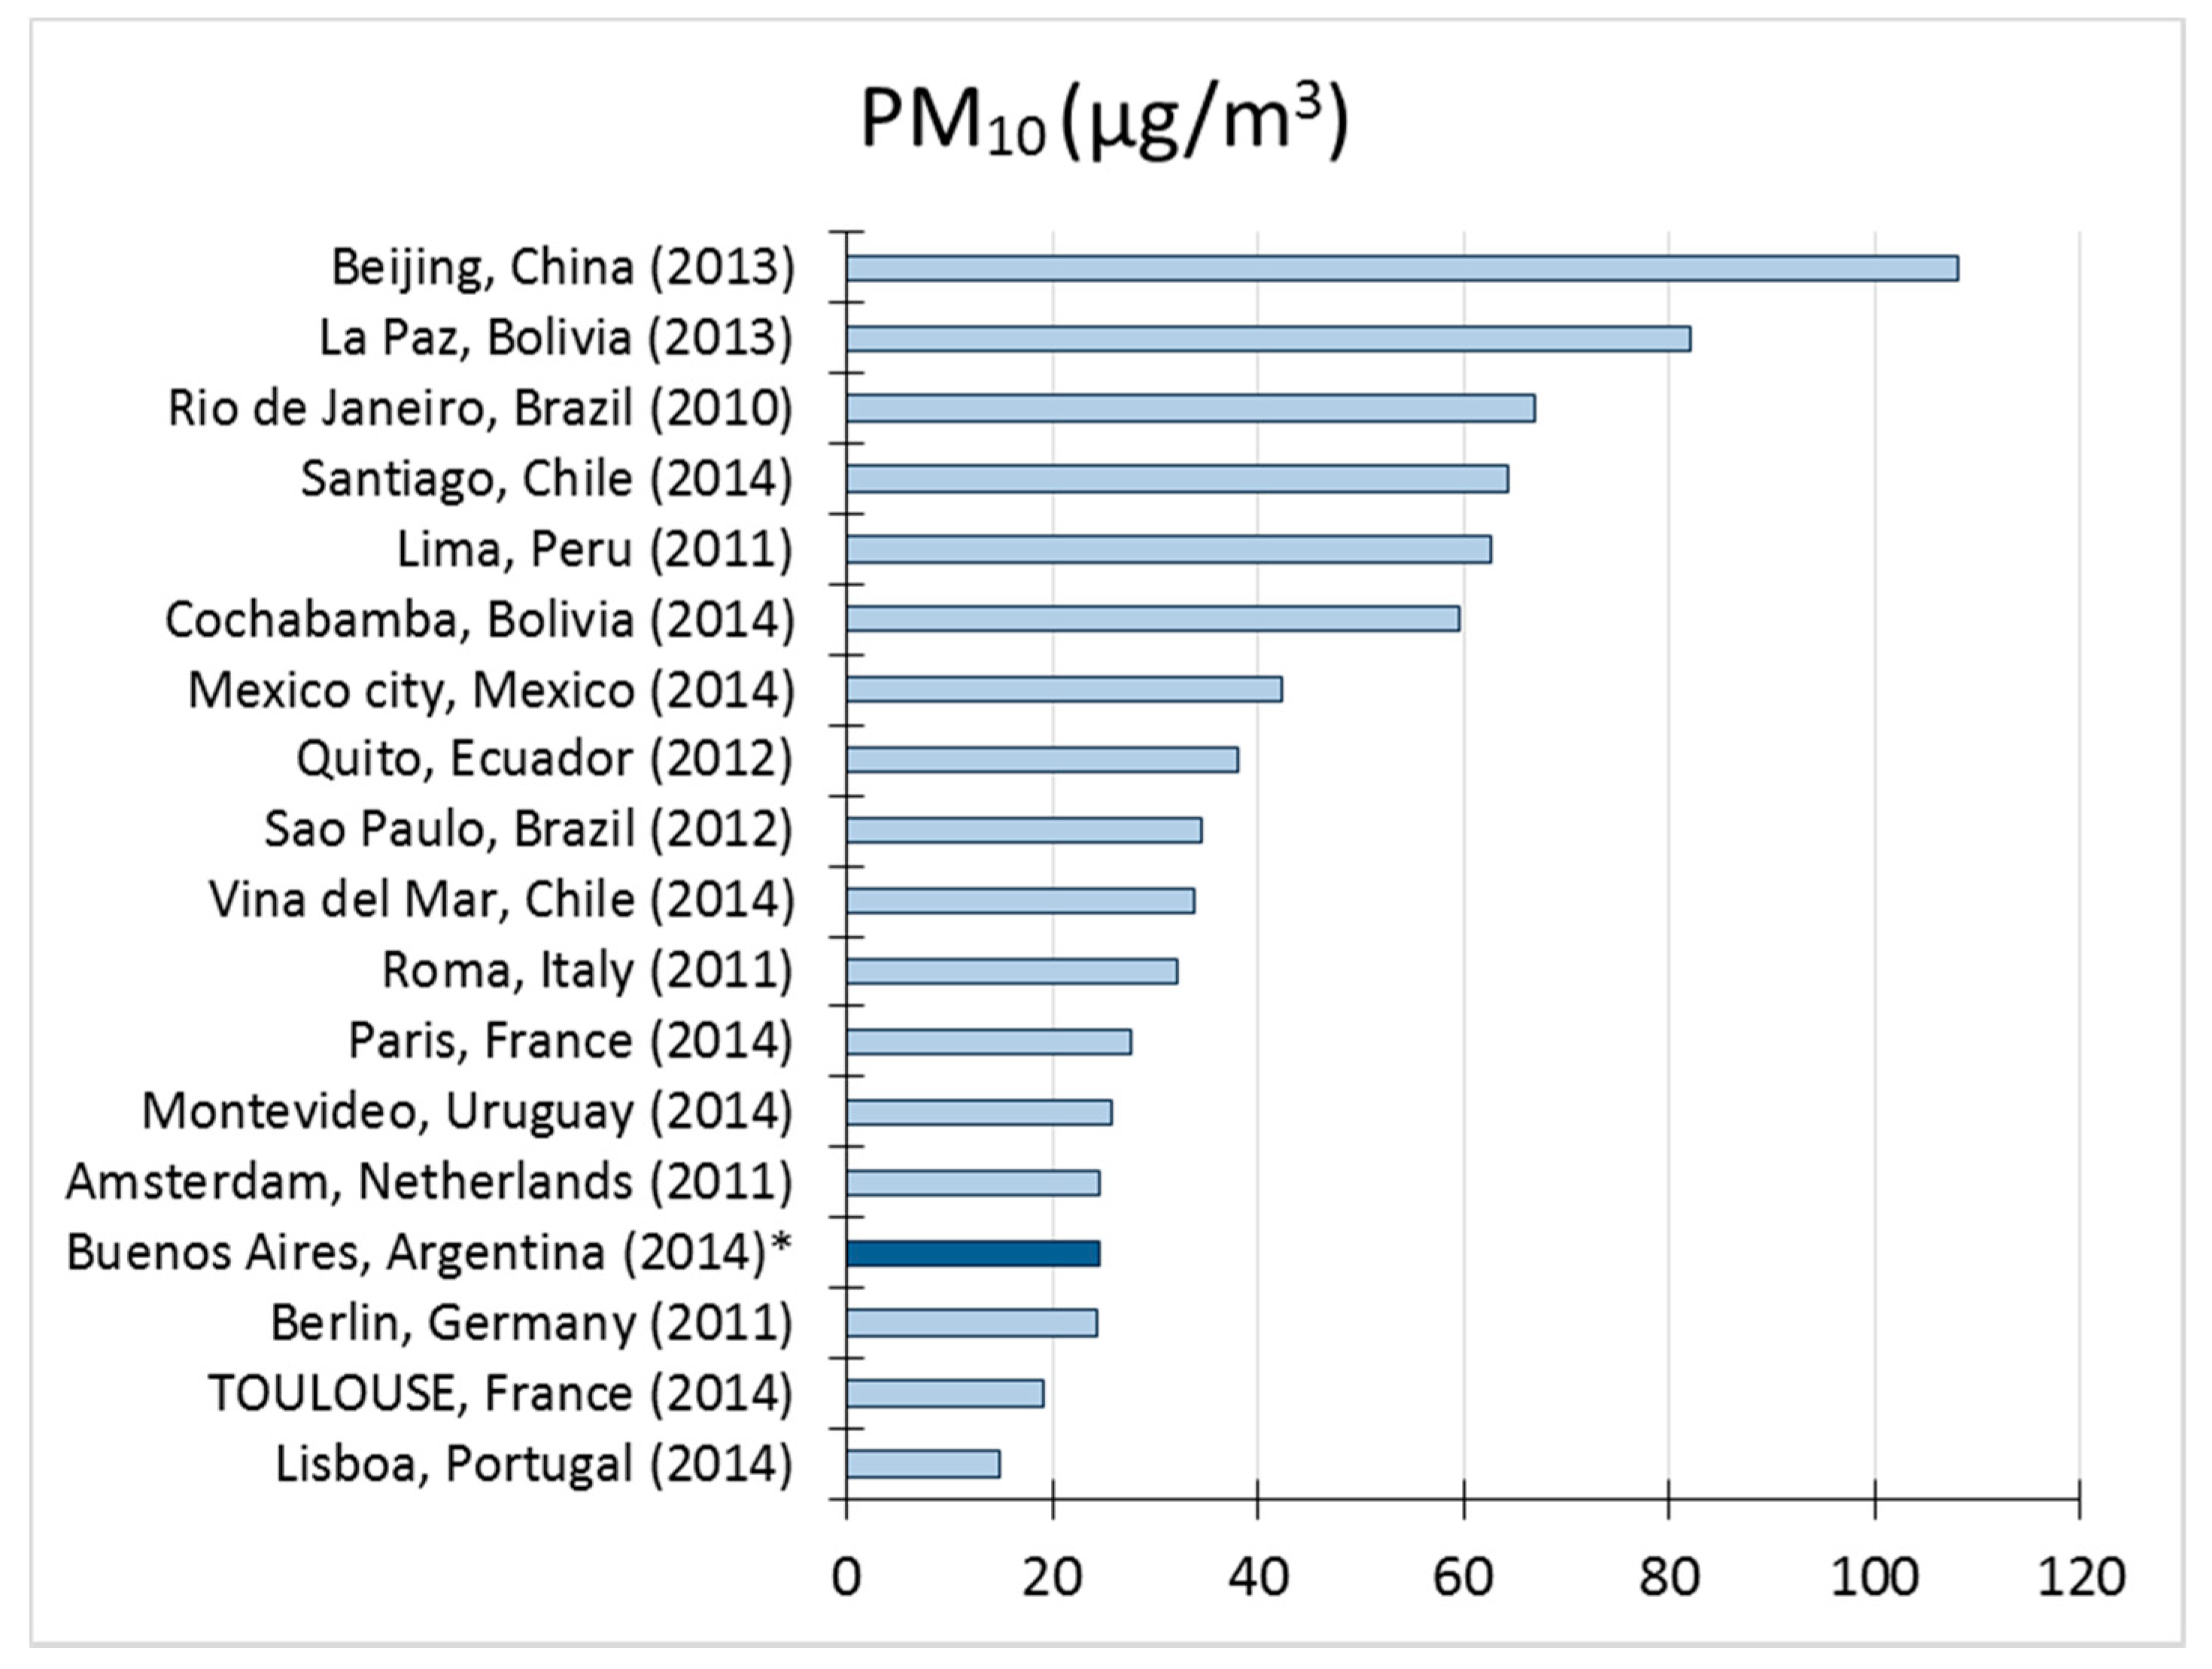
When considering the WHO database to compare Buenos Aires annual PM10 mean with other cities in the world, is evident that Buenos Aires city is among the cities with medium-low levels of PM10 (Figure 5). Buenos Aires exceeded, in 2014, by 23% the limit value recommended by WHO, but other cities in South America exceeded this value by more than 100%, i.e., México (111%), Cochabamba (198%), Santiago de Chile (222%). The 2016 version of the WHO database consists mainly of urban air quality data—annual means for PM10 and/or PM2.5—covering about 3.000 urban areas in 103 countries for the years 2008–2015. Primary source of data are official reporting from countries to WHO, official national/subnational reports and national/subnational web sites containing measurements of PM10 or PM2.5 and the relevant national agencies (available at http://www.who.int/phe/health_topics/outdoorair/databases/cities/en/).
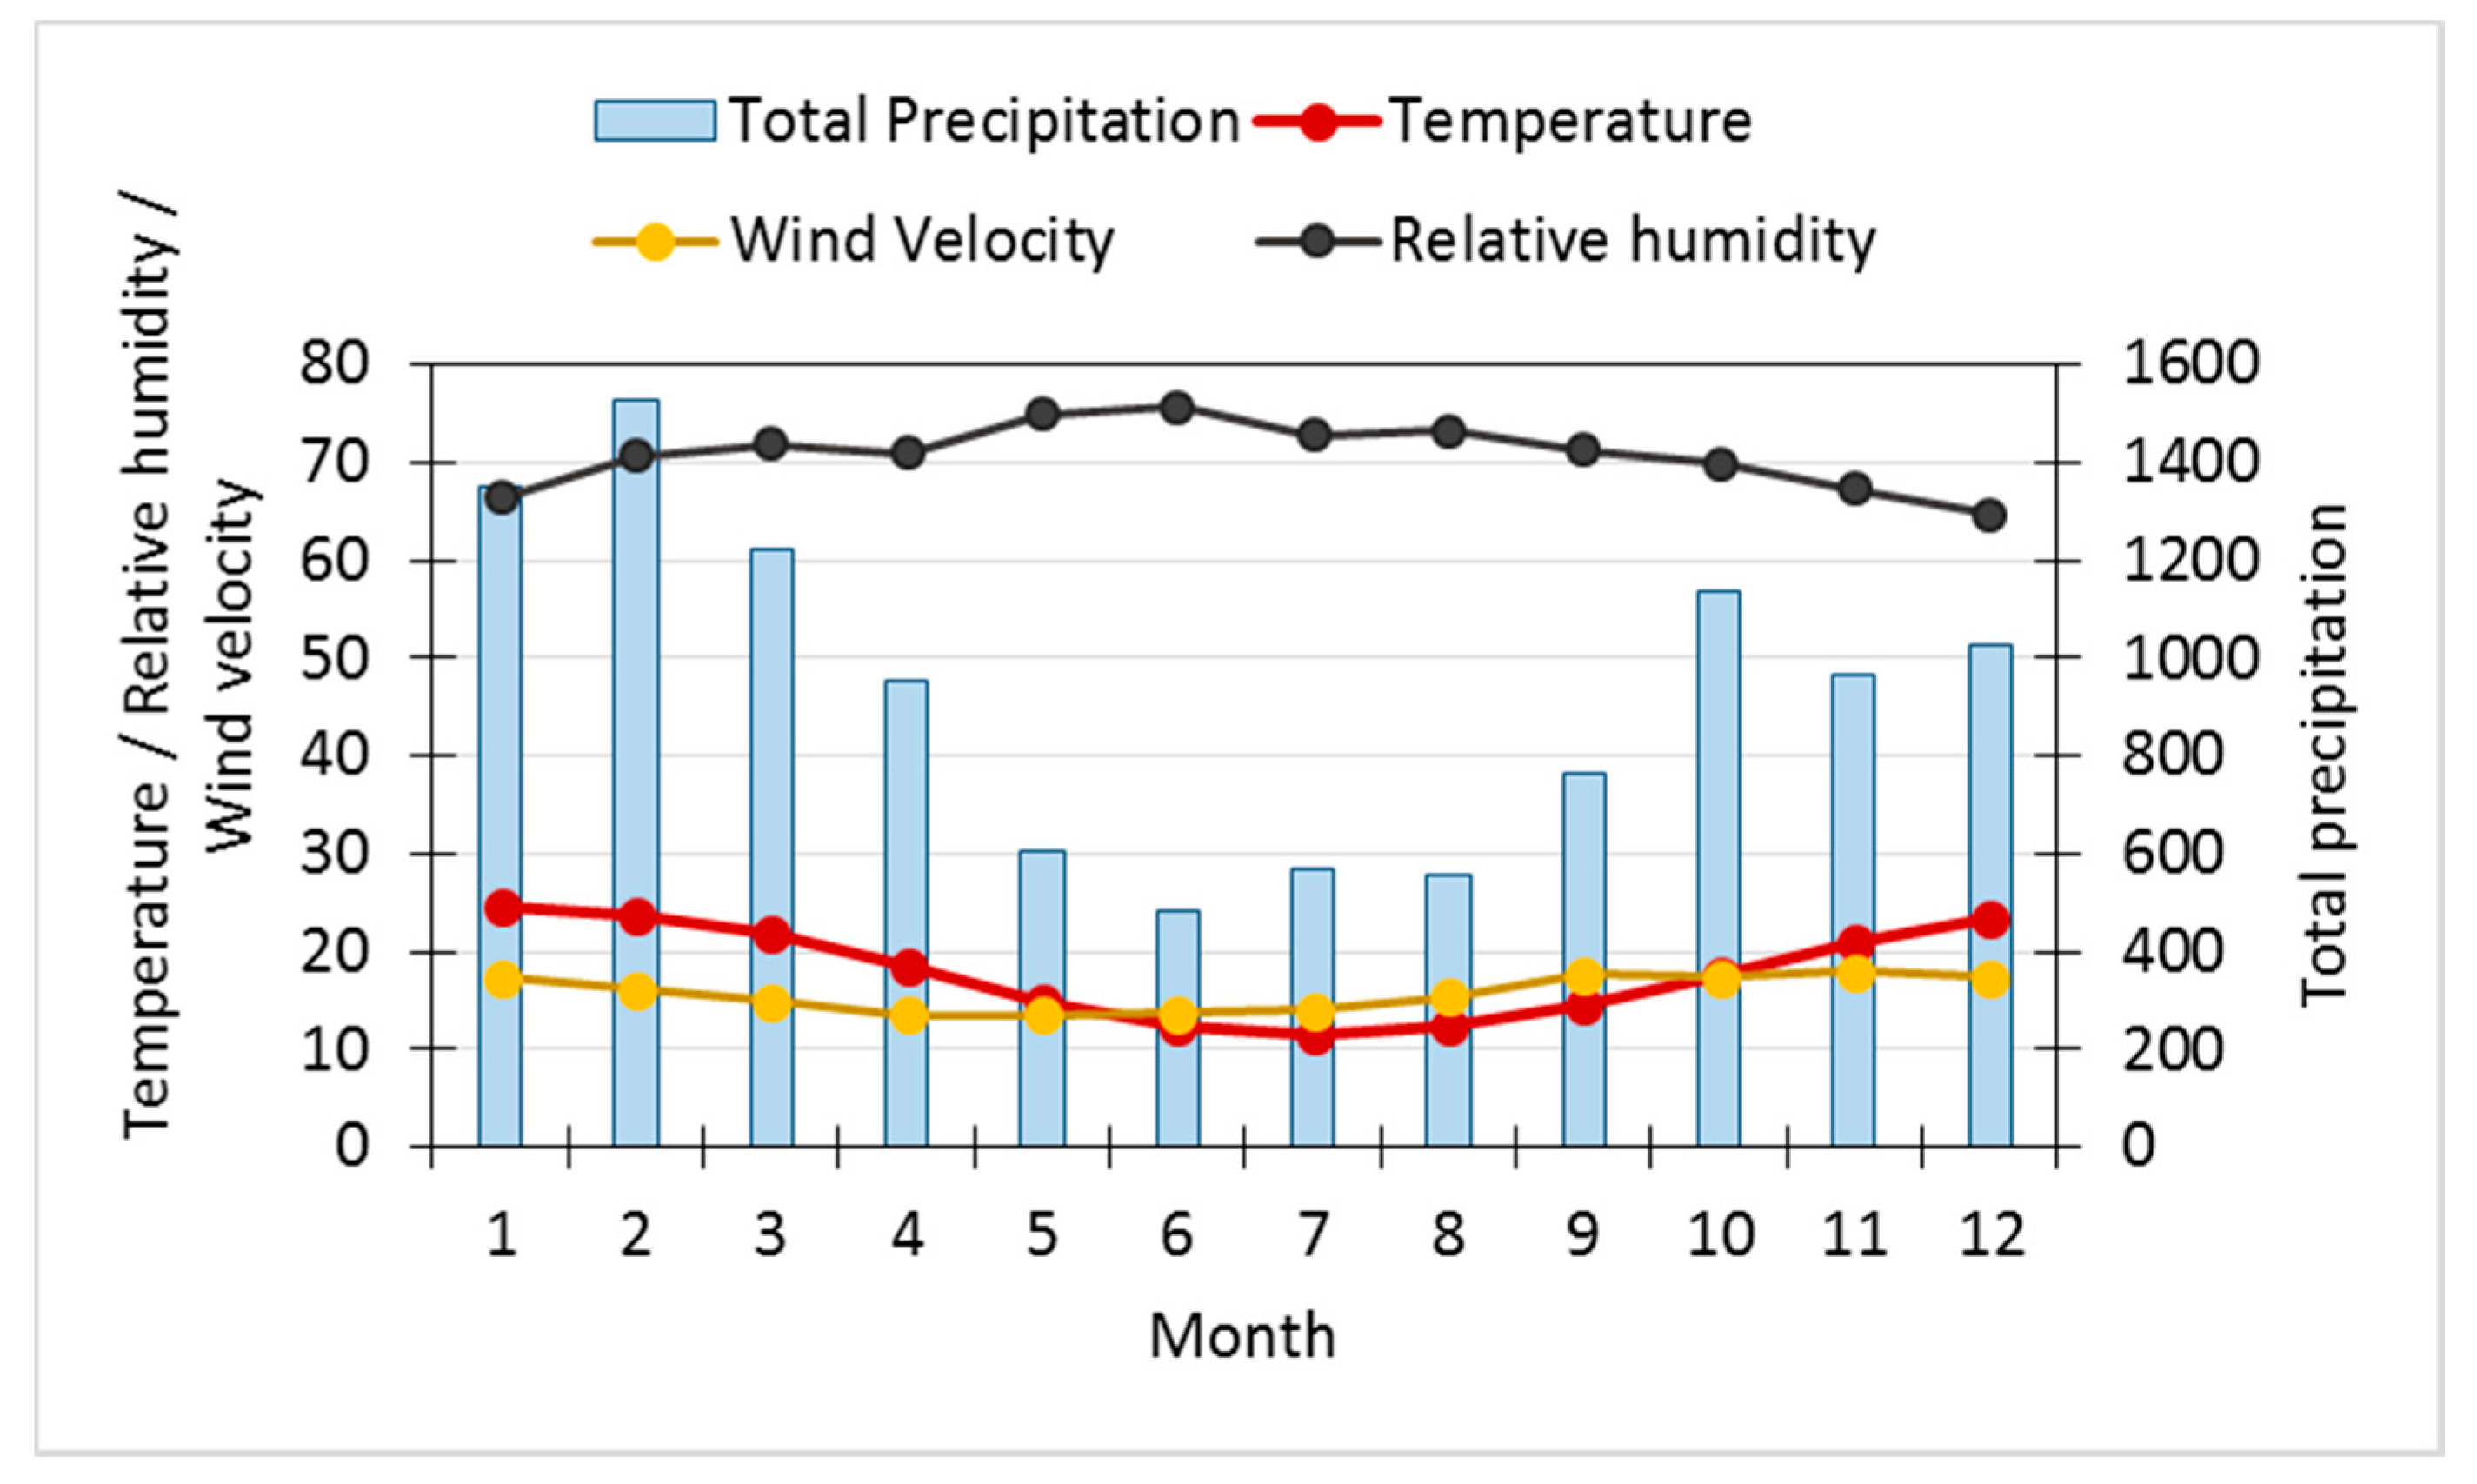
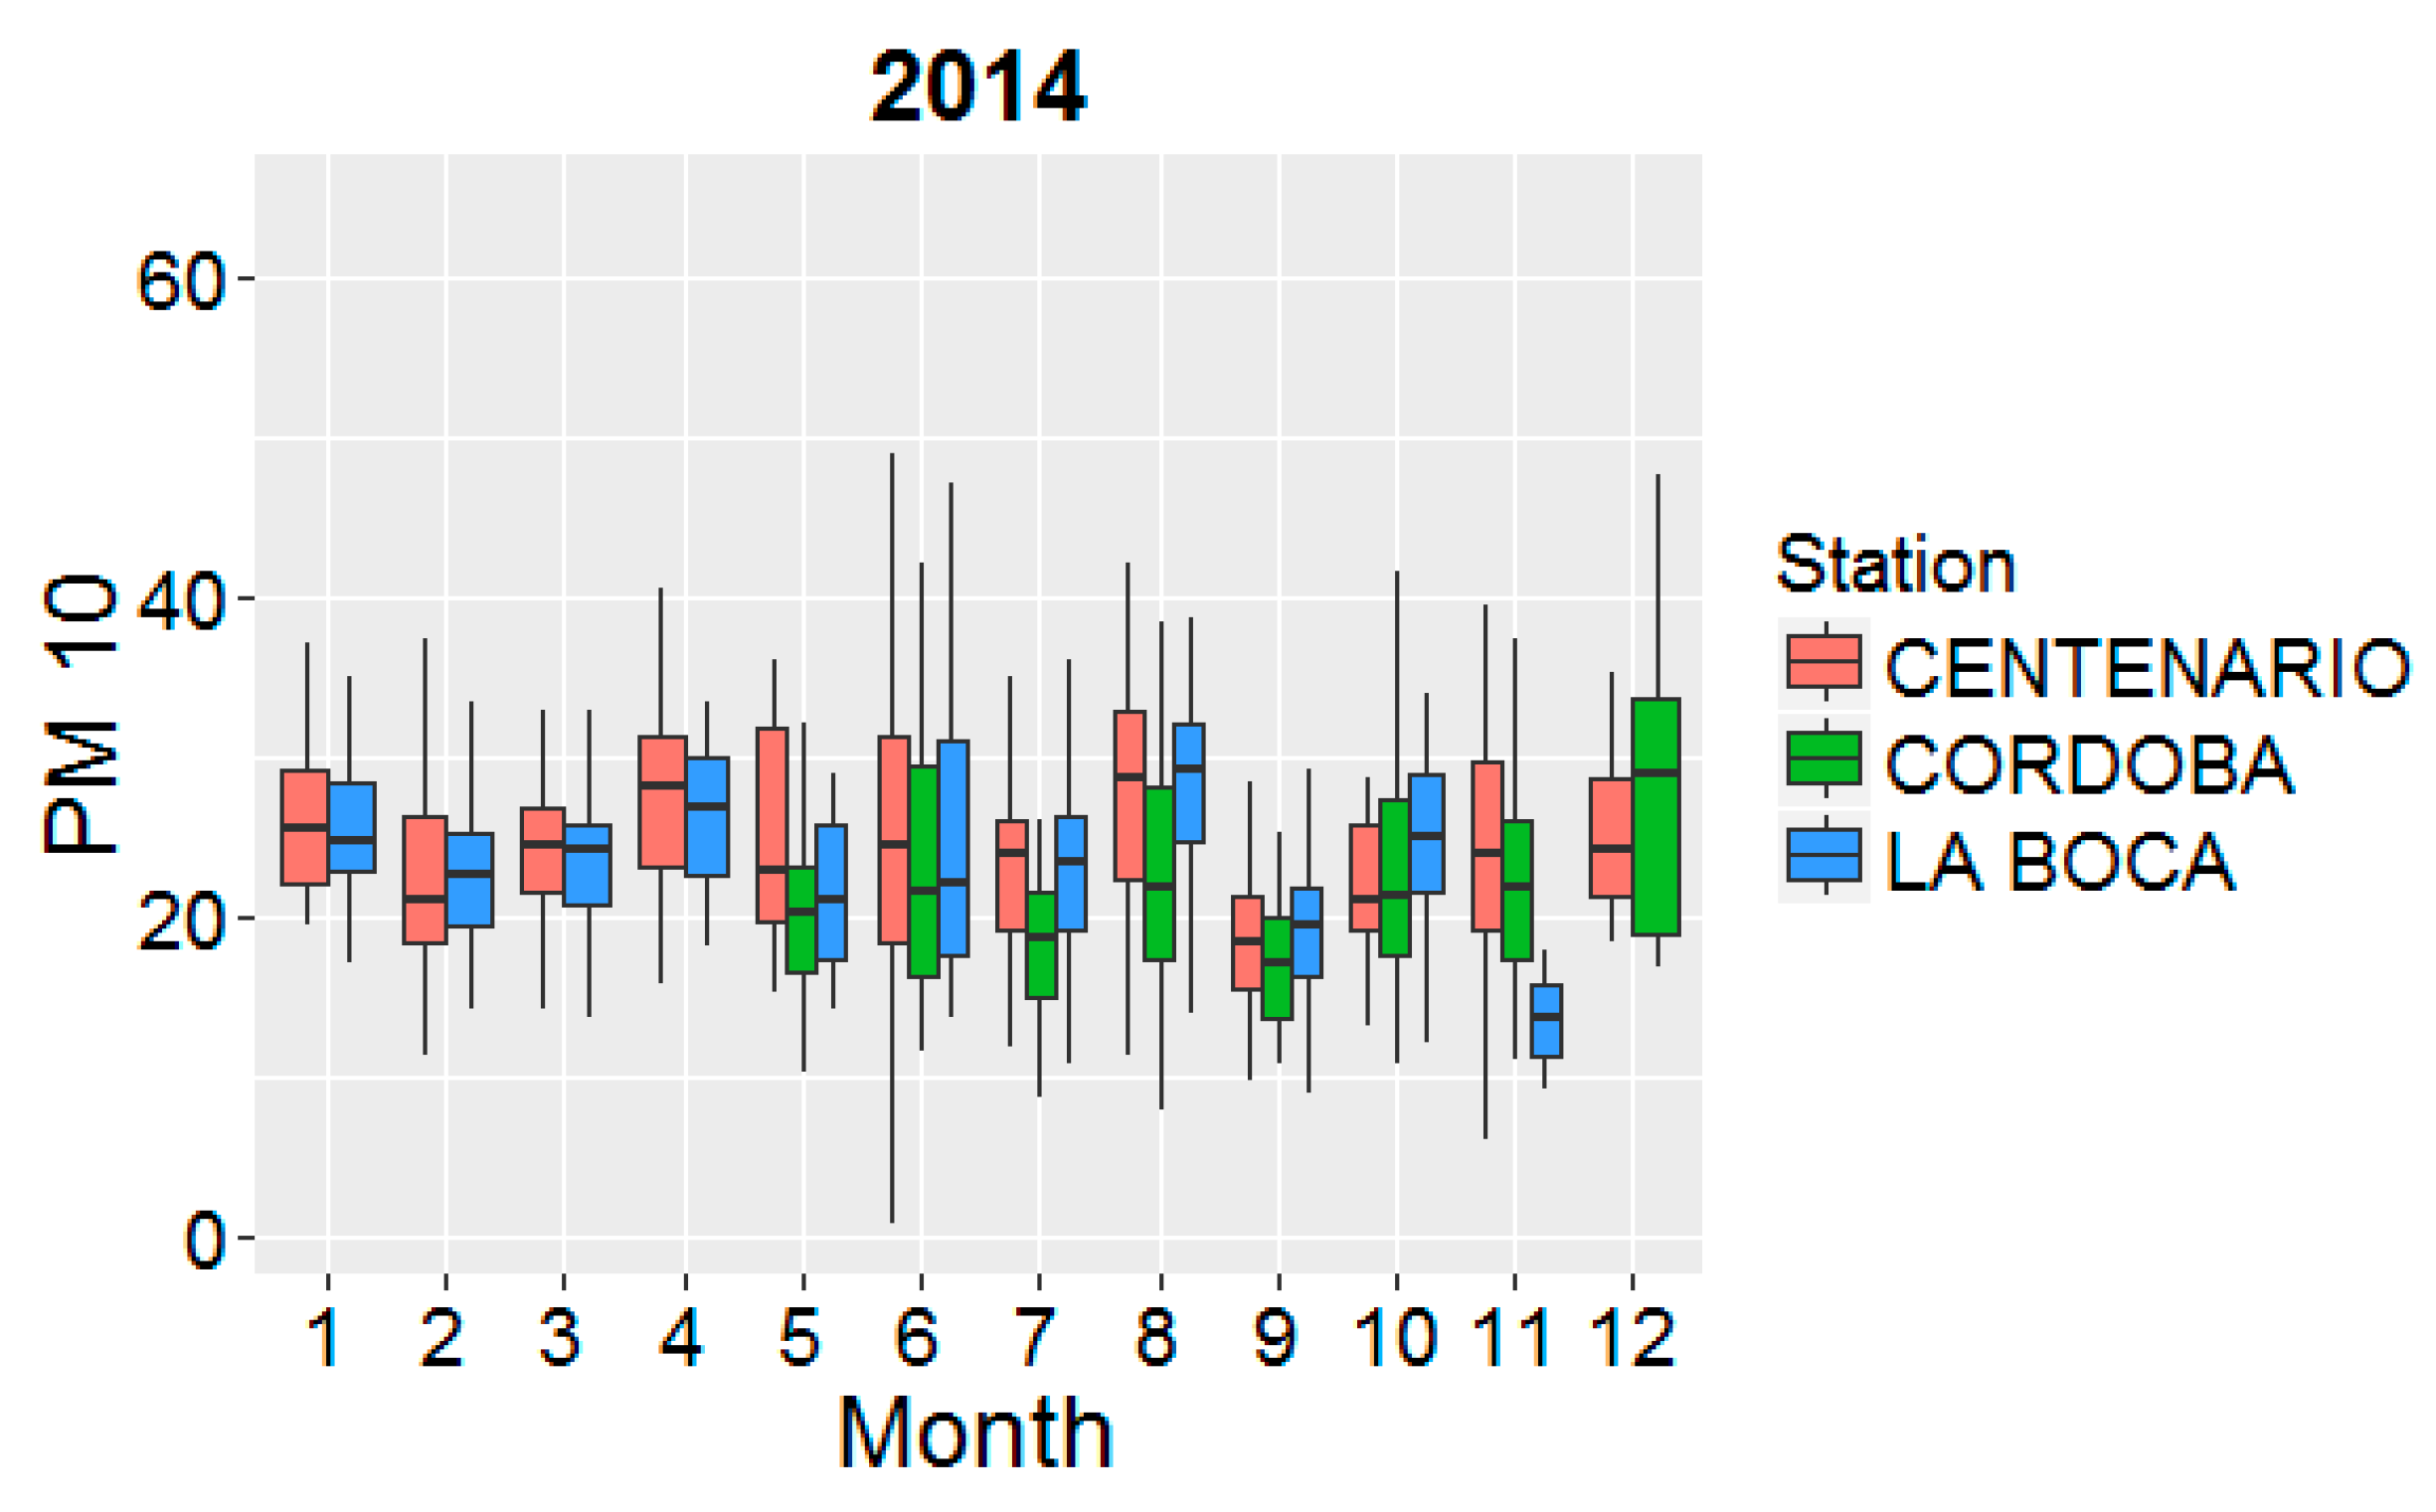
With respect to the PM10 variation troughout the year period, Figure 6 shows the monthly mean for the three stations considered in this study. Monthly means ranged between 13.5 and 29.0 μg/m3, this extreme values correspond to November at La Boca station and December at Córdoba station. During the period May–December, Centenario and La Boca stations reported higher values with respect to Córdoba station, with exception of October (Cordoba slightly exceeds Centenario mean value) and December (Córdoba exceeds La Boca mean value). In general, though some differences are observed, the monthly means did not vary greatly. Higher PM10 mean values are observed for November, December, January, April, June and August. September is the month with the lowest PM10 value, except for La Boca station which lowest value occurred in November. September is also the month with maximum wind speed mean (see Figure 4) and consequently, predominantly east winds may transport the atmospheric particles of the city to surrounding areas, and as a result produce a cleaner atmosphere.

3.2. Aerosol Optical Depth: Satellite and Ground-Based

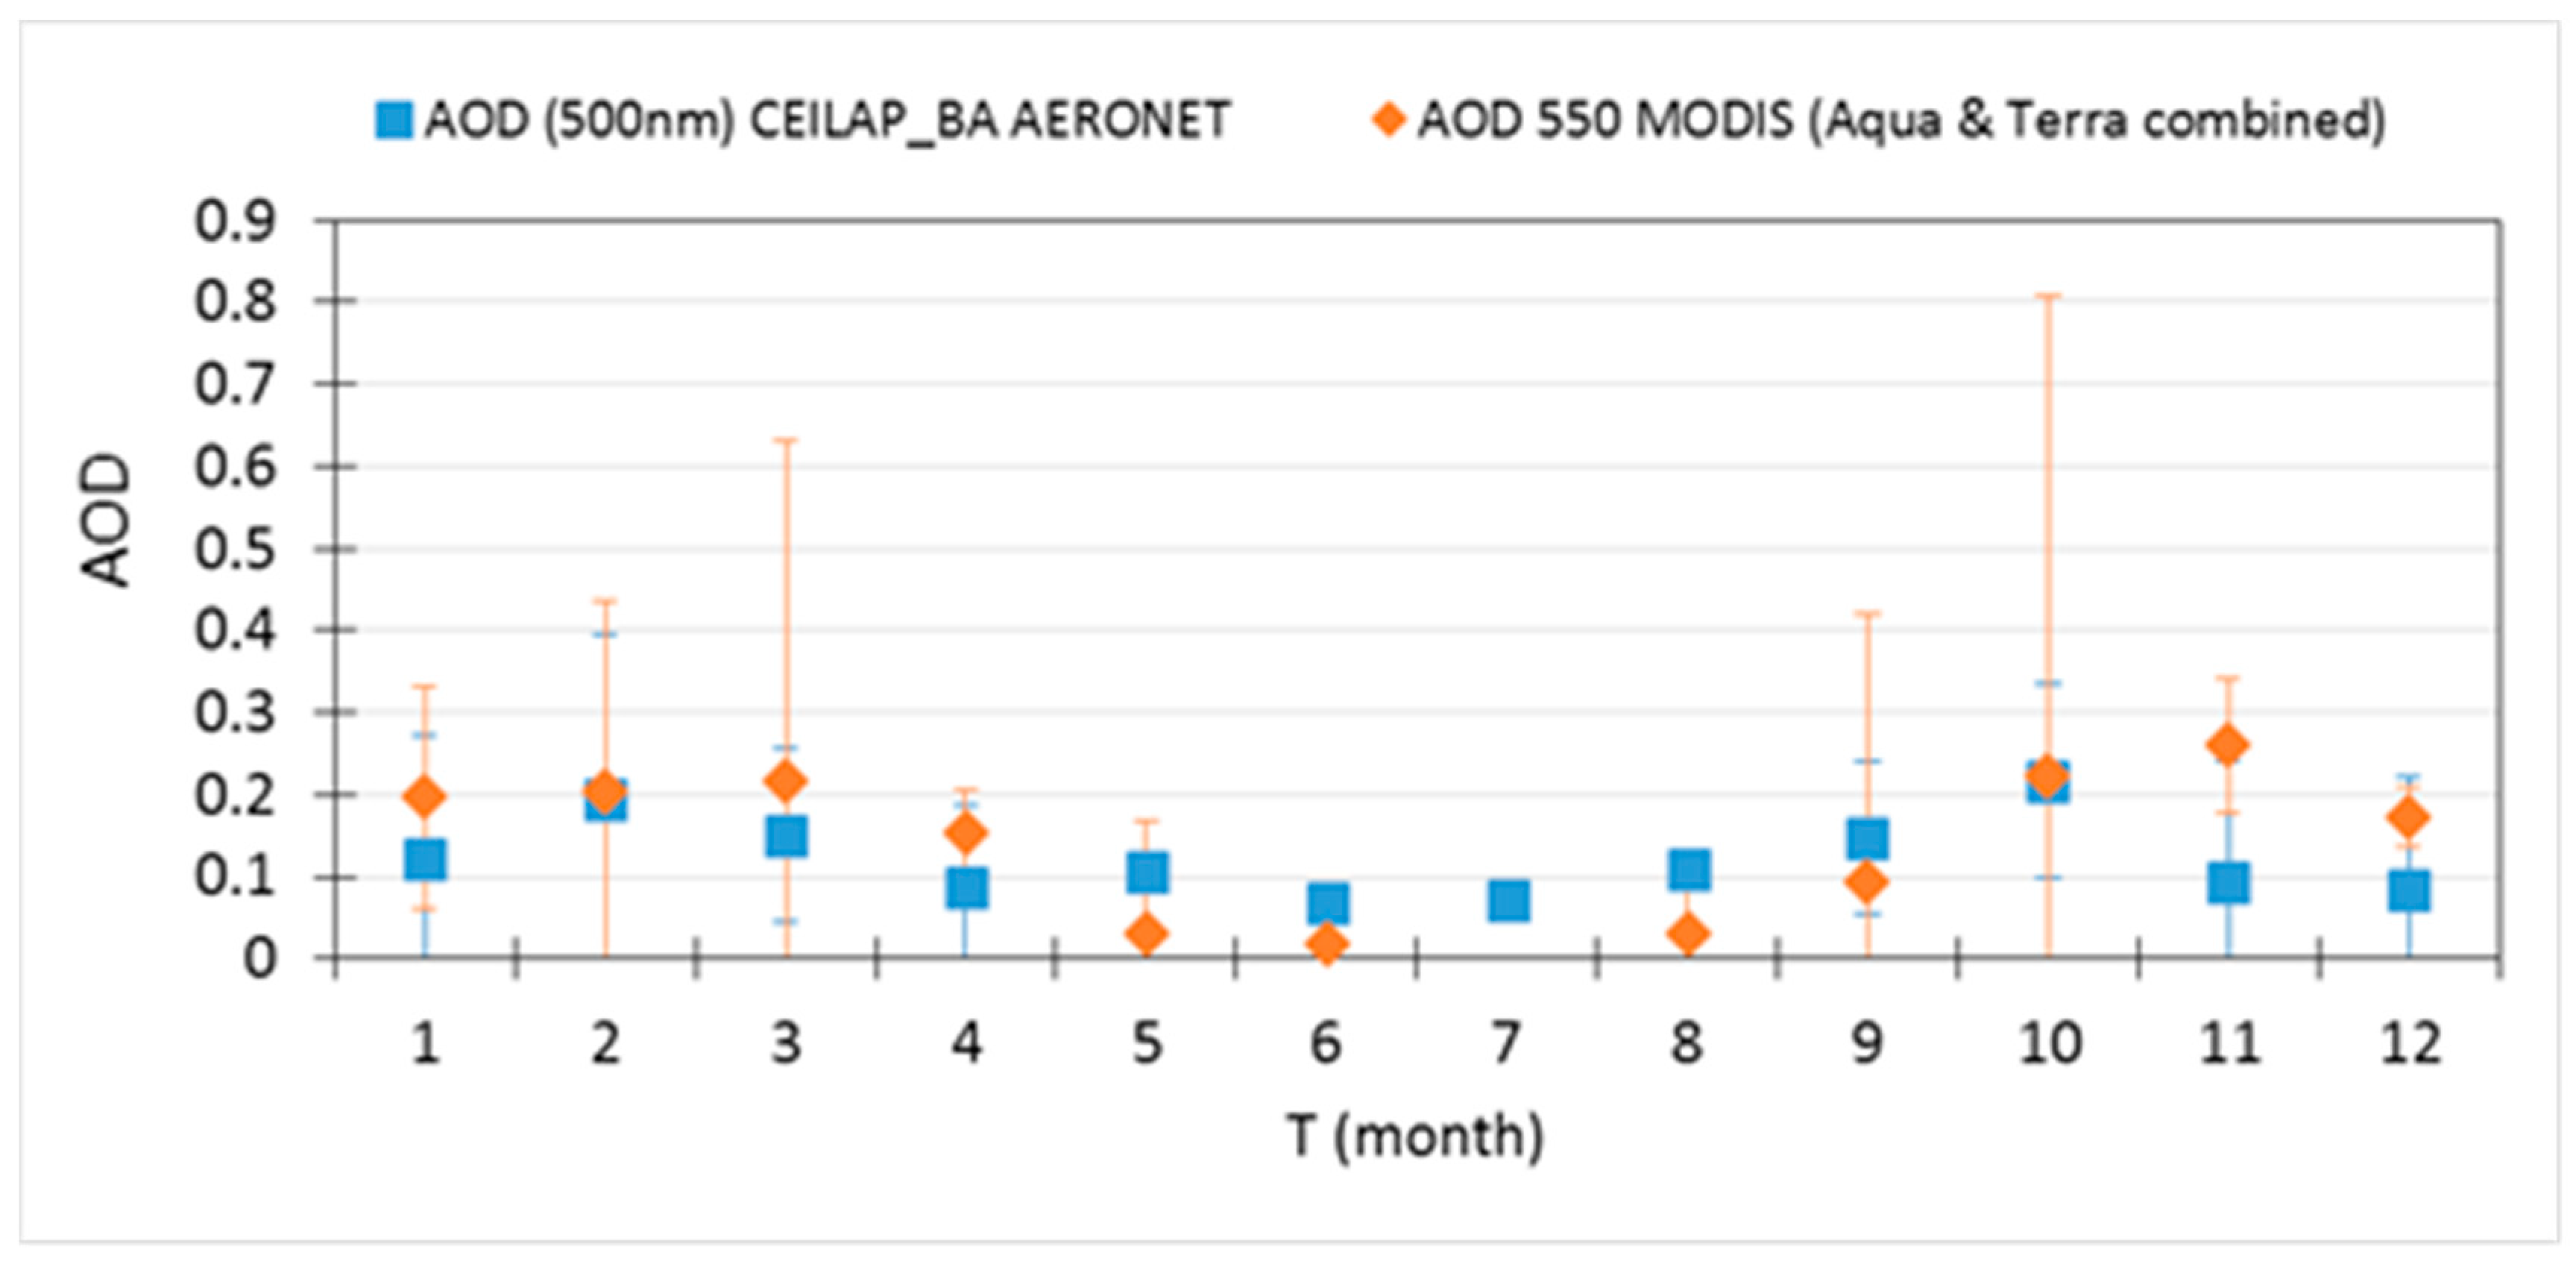
The average value of aerosol optical depth measured at Ceilap-BA AERONET station in 2014 is 0.12 ± 0.25, a rather low value, considering that it is a megacity. The aerosol optical depth annual mean obtained from MODIS sensor (Aqua & Terra combined) averaged for the area corresponding to Buenos Aires city strictly for 2014 is 0.35 ± 0.31.
Monthly variation of AOD at Ceilap-BA AERONET station and for the corresponding MODIS pixel is shown in Figure 7. Mean values obtained from MODIS are higher than those observed with AERONET from January to April and November–December, and lower from May to September. The monthly variation pattern is similar for both datasets. In general, the monthly variation observed for the AOD coincide with that obtained for PM measurements, with higher values in December–January and April and lower values in September.

3.3. Spatial Distribution of Aerosols

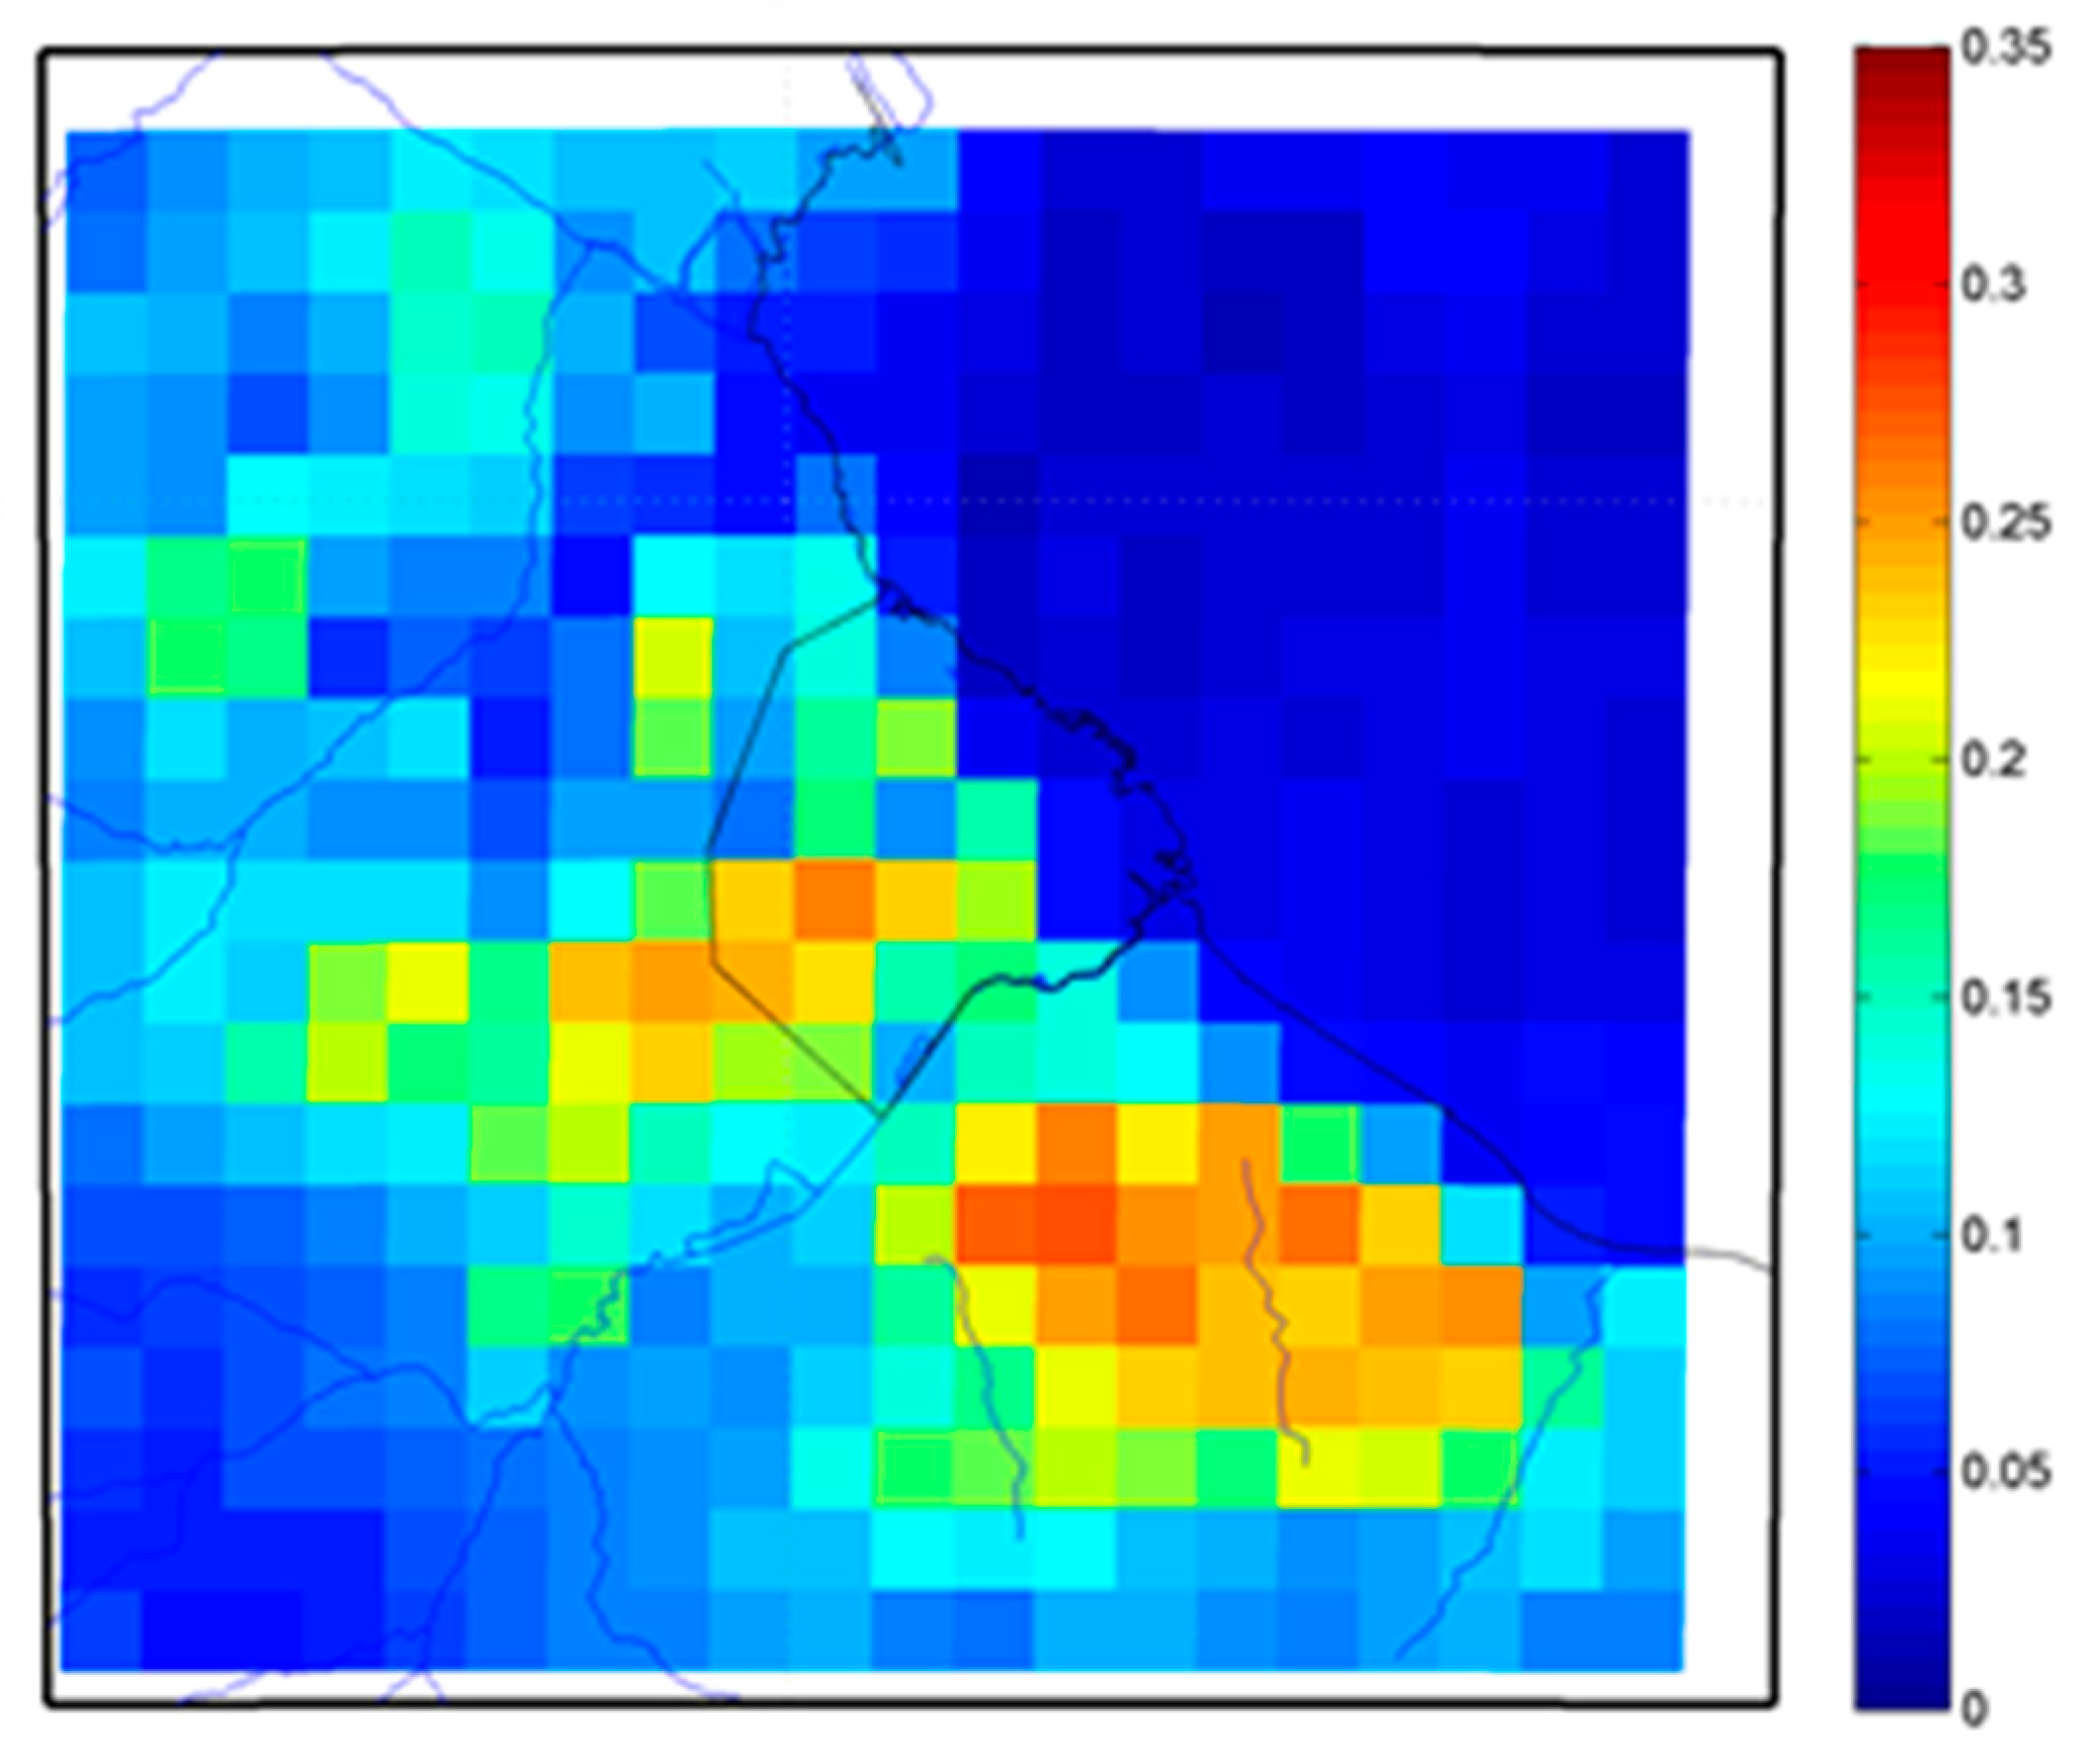
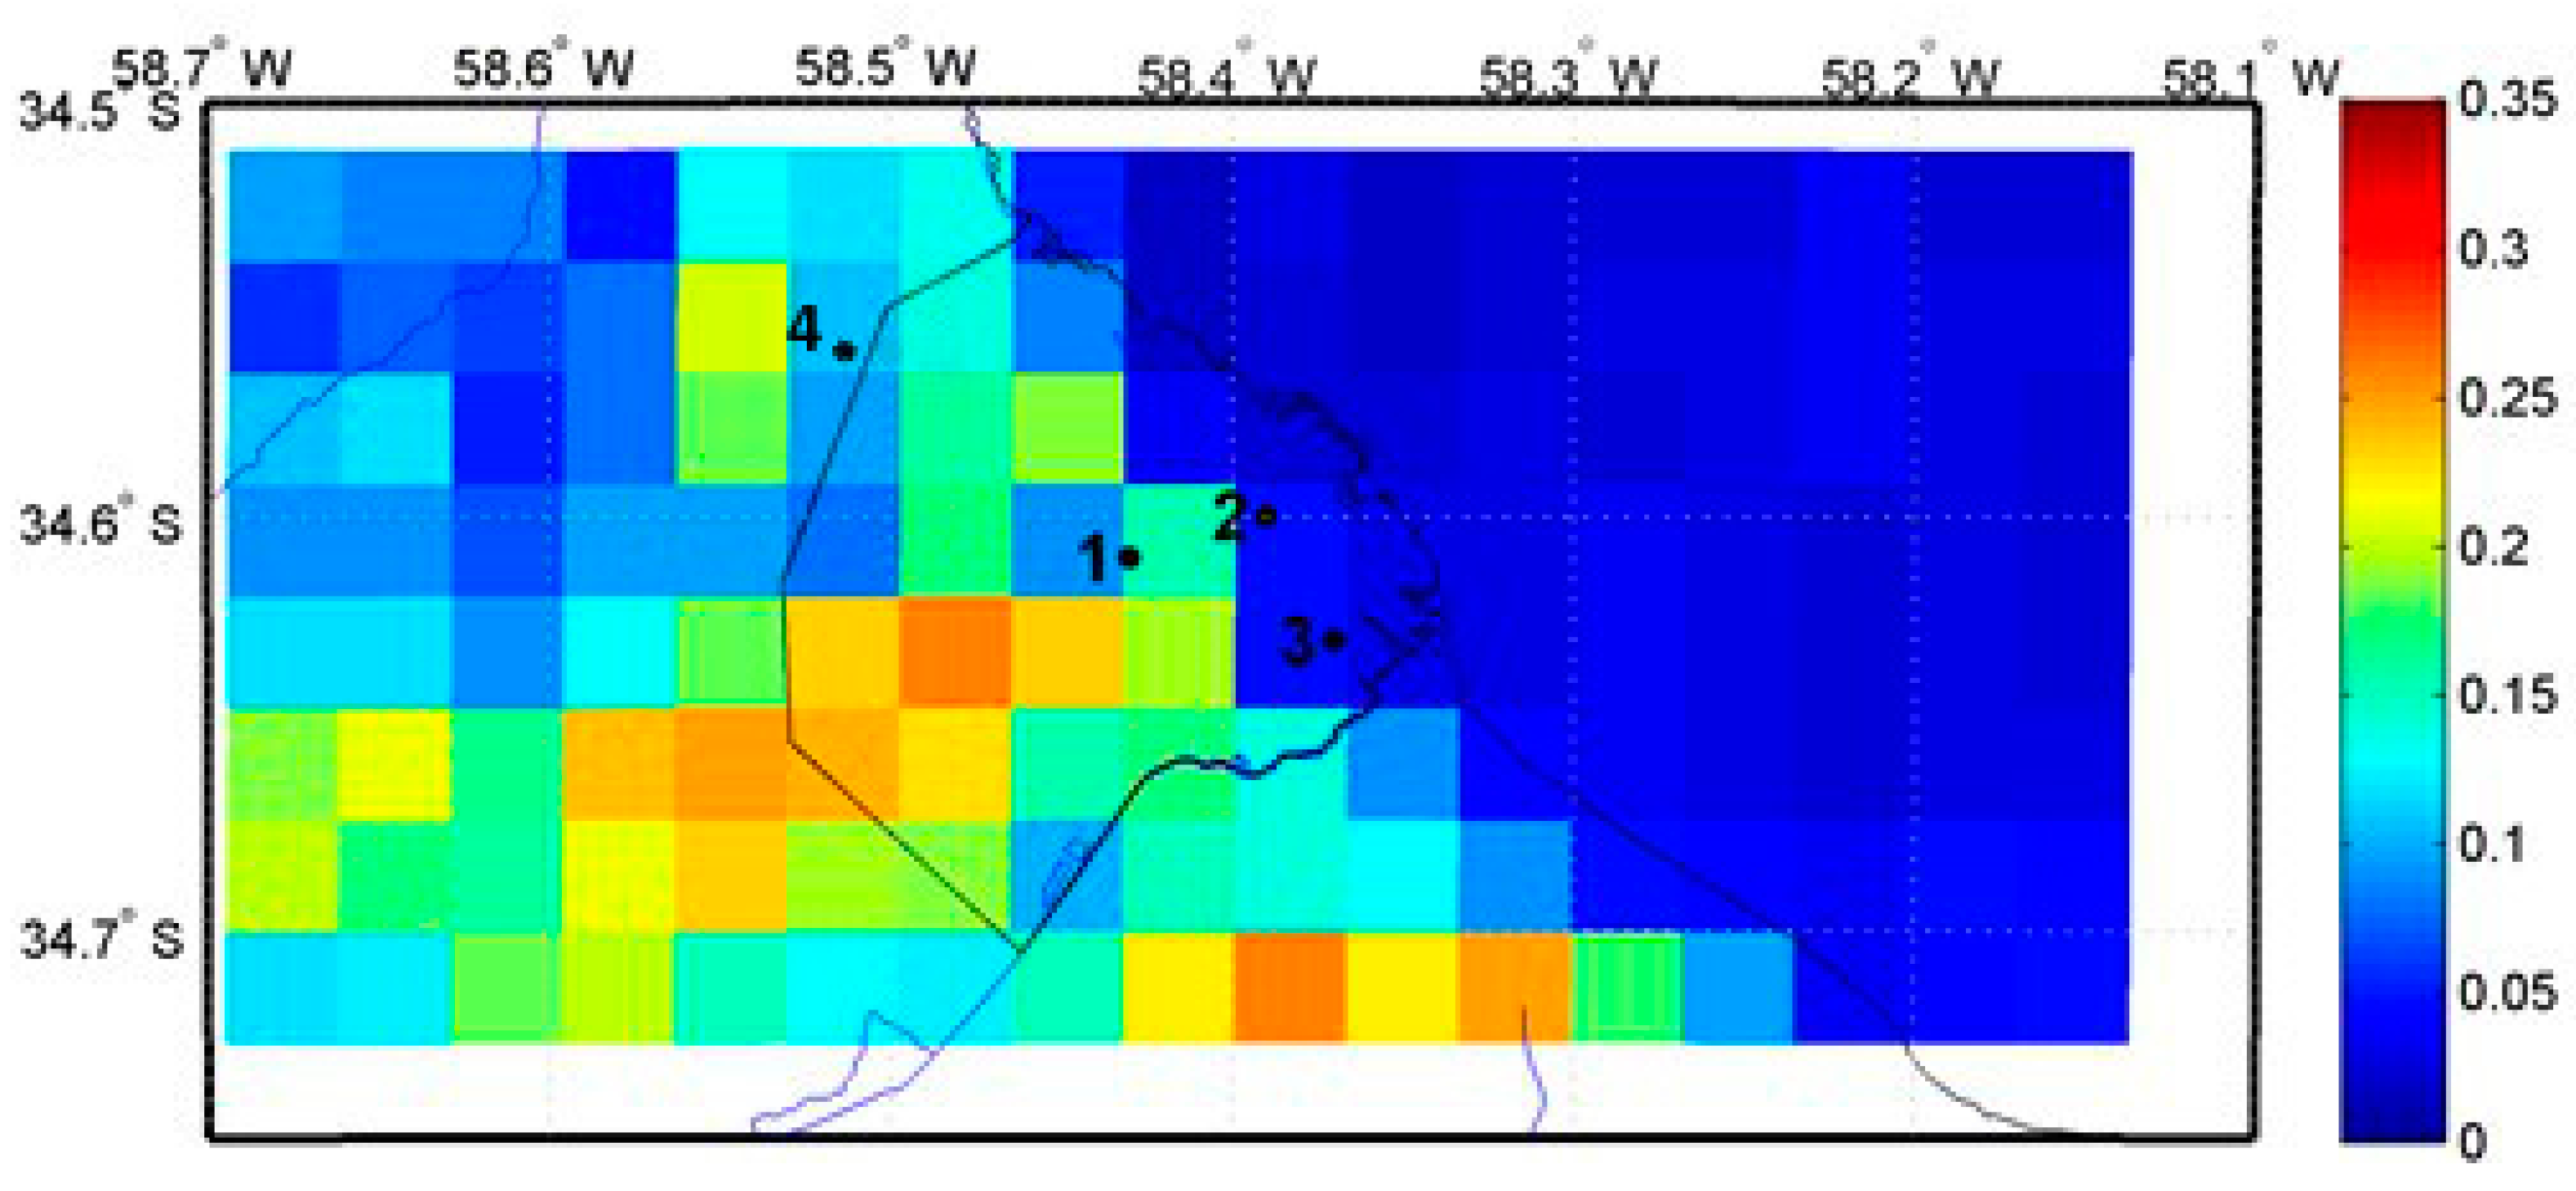
Figure 8 shows the AOD annual average spatial distribution over Buenos Aires city and Gran Buenos Aires for 2014.
The area with the lowest AOD values correspond to the Río de la Plata estuary. Within the city of Buenos Aires the lowest values are also observed in areas near the river, possibly due to the incidence of east-west direction winds, which are predominant throughout the year. The areas with higher AOD values are observed within the territory of Buenos Aires city and also in Gran Buenos Aires: to the west and mainly to the south of Buenos Aires city.
The area with the highest AOD values in Buenos Aires city corresponds to the south-west zone in which Liniers, Mataderos and Parque Avellaneda neighbourhoods are located. As can be observed in Figure 9, there are no PM monitoring stations in this high-level AOD values area.
Regarding the areas of higher values of ODA in Greater Buenos Aires correspond to:
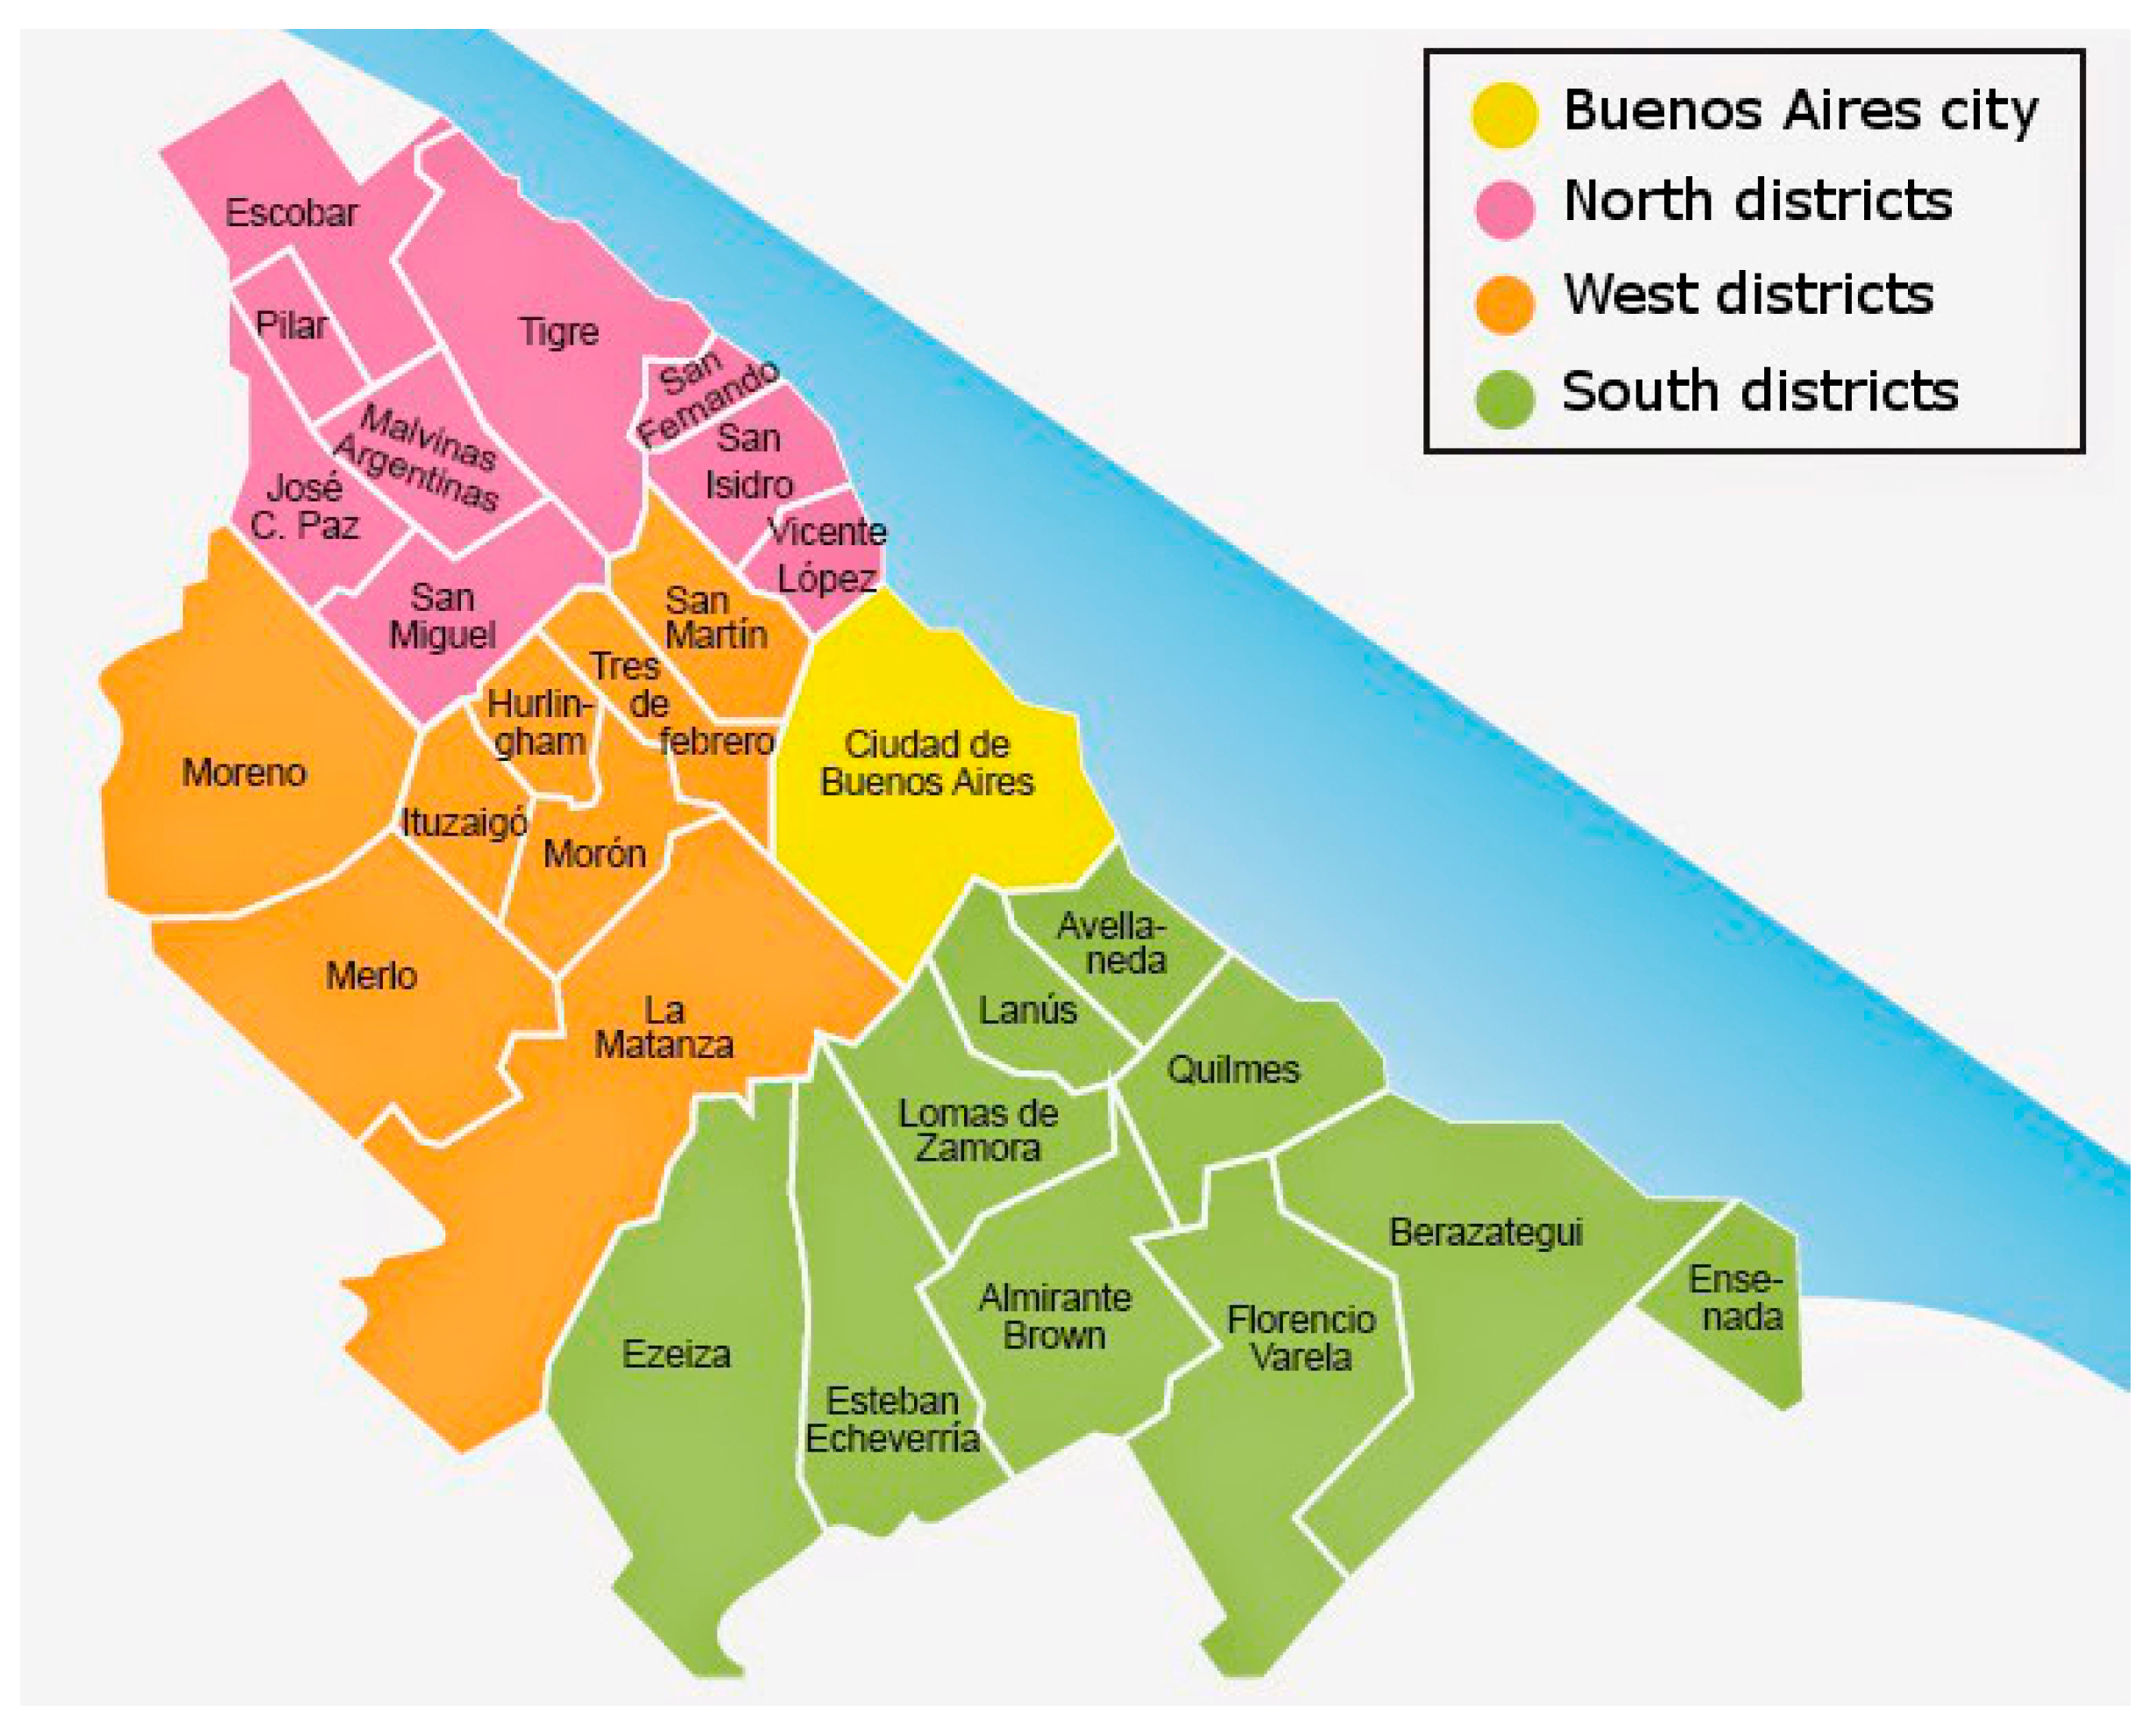
  • The one located west of Buenos Aires city corresponds to the La Matanza district, the largest and most populated district of the region. Currently, the district’s main economic activities are manufacturing, transportation and storage, and commercial activities.
  • The one localed south Buenos Aires city corresponds to an historical industrial area of Argentina. Among the industries located in this area we find tanneries, metallurgical, plastic, electric, electronic, chemistry, glass, textile and automobile industries, shoe factories, construction materials industries. In this area, it is located the most densely populated district after Buenos Aires city: Lanús, with important commercial and residential areas and a large number of low socio-economic neighborhoods and irregular settlements.
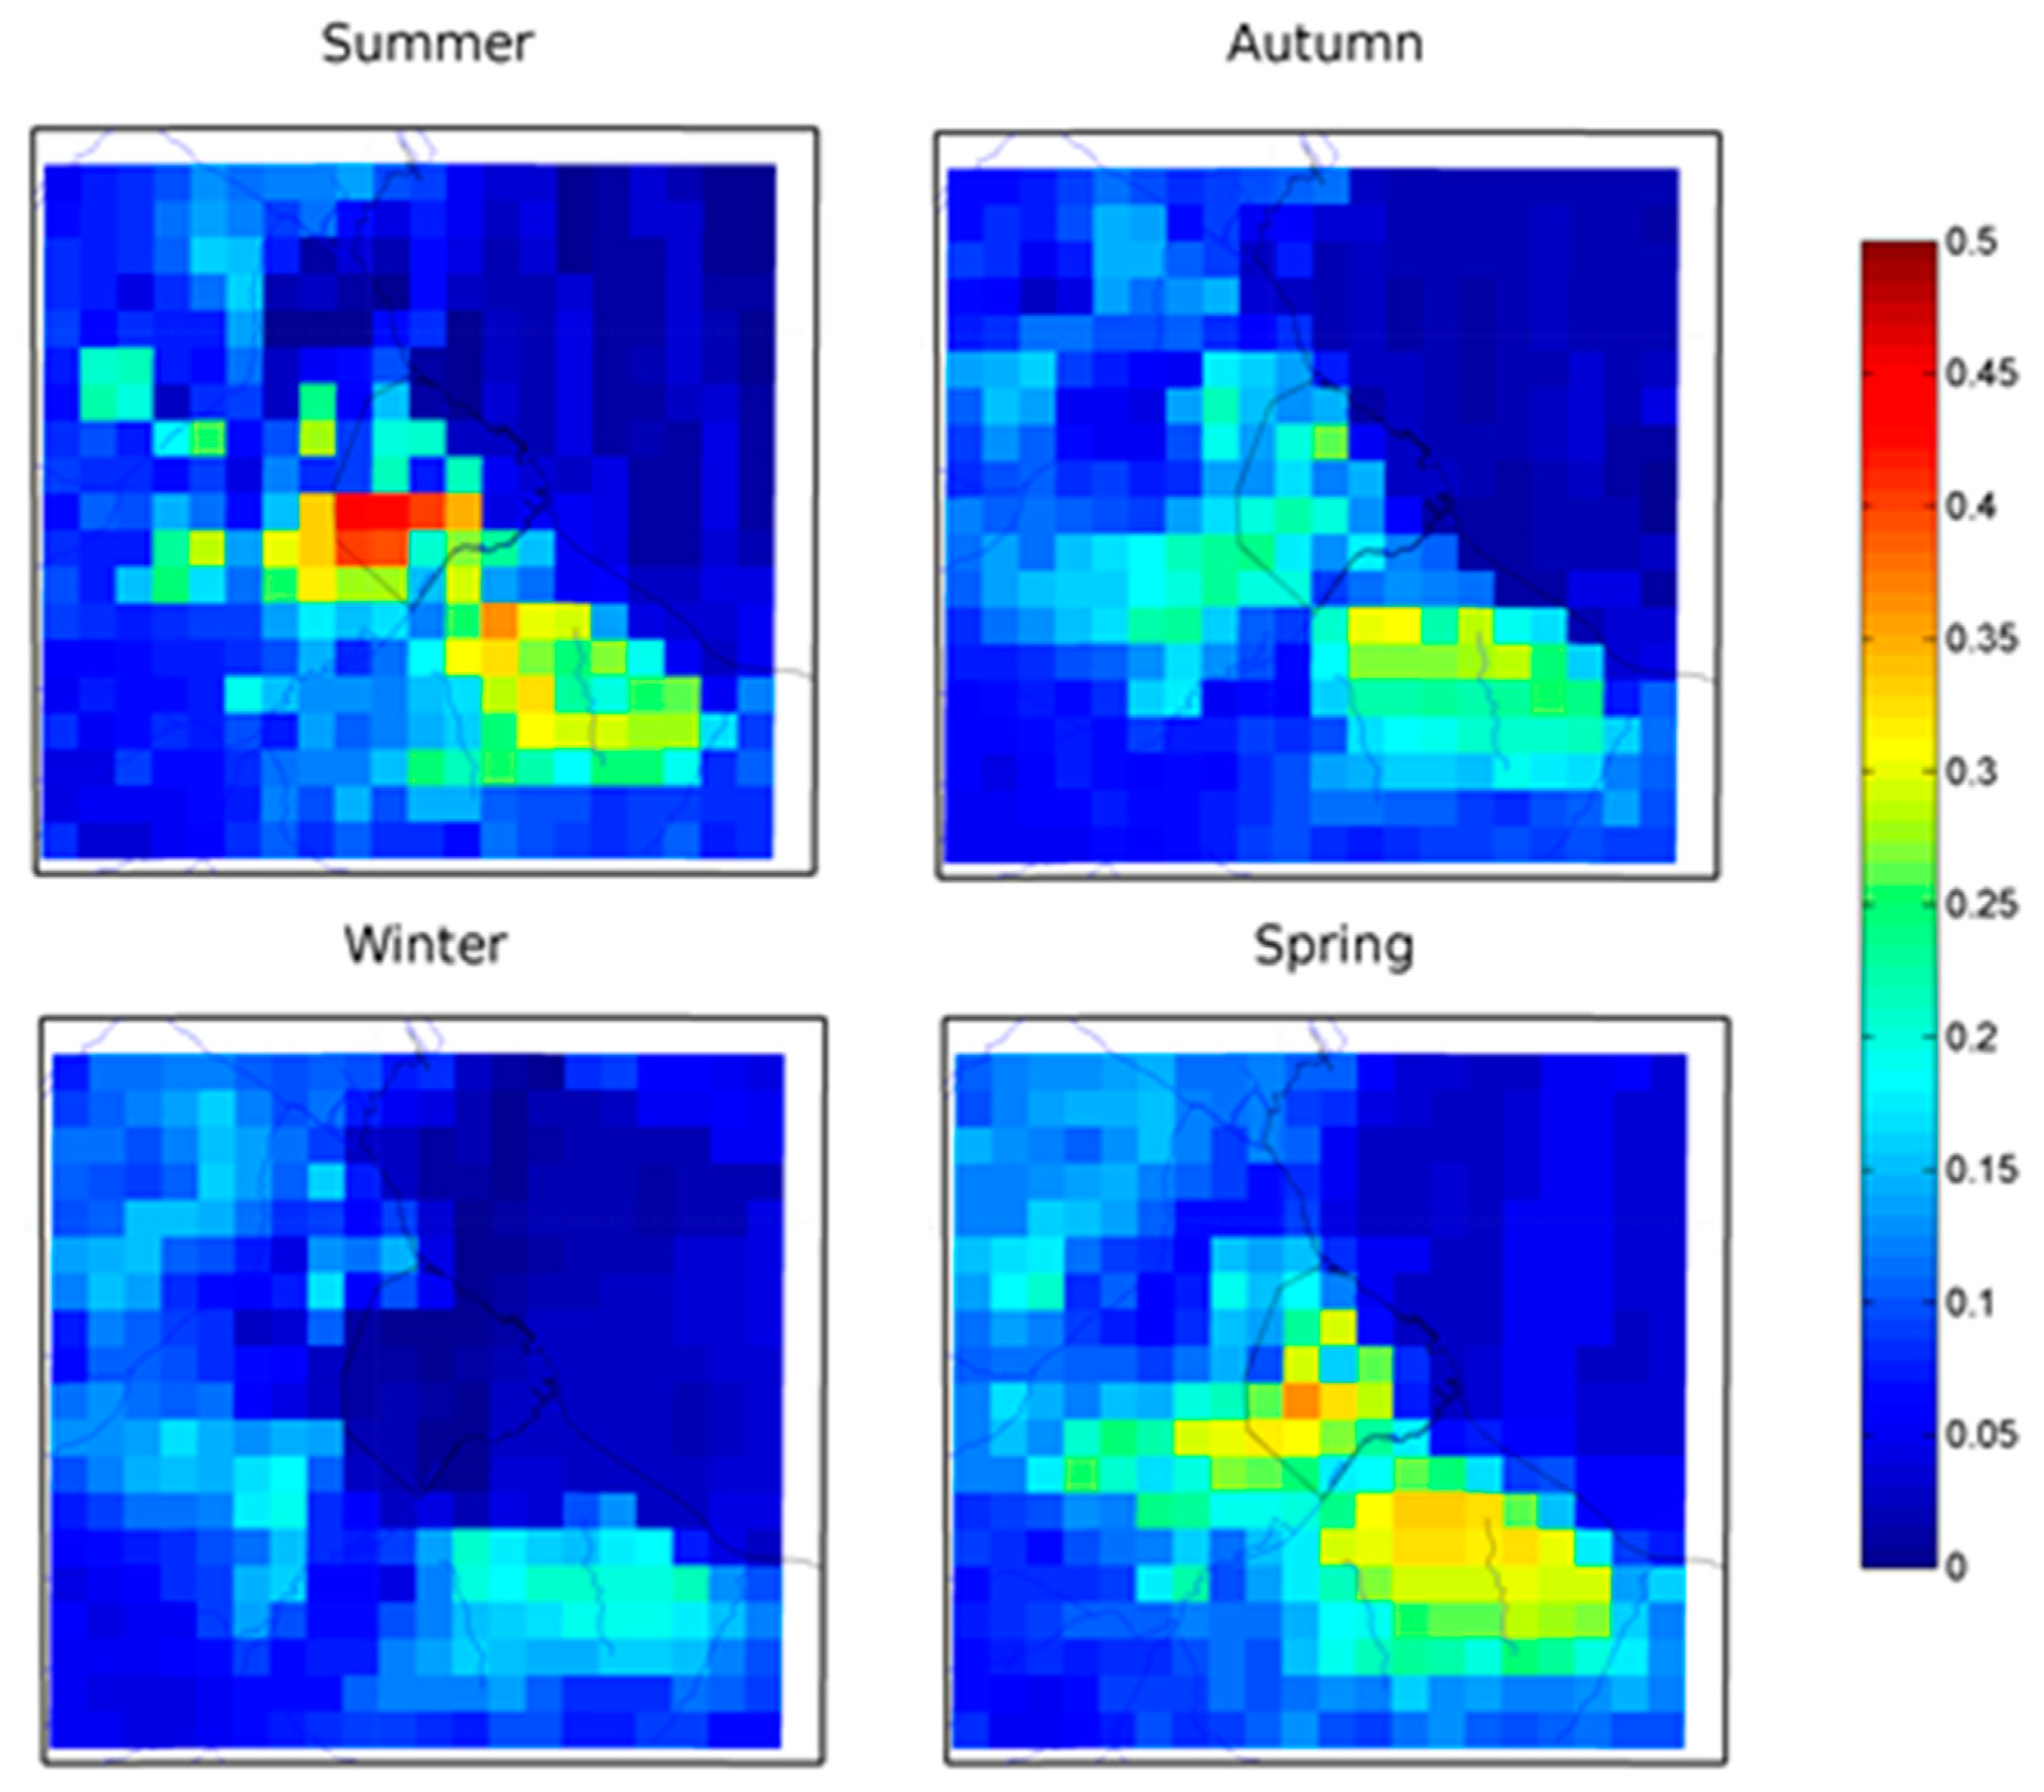
As it can be observed in Figure 10, which shows the AOD seasonal mean for the study area, these areas with higher values of AOD are the same throughout the year, which indicates that in those zones there may be permanent sources emitting aerosols to the atmosphere. Lowest AOD values in winter at Buenos Aires city are due to lack or very few MODIS data available for this period. Nevertheless AERONET measurements also report very low values in winter.
To our knowledge there are no studies of air quality or ground-based monitoring in these areas in which the satellite dataset shows higher AOD values.
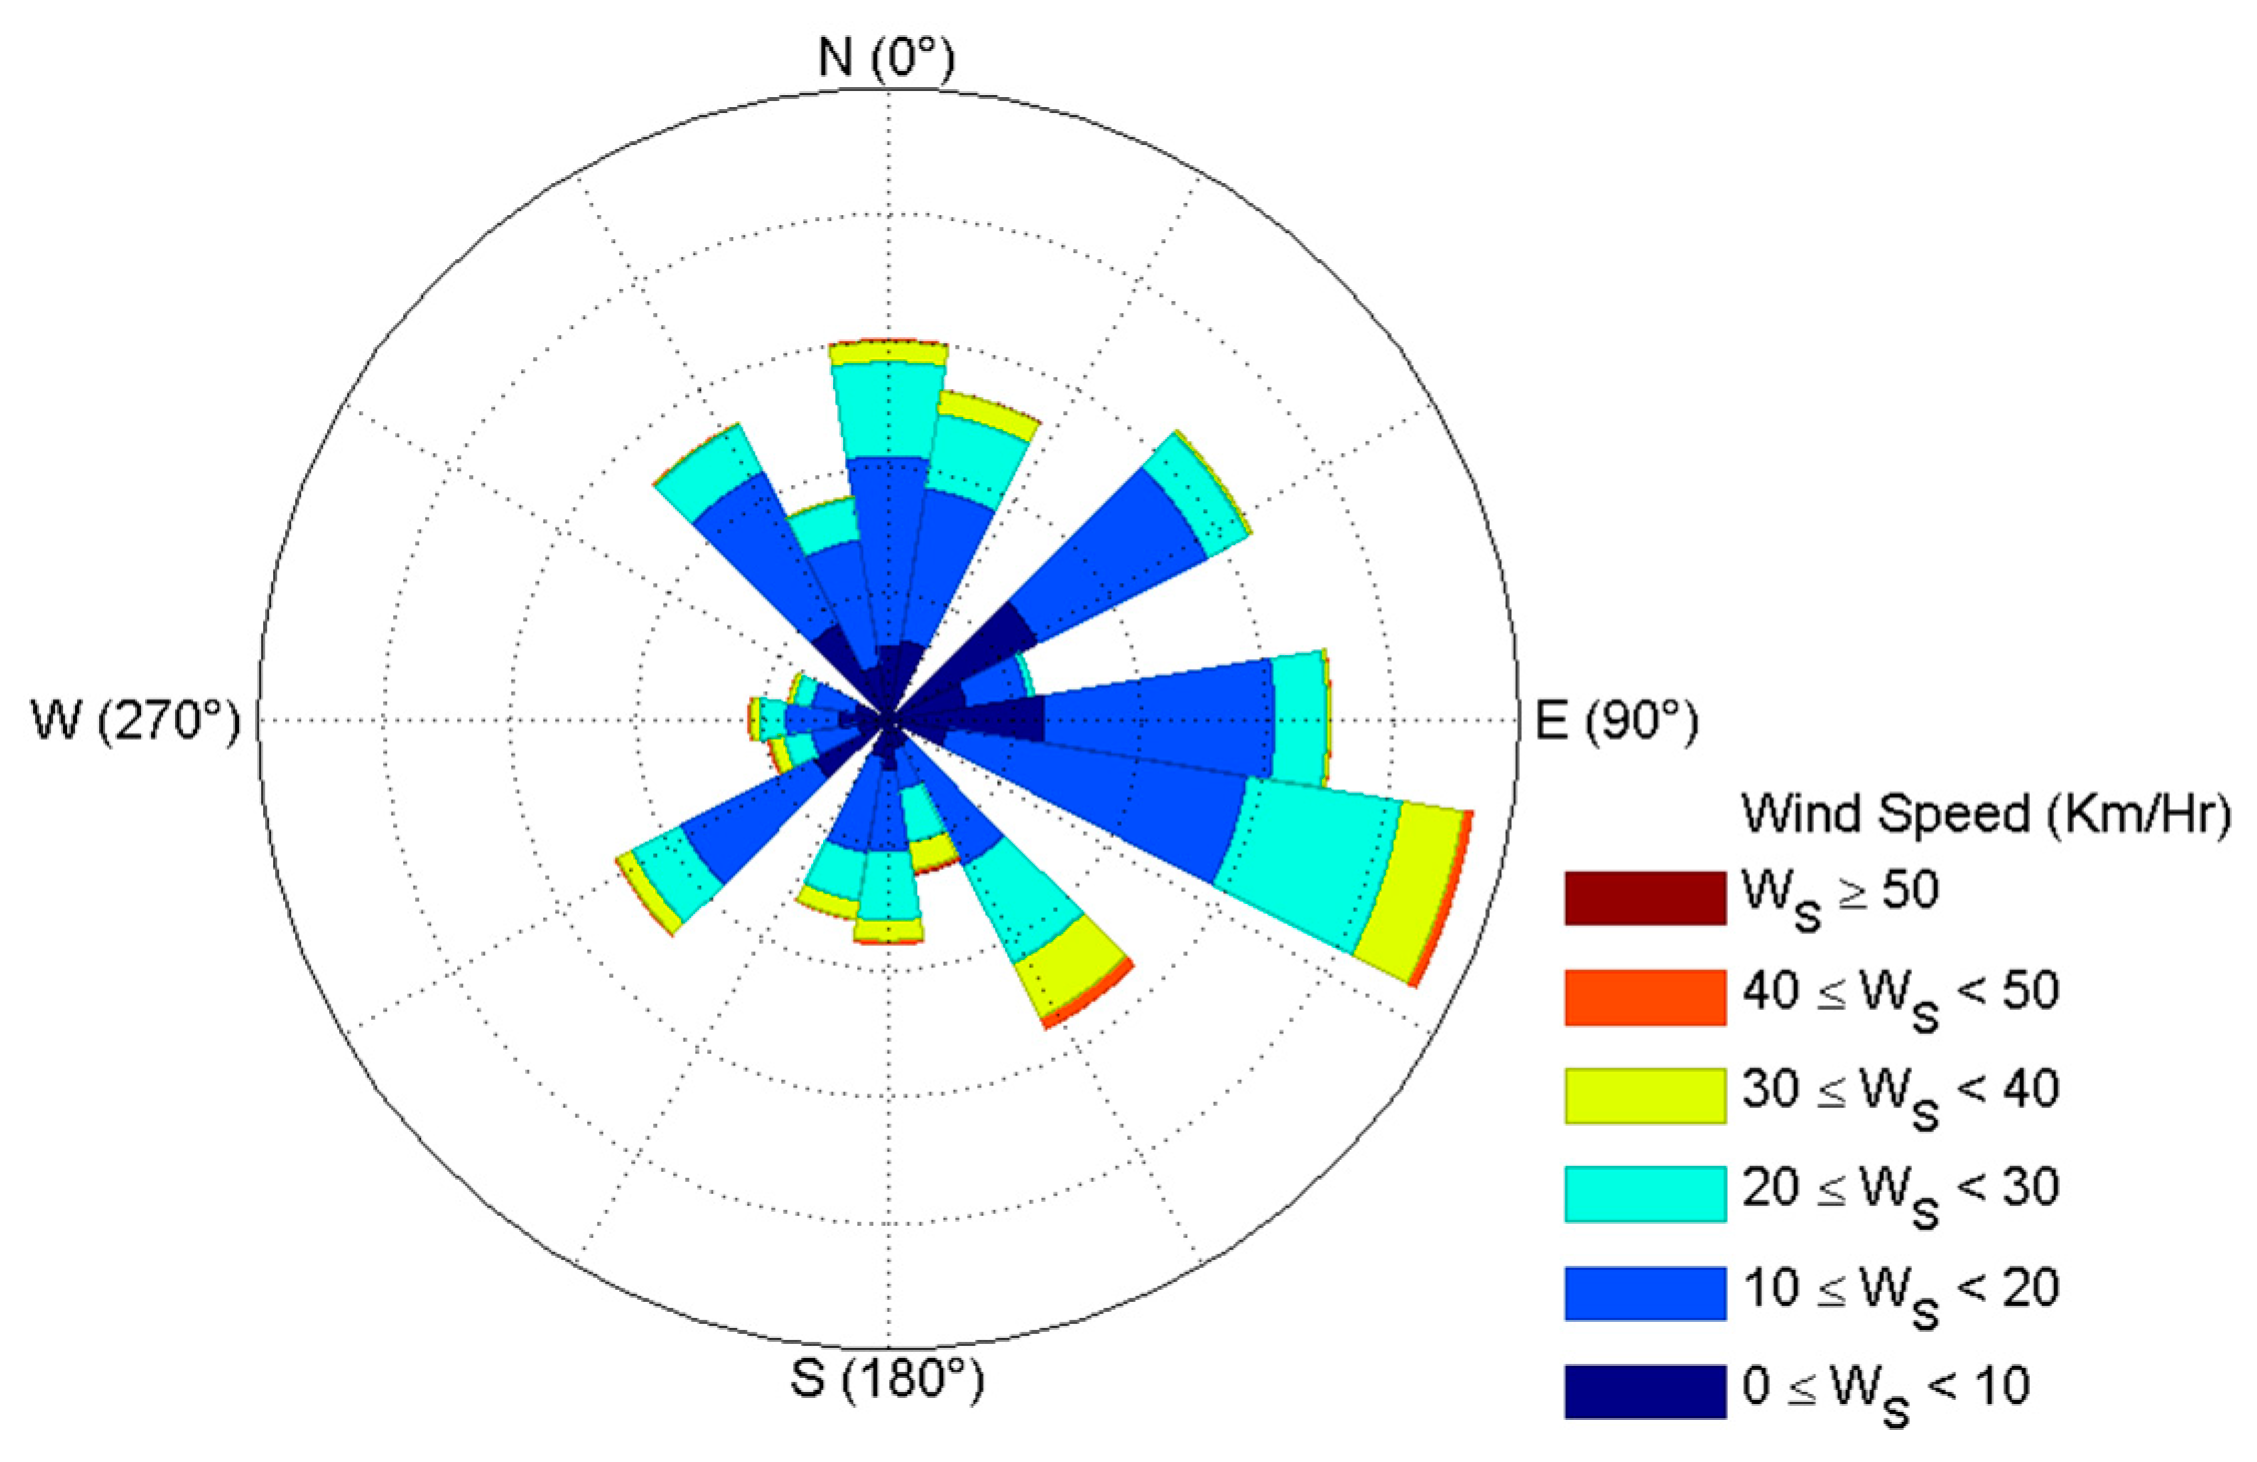
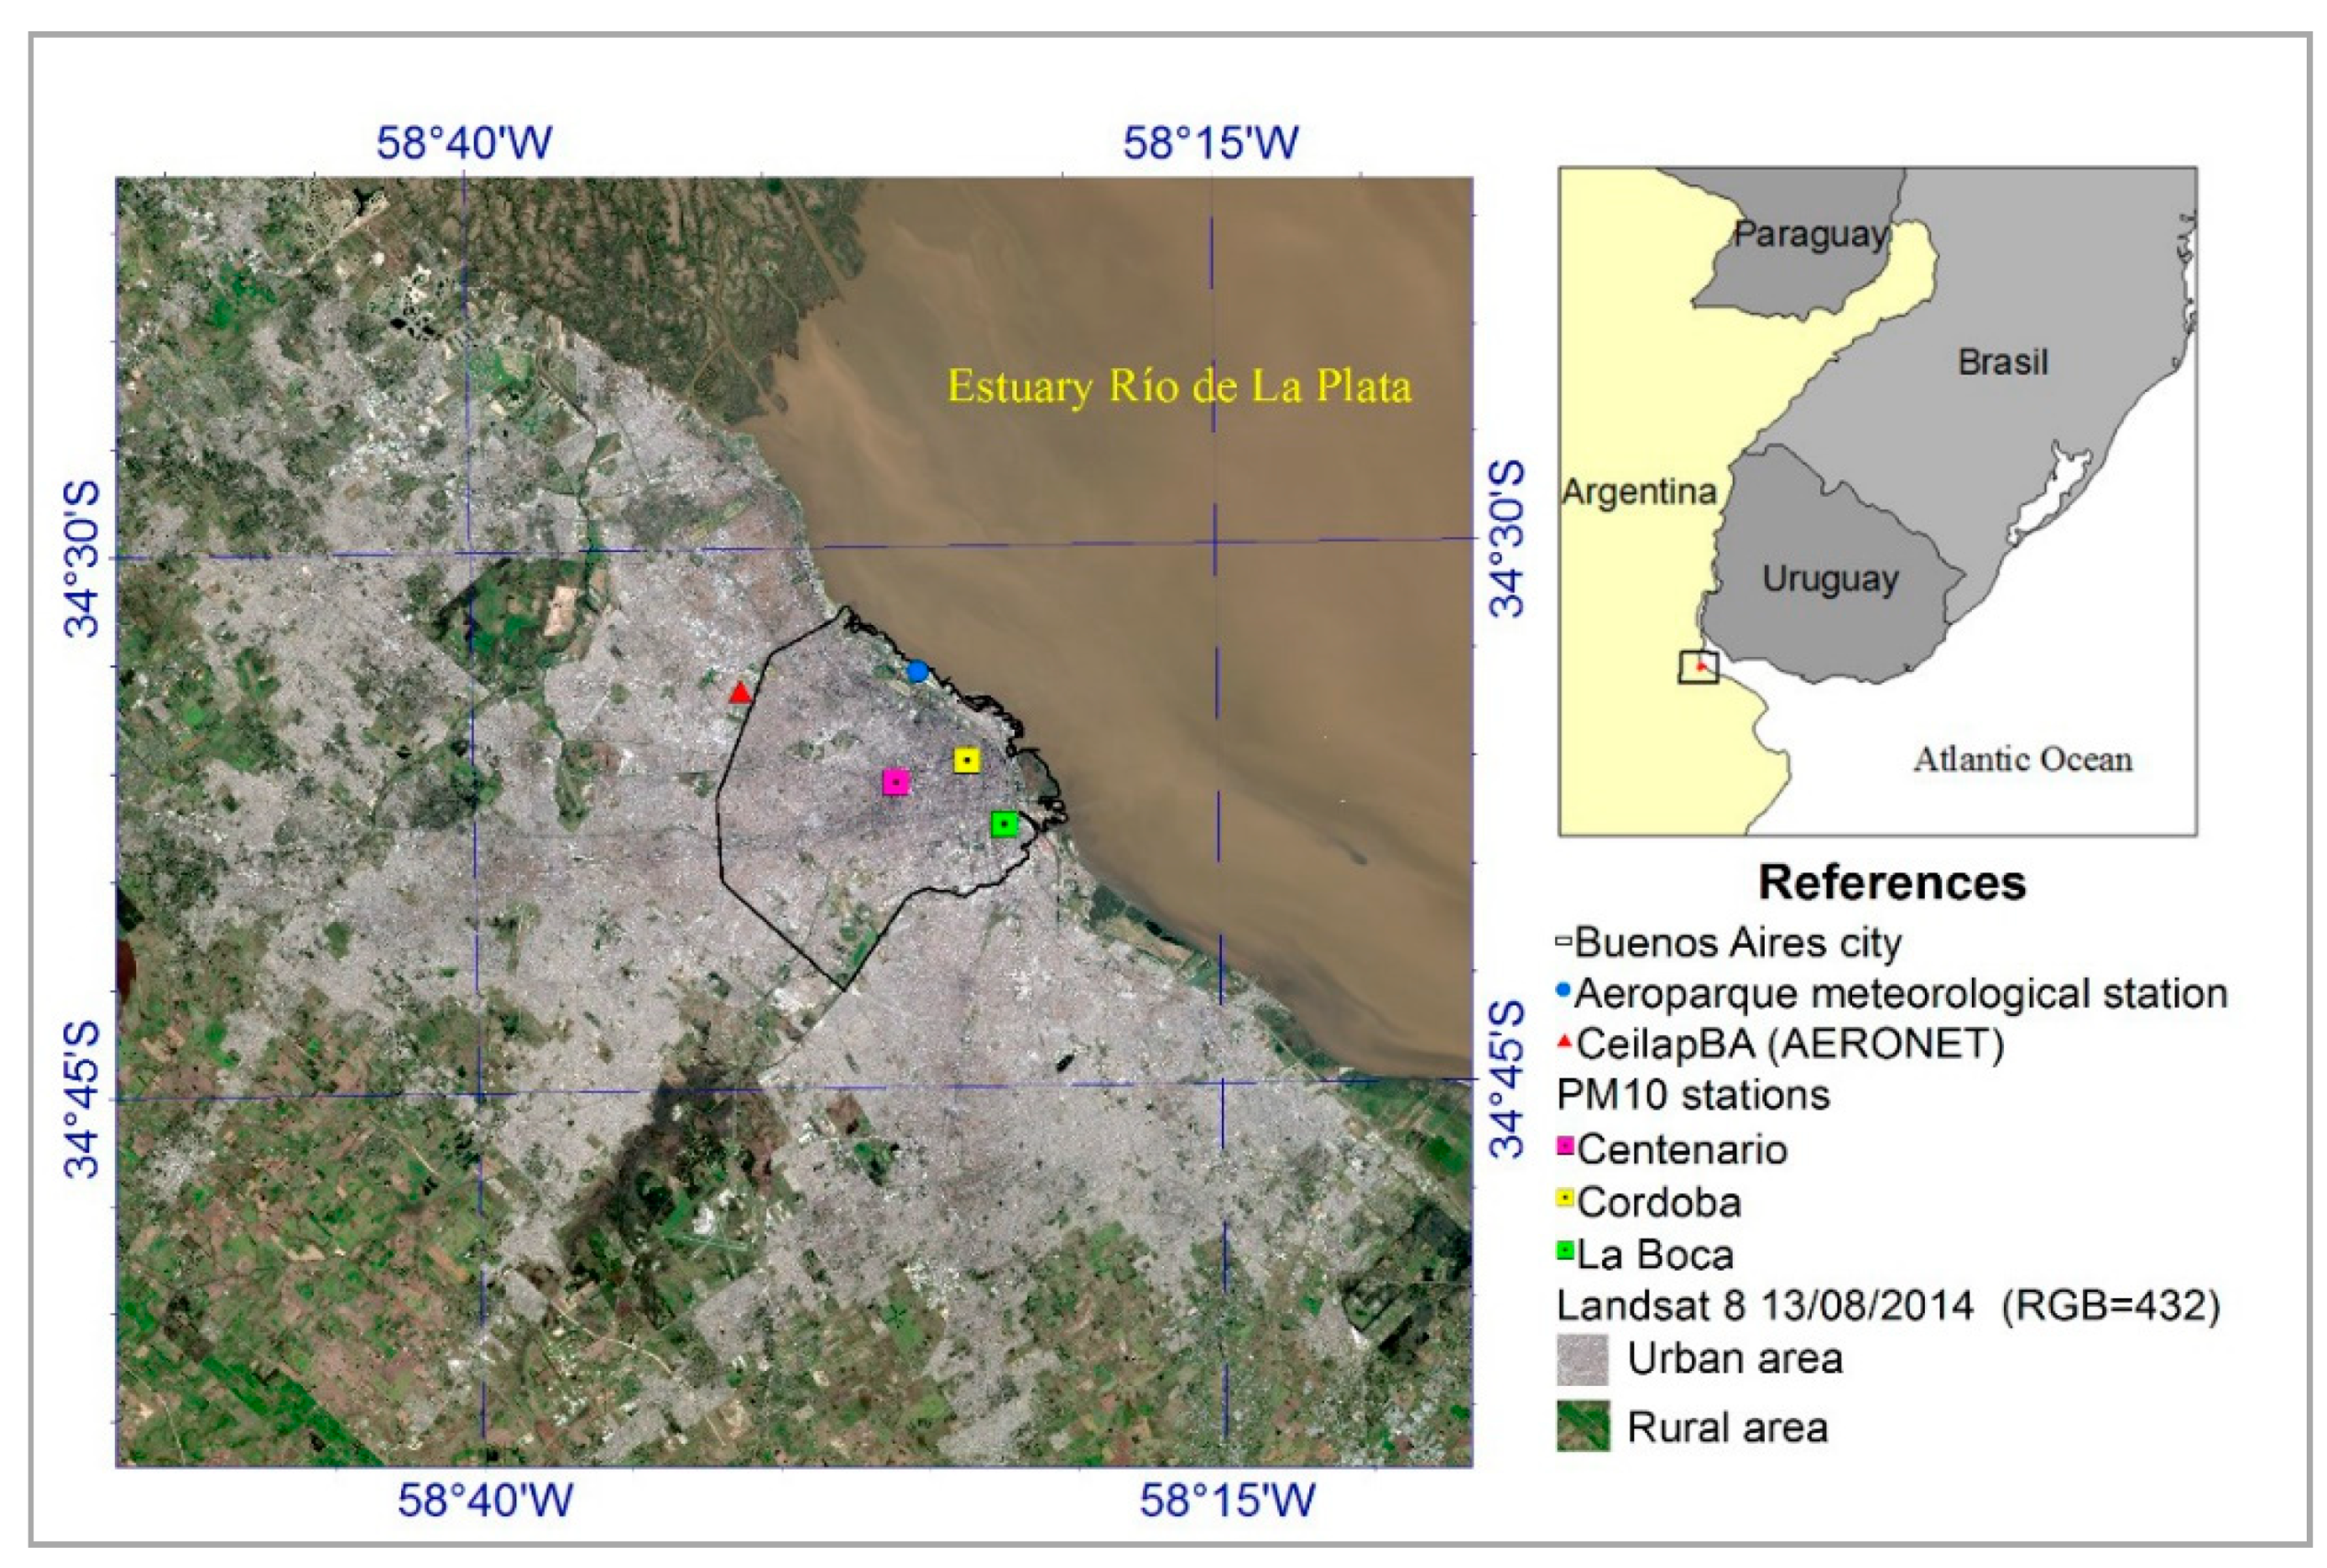
Figure 11 shows the wind rose for each month of 2014. The direction range 67.5°–122.5° corresponds to the East-South East (the range centered at 135° would be East) and is the direction of arrival of the winds from the Río de la Plata and Atlantic Ocean (see Figure 1). During september and july winds of this range direction prevail significantly with respect to other months, both months with low levels of atmospheric aerosols.
In contrast, during April, October, November and December, though they also have an important contribution of East-South East winds (centered in 112.5°), an important contribution of winds from the range direction centered in 135° is observed, which implies the entrainment of particulate material from the south-east zone of the great Buenos Aires. Consequently, these winds carry pollution from the south Gran Buenos Aires districts.
PM10 measured in Buenos Aires city is strongly related to the direction of the wind. For example, though January is the month in which most people are in summer holidays, and therefore fleet is reduced (one of the main anthropogenic sources), high PM10 values are reported. During this month the influence of north winds (from North West to North East) is appreciable. During February the influence of the winds from the North is reduced and those coming from the Río de La Plata Estuary increase. Moreover, February is also a holiday month and is the most rainy month and, as a result, PM10 levels decrease.
These results indicate that not only the amount of precipitations and wind velocity influence atmospheric aerosol loading, but also wind direction is a very important factor in the levels of PM10. It can even be observed that variations for the same month, between the PM10 values at the different monitoring stations also show a correlation with the wind direction. For example, during November, La Boca reports PM10 values appreciably lower than the other stations, which is consistent with the predominance and high speed of the winds in the range centered at 112.5° and 135° in Figure 11, since these winds pass first by La Boca station and afterwards by the other stations, dragging the particulate material of the city in its passage.
The frequent incoming winds from the Río de la Plata are responsible for the cleaner atmosphere at the eastern part of the city (coastal to the river), where lower AOD values are detected from satellite sensors. The opposite situation is observed for the areas further away from the river coast (specially, the west of the city), caused by the easterly winds that arrive to these areas carrying the particulate material that they have dragged during their passage across the city.

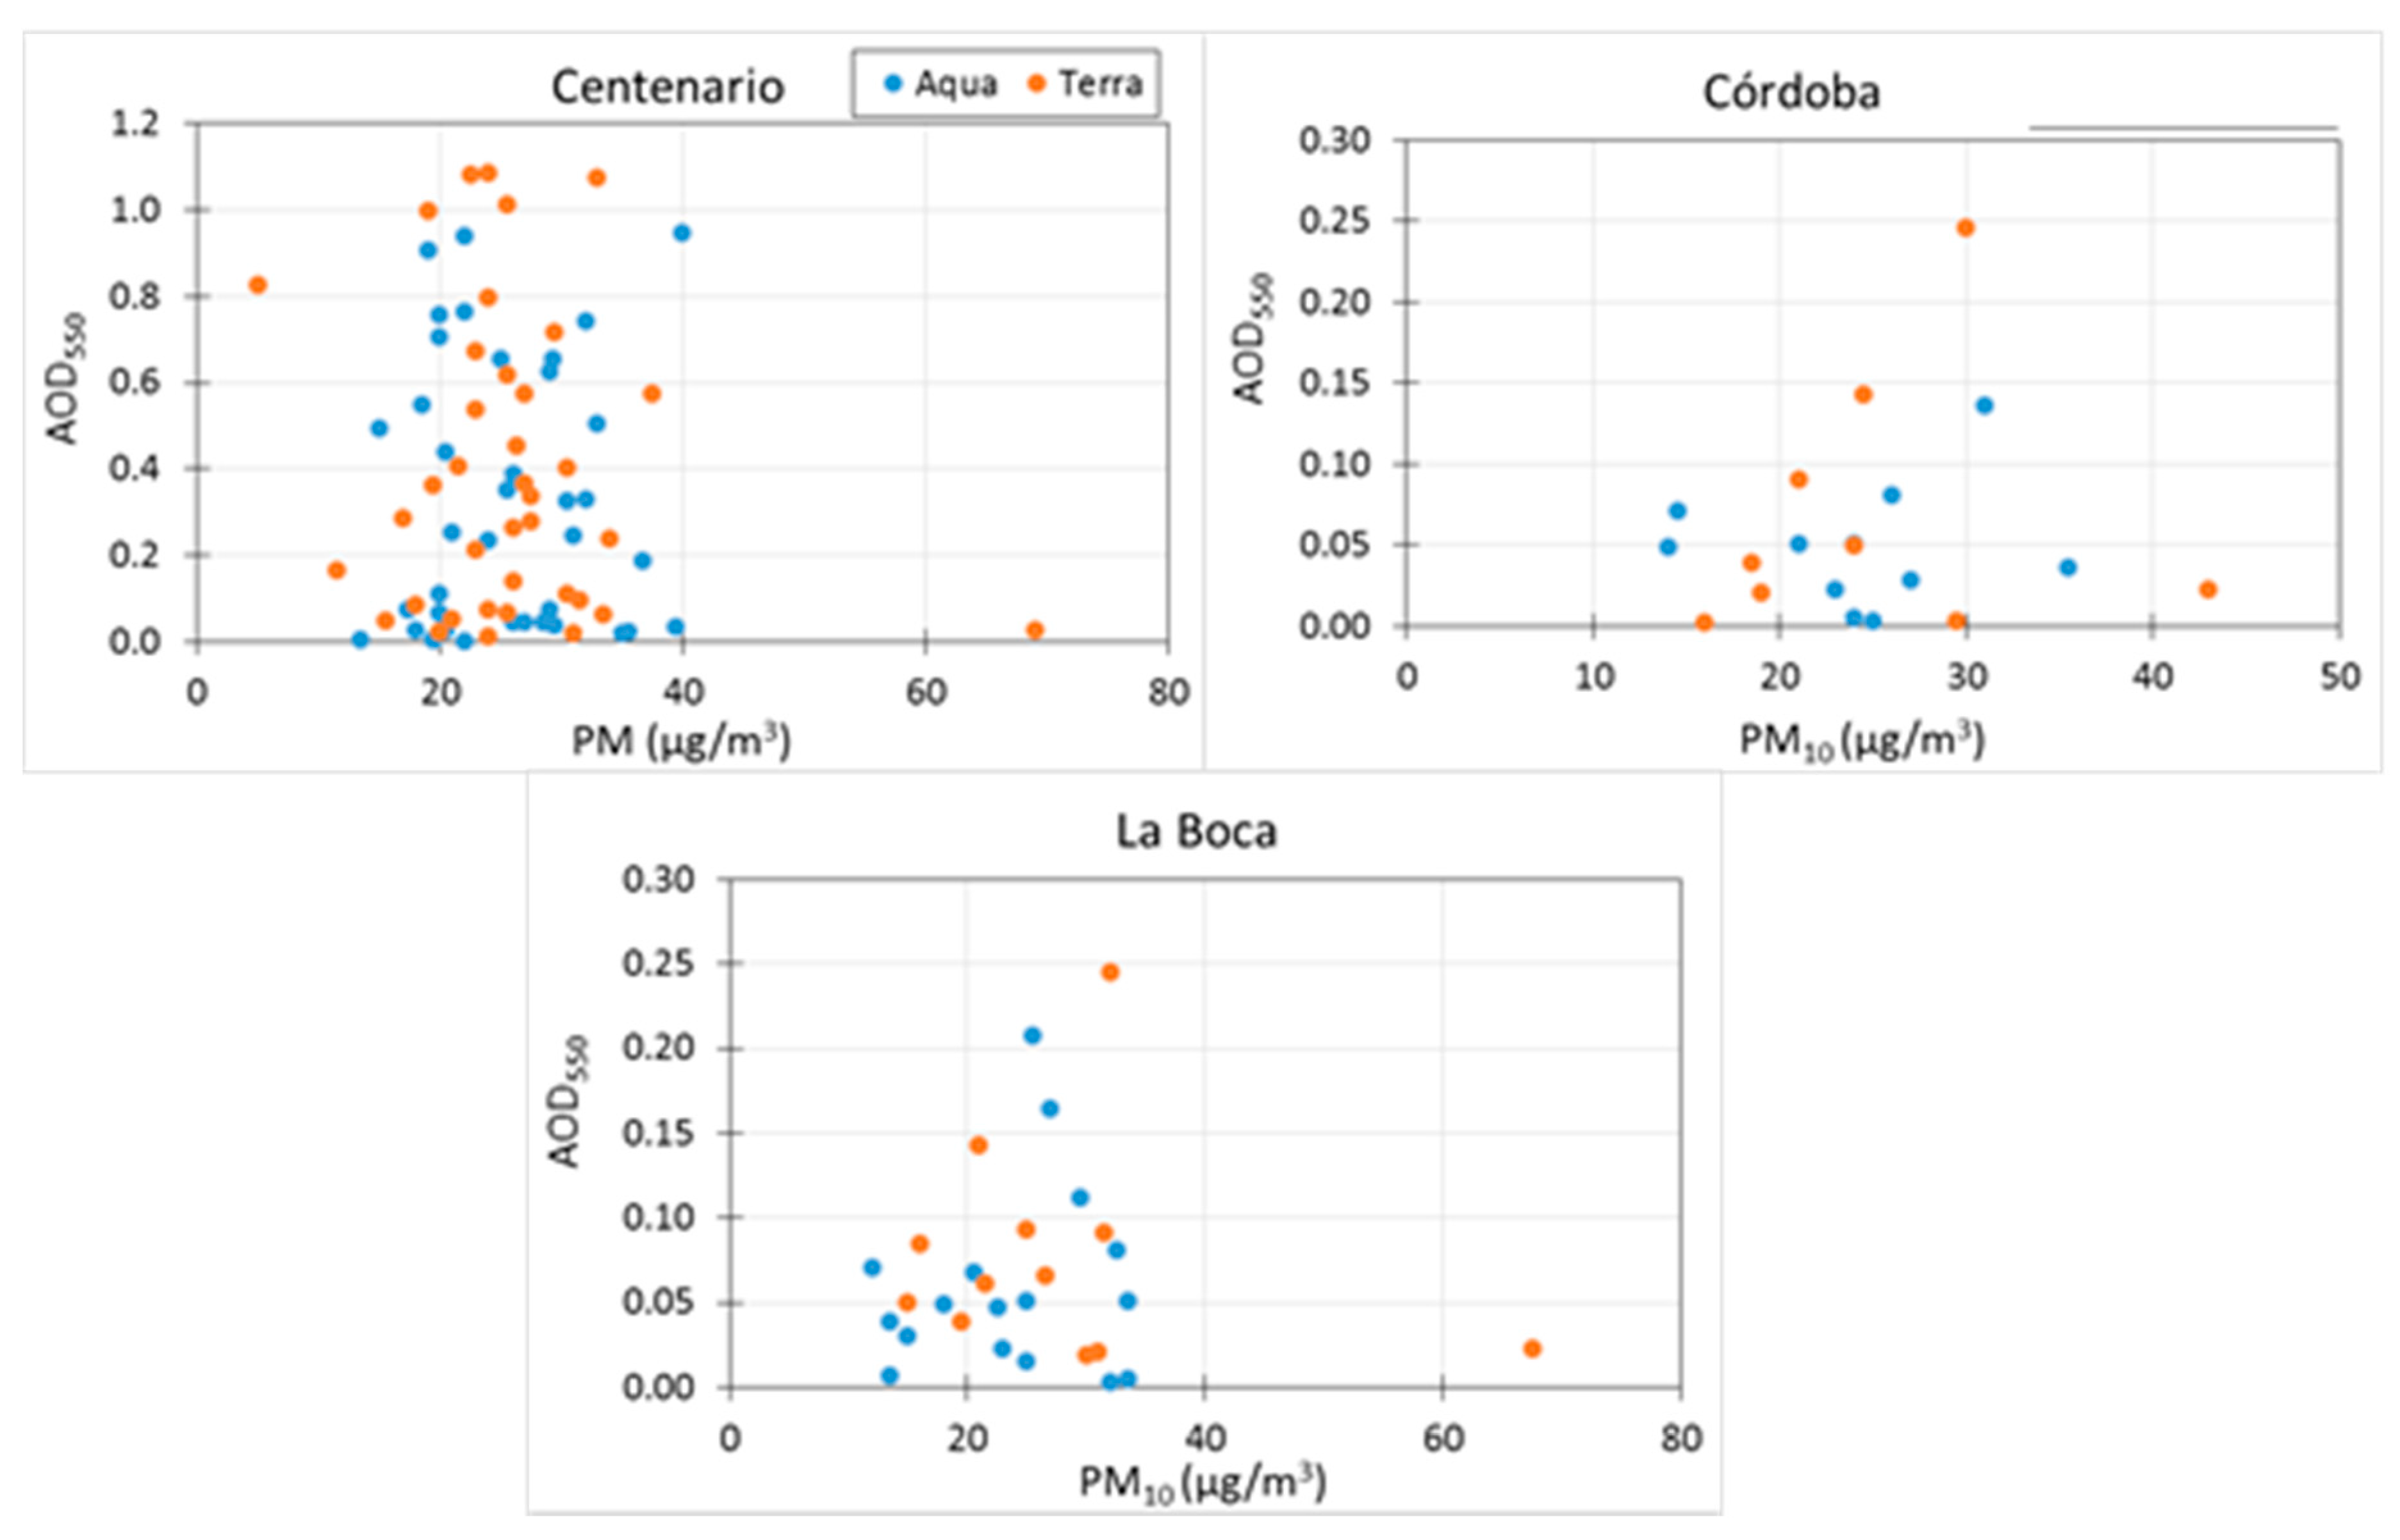
3.4. Particulate Matter and Aerosol Optical Depth Relation

As a first approach to evaluate the relationship between the ground-based PM10 measurements and the AOD values obtained from MODIS sensor we computed linear models considering PM average ±60 min satellite overpass and the AOD of the pixel corresponding to the PM station location (Figure 12).
As it can be appreciated, there is not a significant correlation between PM measurements at surface and AOD obtained from MODIS sensor. At this point, a very important fact need to be taken into account: ground-based PM measurements have a limited spatial cover range (in height and horizontal distance) while AOD measures the total particle content of the whole atmospheric column for a 3 km × 3 km area.

4. Conclusions

Considering the PM values measured by the local government at the three monitoring stations with available PM10 data in 2014 it seems that, in contrast with other South American cities such as Santiago de Chile or Bogotá [18,19], air pollution in Buenos Aires is not as important as in this large cities. However, the annual mean exceed for very little the WHO recommended PM10 limit values.
Aerosol optical depth, an adimensional indirect indicator of the total particle content in the atmospheric column obtained from satellite sensors, show the existence of areas with higher atmospheric aerosols concentration that are not being monitored, not only at Buenos Aires city but also at the surrounding urban area known as Gran Buenos Aires. Taking into account that in this great urban area inhabits 30% of the total country population, air quality and its effects on human health should be considered a mayor issue.
Although the satellite data do not seem to be accurate enough to estimate the values of surface particulate material, it allows to notice the situation of air quality in a wider area and what is happening in the areas where there is no surface air quality monitoring. Satellite data provide the possibility to identify possible areas with high concentration of atmospheric particulate material at surface which is of great help for making decisions (i.e., where to place new monitoring stations).
Air pollutant concentrations should be measured at monitoring sites that are representative of the whole population exposures. Air pollution levels may be higher in the vicinity of specific sources of air pollution, such as roads, power plants and large stationary sources (i.e., industrial areas), and the protection of populations living in such situations may require special measures.
Buenos Aires local government and the surrounding districts should make an effort to expand the monitoring network in order to make it representative of the actual exposure to particulate matter of the whole population.

Author Contributions

L.S.D.C. conceived and designed the present study that includes ground measurements and satellite data analysis; L.S.D.C., analyzed the data; R.D.P. and M.I.M. helped in the data analysis; L.S.D.C. (and partially each other authors) wrote the paper. All authors have read and agreed to the published version of the manuscript.

Acknowledgments

We acknowledge the support of CONICET through a Posdoctoral grant. We also acknowledge the Science Team of the satellite and lidar instruments used in the present work (MODIS, CEILAP_BA AERONET) for their dedication in the collection and maintenance of the corresponding databases. We would like to thank the Ministry of Environment and Public Space and the Environmental Protection Agency (APRA) of Buenos Aires city for the PM10 data.

Conflicts of Interest

The authors declare no conflict of interest. The founding sponsors had no role in the design of the study; in the collection, analyses, or interpretation of data; in the writing of the manuscript, and in the decision to publish the results.

Abbreviations

The following abbreviations are used in this manuscript:
AODAerosol optical Depth
PM10Particulate matter with aerodynamic diameter less than 10 μm
WHO World Health Organization

References

  1. World Health Organization. Ambient Air Pollution: A Global Assessment of Exposure and Burden of Disease. 2016. Available online: http://who.int/phe/publications/air-pollution-global-assessment/en/ (accessed on 6 July 2017).
  2. Pope, C.A., III; Dockery, D.W. Health effects of fine particulate air pollution: Lines that connect. J. Air Waste Manag. Assoc. 2006, 56, 709–742. [Google Scholar] [CrossRef] [PubMed]
  3. Larrieu, S.; Jusot, J.F.; Blanchard, M.; Prouvost, H.; Declercq, C.; Fabre, P.; Pascal, L.; Le Tertre, A.; Wagner, V.; Rivière, S.; et al. Short term effects of air pollution on hospitalizations for cardiovascular diseases in eight French cities: The PSAS program. Sci. Total Environ. 2007, 387, 105–112. [Google Scholar] [CrossRef] [PubMed]
  4. Jerrett, M.; Burnett, R.T.; Ma, R.; Pope, C.A.; Krewski, D.; Newbold, K.B.; Thurston, G.; Shi, Y.; Finkelstein, N.; Calle, E.E.; et al. Spatial Analysis of Air Pollution and Mortality in Los Angeles. Epidemiology 2005, 16, 727–736. Available online: http://www.scientificintegrityinstitute.org/Jerrett110105.pdf (accessed on 6 July 2017). [CrossRef] [PubMed]
  5. IARC (International Agency for Research on Cancer). Monographs on the Evaluation of Carcinogenic Risks to Humans: Outdoor Air Pollution; International Agency for Research on Cancer: Lyon, France, 2013; Available online: http://monographs.iarc.fr/ENG/Monographs/vol109/mono109.pdf (accessed on 6 July 2017).
  6. Korc, M.J.; Sáenz, R.; Monitoreo de la Calidad del Aire en América Latina. Programa de Control de Contaminación del Aire. Centro Panamericano de Ingeniería Sanitaria y Ciencias del Ambiente División de Salud y Ambiente Organización Panamericana de la Salud Oficina Sanitaria Panamericana—Oficina Regional de la Organización Mundial de la Salud Lima. 1999. Available online: http://www.bvsde.ops-oms.org/bvsci/e/fulltext/monitlac/monitlac.pdf (accessed on 6 July 2017).
  7. LEY 1356. Available online: http://www.buenosaires.gob.ar/sites/gcaba/files/documents/ley_1356.pdf (accessed on 6 July 2017).
  8. Bogo, H.; Marcelo, O.; Castro, P.; Ozafran, M.J.; Kreiner, A.; Ernesto, C.J.; Negri, R.M. Study of atmospheric particulate matter in Buenos Aires city. Atmos. Environ. 2003, 37, 1135–1147. [Google Scholar] [CrossRef]
  9. Reich, S.; Magallanes, J.; Dawidowski, L.; Gómez, D.; Groselj, N.; Zupan, J. An Analysis of Secondary Pollutants in Buenos Aires City. Environ. Monit. Assess. 2006, 119, 441–443. [Google Scholar] [CrossRef] [PubMed]
  10. Gómez, D.; Nakazawa, T.; Furuta, N.; Smichowski, P. Multielemental chemical characterisation of fine urban aerosols collected in Buenos Aires and Tokyo by plasma-based techniques. Microchem. J. 2017, 133, 346–351. [Google Scholar] [CrossRef]
  11. D’Angiola, A.; Dawidowski, L.E.; Gómez, D.R.; Osses, M. On-road traffic emissions in the metropolitan area of Buenos Aires, Argentina. Atmos. Environ. 2010, 44, 483–493. [Google Scholar] [CrossRef]
  12. Saide, P.; Zah, R.; Osses, M.; de Eicker, M.O. Spatial disaggregation of traffic emission inventories in large cities using simplified top-down methods. Atmos. Environ. 2009, 43, 4914–4923. [Google Scholar] [CrossRef]
  13. Dawidowski, L.; Gómez, D.; Matranga, M.; D’Angiola, A.; Oreggioni, G. Megacity and country emissions from combustion sources (Buenos Aires-Argentina). In Proceedings of the AGU2010 Fall Meeting, San Francisco, CA, USA, 12–17 December 2010. [Google Scholar]
  14. Kloog, I.; Koutrakis, P.; Coull, B.A.; Lee, H.J.; Schwartz, J. Assessing temporally and spatially resolved PM2.5 exposures for epidemiological studies using satellite aerosol optical depth measurements. Atmos. Environ. 2011, 45, 6267–6275. [Google Scholar] [CrossRef]
  15. Engel-Cox, J.A.; Hoff, R.M.; Rogers, R.; Dimmick, F.; Rush, A.C.; JSzykman, J.J.; Al-Saadi, J.; Chu, D.A.; Zell, E.R. Integrating lidar and satellite optical depth with ambient monitoring for 3-dimensional particulate characterization. Atmos. Environ. 2006, 40, 8056–8067. [Google Scholar] [CrossRef]
  16. Finlayson-Pitts, B.J.; Pitts, J. Chemistry of the Upper and Lower Atmosphere: Theory, Experiments, and Applications, 1st ed.; Academic Press: San Diego, CA, USA, 2000. [Google Scholar]
  17. Levy, R.C.; Mattoo, S.; Munchak, L.A.; Remer, L.A.; Sayer, A.M.; Patadia, F.; Hsu1, N.C. The Collection 6 MODIS aerosol products over land and ocean. Atmos. Meas. Tech. 2009, 6, 2989–3034. [Google Scholar] [CrossRef]
  18. Toro, R.A.; Morales, R.G.E.; Canales, M.; Gonzalez-Rojas, C.; Leiva, M.A. Inhaled and inspired particulates in Metropolitan Santiago Chile exceed air quality standards. Build. Environ. 2014, 79, 115–123. [Google Scholar] [CrossRef]
  19. Gaitán, M.; Cancino, J.; Behrentz, E. Análisis del estado de la calidad del aire en Bogotá. Rev. Ing. 2007, 26, 81–92. [Google Scholar] [CrossRef]
Figure 1. Study area, Aeroparque meteorological station and PM10 ground-based stations location.
Proceedings 01 00180 g001
Figure 2. Gran Buenos Aires districts.
Proceedings 01 00180 g002
Figure 3. Climate data for Buenos Aires Aeroparque National Meteorological Service station at Aeroparque airport (2003–2013). Source: National Meteorological Service (www.smn.gov.ar).
Proceedings 01 00180 g003
Figure 4. Wind rose (winds speed and direction average) for 2014 at the National Meteorological Service station located at Aeroparque airport (2003–2013). Source: National Meteorological Service (www.smn.gov.ar).
Proceedings 01 00180 g004
Figure 5. Comparison of the PM10 annual average in different cities of the world according to the 2016 updated WHO database. * Buenos Aires data in this chart corresponds to Centenario station database.
Proceedings 01 00180 g005
Figure 6. Monthly PM10 mean for 2014 at three different air quality stations at Buenos Aires City (Centenario, Cordoba and La Boca). Median is indicated with a line inside the box. The lower and upper hinges correspond to the first and third quartiles (the 25th and 75th percentiles). The whiskers extends from the hinge to the largest value no further than ±1.5 * IQR (the inter-quartile range, or distance between the first and third quartiles) from the hinge.
Proceedings 01 00180 g006
Figure 7. Monthly AOD (500 nm) mean at Ceilap-BA AERONET station (blue squares) and the corresponding 3 km × 3 km pixel of AOD (550 nm) from MODIS (orange diamonds) for 2014. Whiskers indicate the standard deviation.
Proceedings 01 00180 g007
Figure 8. Aerosol optical depth annual average for 2014 from MODIS sensor (Aqua & Terra datasets combined) over Buenos Aires city and Gran Buenos Aires.
Proceedings 01 00180 g008
Figure 9. Aerosol optical depth annual average for 2014 from MODIS sensor (Aqua & Terra datasets combined, 3 km × 3 km pixel spatial resolution) zoom over Buenos Aires city. Dots and numbers are indicating the PM monitoring stations (1-Centenario, 2-Córdoba and 3-La Boca) and Ceilap_BA AERONET station (4).
Proceedings 01 00180 g009
Figure 10. Aerosol optical depth seasonal average for 2014 from MODIS sensor (Aqua & Terra datasets combined) over Buenos Aires city and Gran Buenos Aires.
Proceedings 01 00180 g010
Figure 11. Wind rose (winds speed and direction average) for each month of 2014 at the National Meteorological Service station located at Aeroparque airport (2003–2013). Source: National Meteorological Service (www.smn.gov.ar).
Proceedings 01 00180 g011
Figure 12. PM average ±60 min satellite overpass vs. AOD of the pixel corresponding to each PM station location (Centenario, Córdoba and La Boca).
Proceedings 01 00180 g012
Publisher’s Note: MDPI stays neutral with regard to jurisdictional claims in published maps and institutional affiliations.

