
The Impact of Split Nitrogen Fertilizer Applications on the Productivity and Nitrogen Use Efficiency of Rice


Abstract
:1. Introduction
2. Materials and Methods
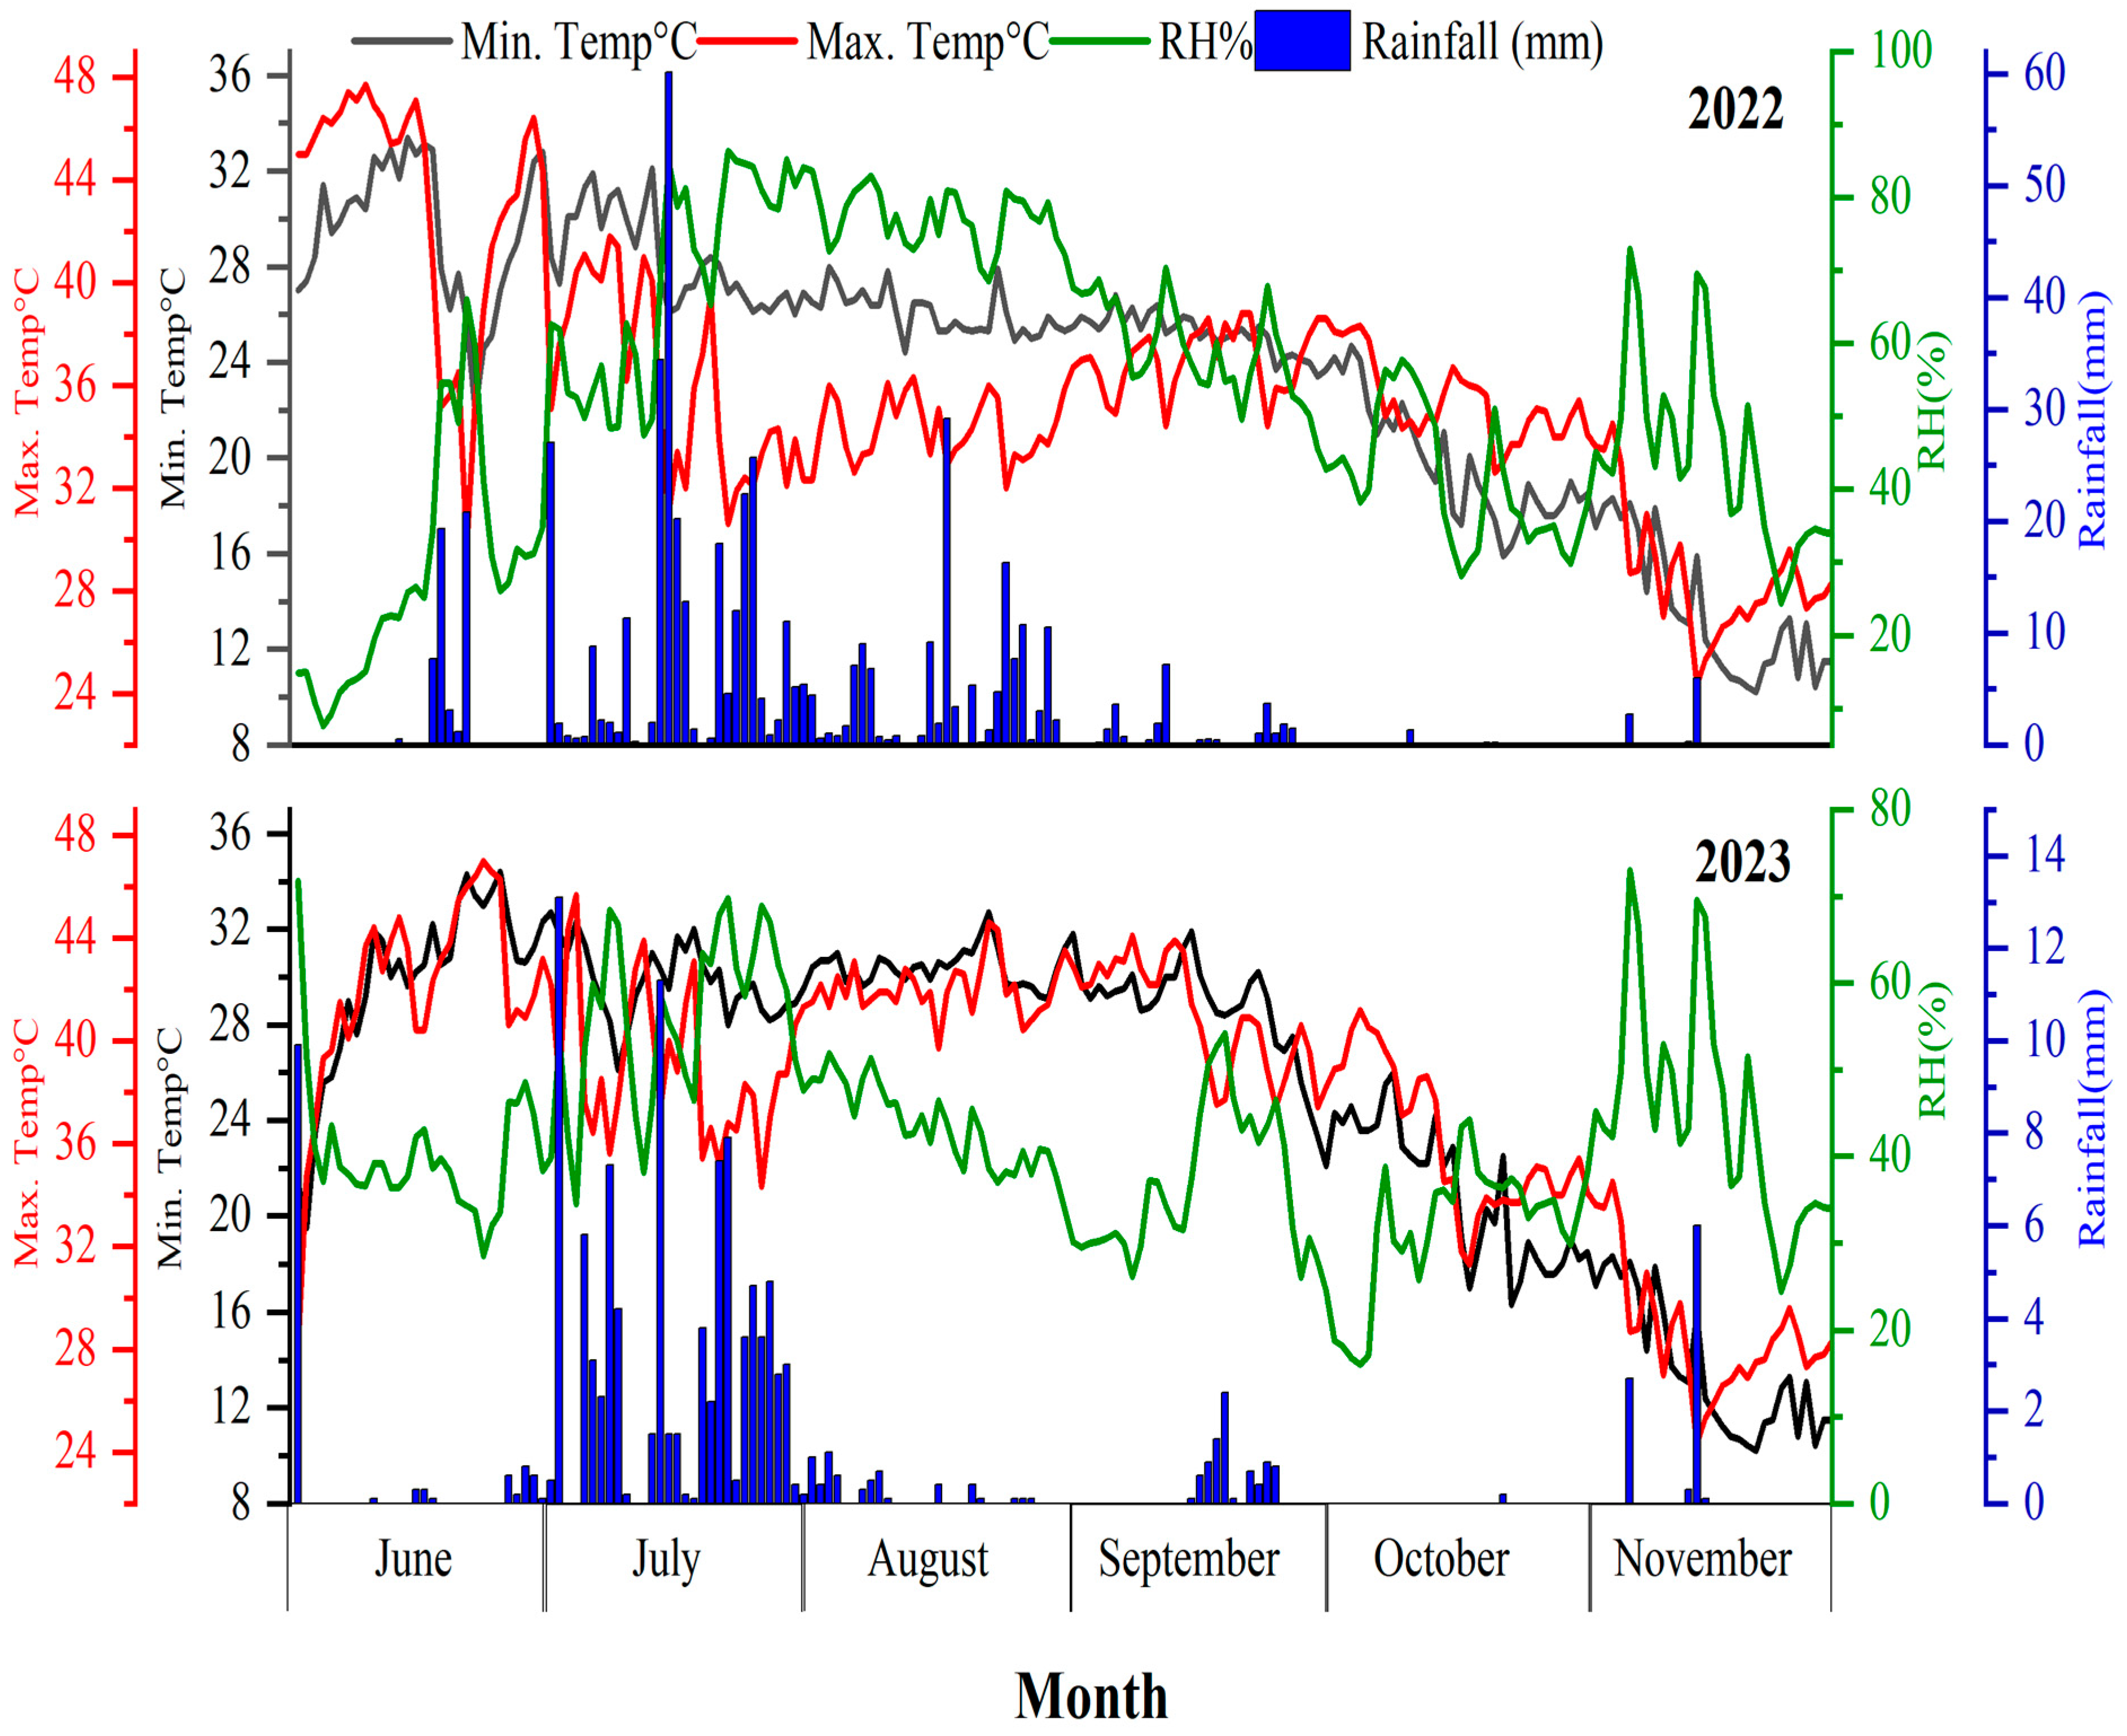
2.1. Experimental Site and Design
2.2. Crop Husbandry
2.3. Observations
2.4. Statistical Analysis
3. Results
3.1. Impact of Nitrogen Split(s) on the Growth and Yield Parameters of Various Rice Varieties (Main Effects)
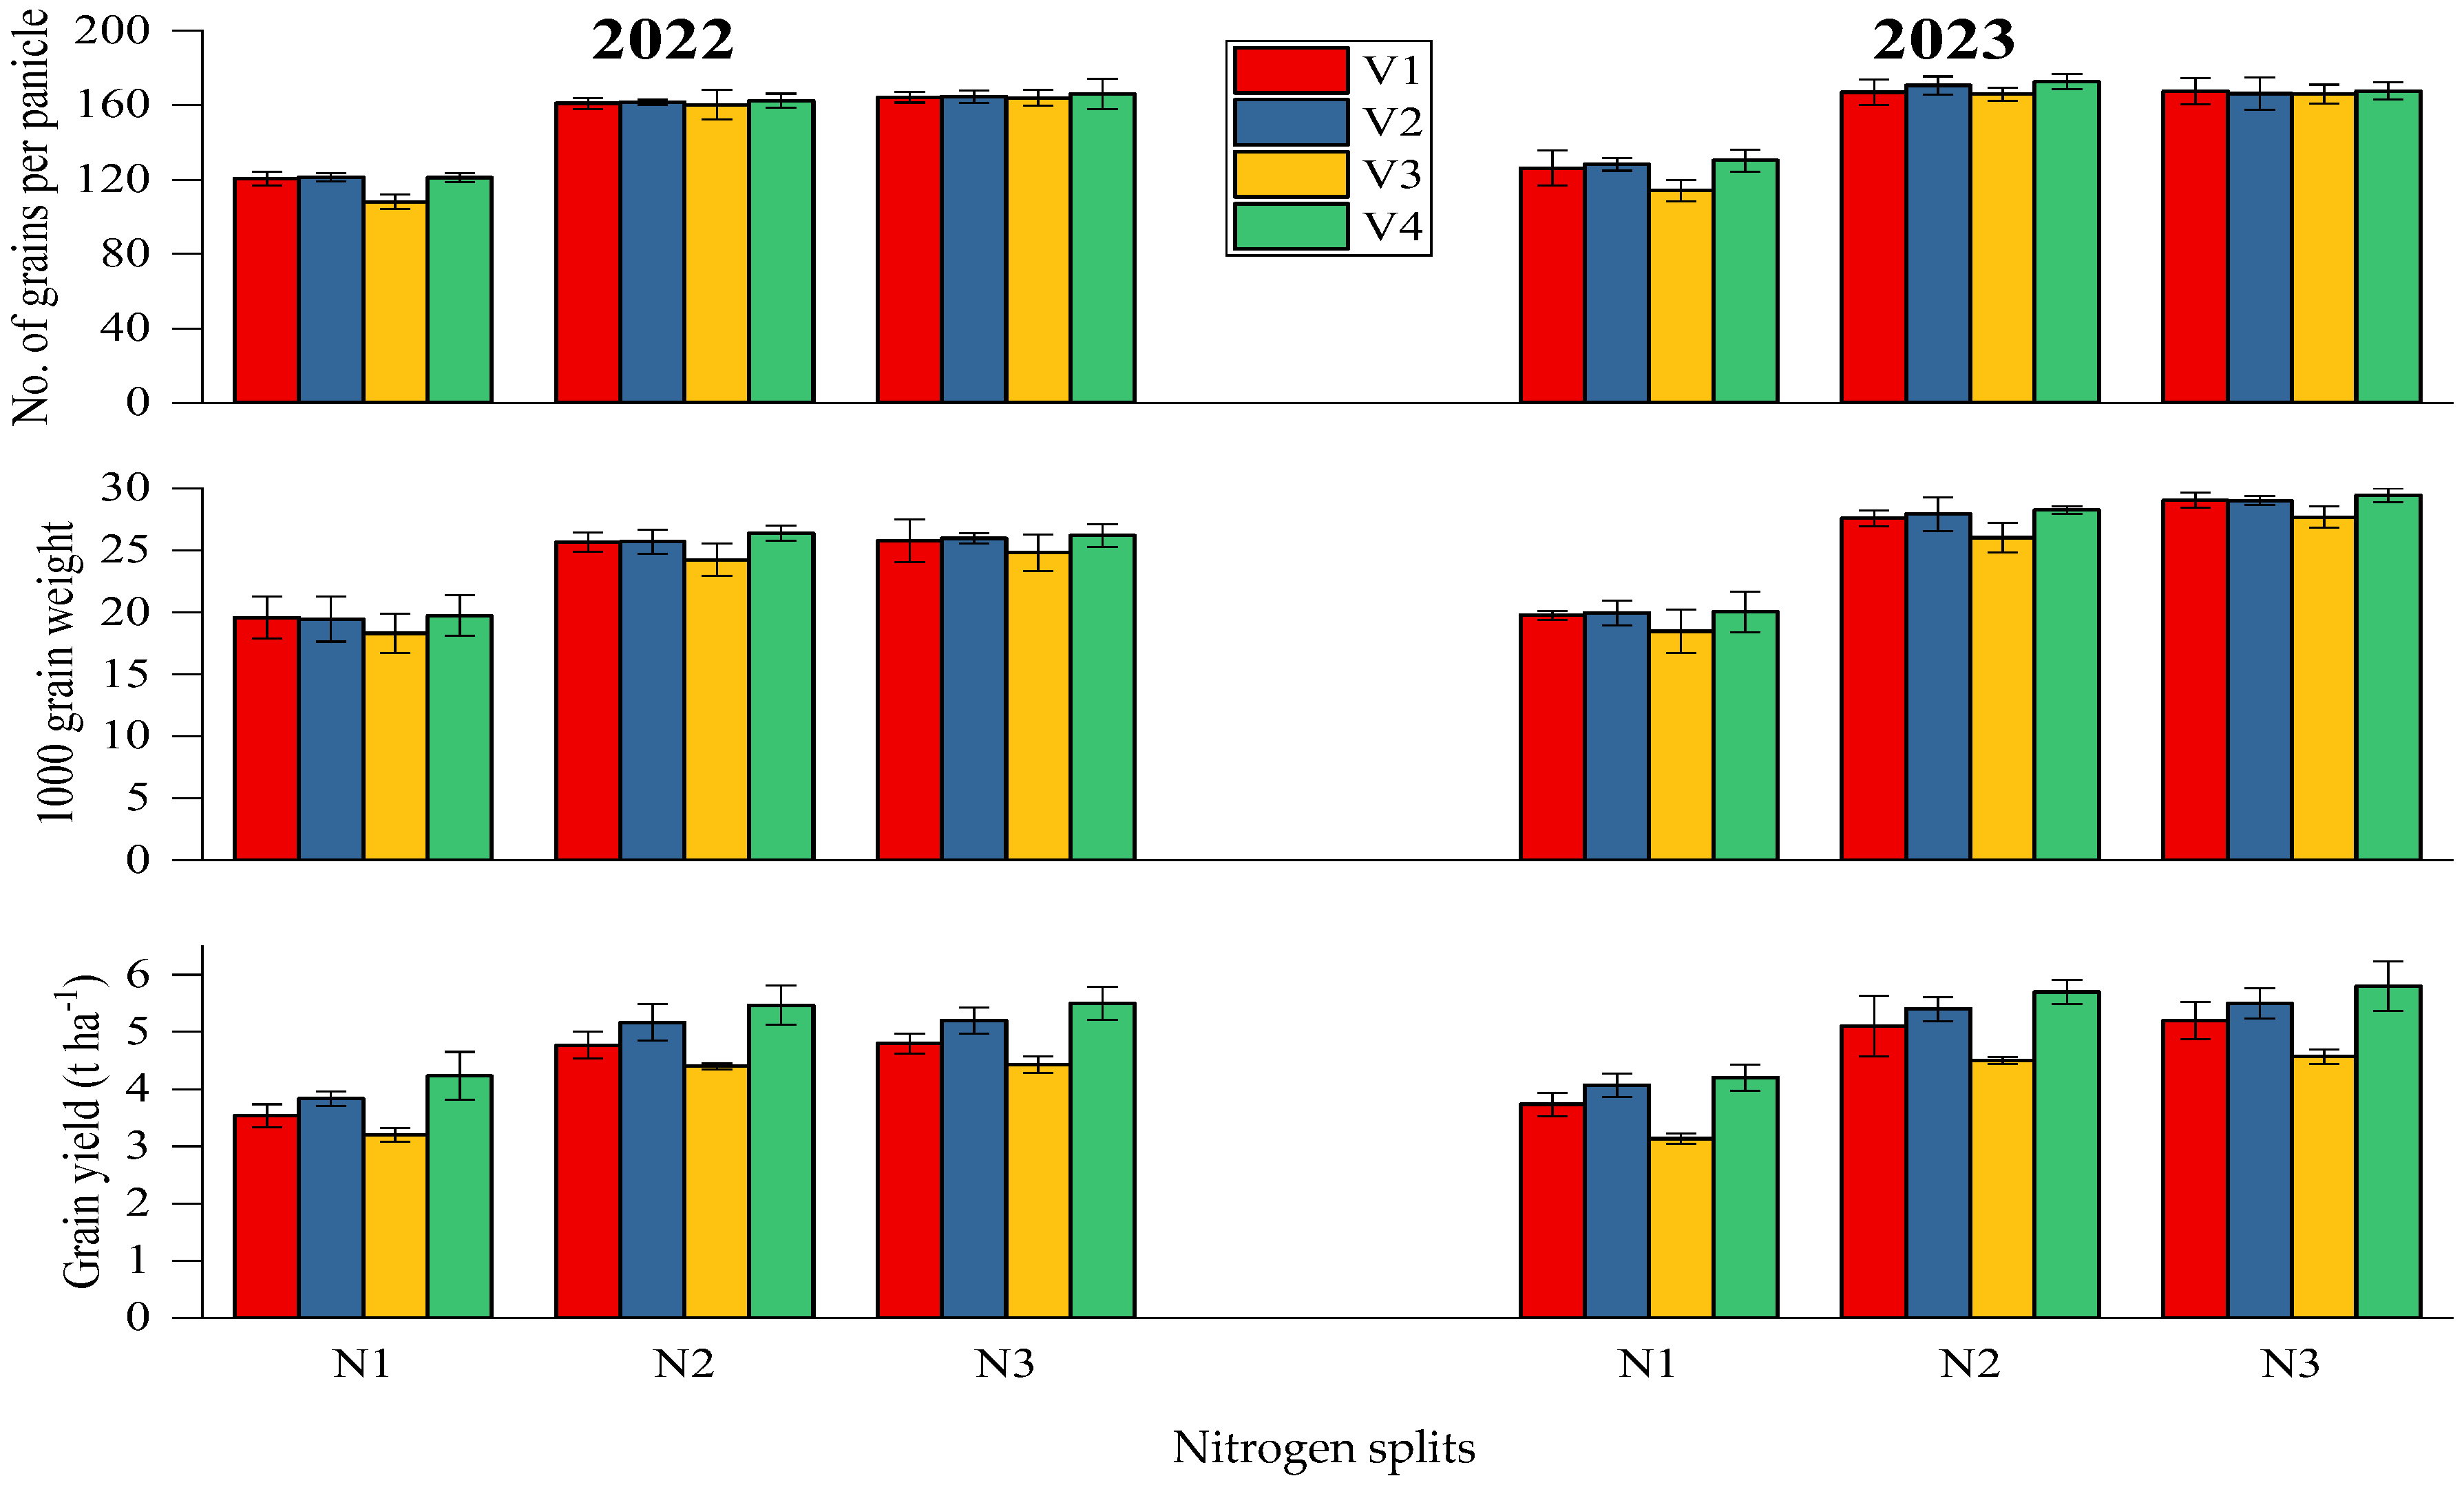
3.2. Impact of Nitrogen Split(s) on Growth and Yield Parameters of Various Rice Varieties (Interactive Effects)
3.3. Agronomic Nitrogen Use Efficiency and Partial Factor Productivity
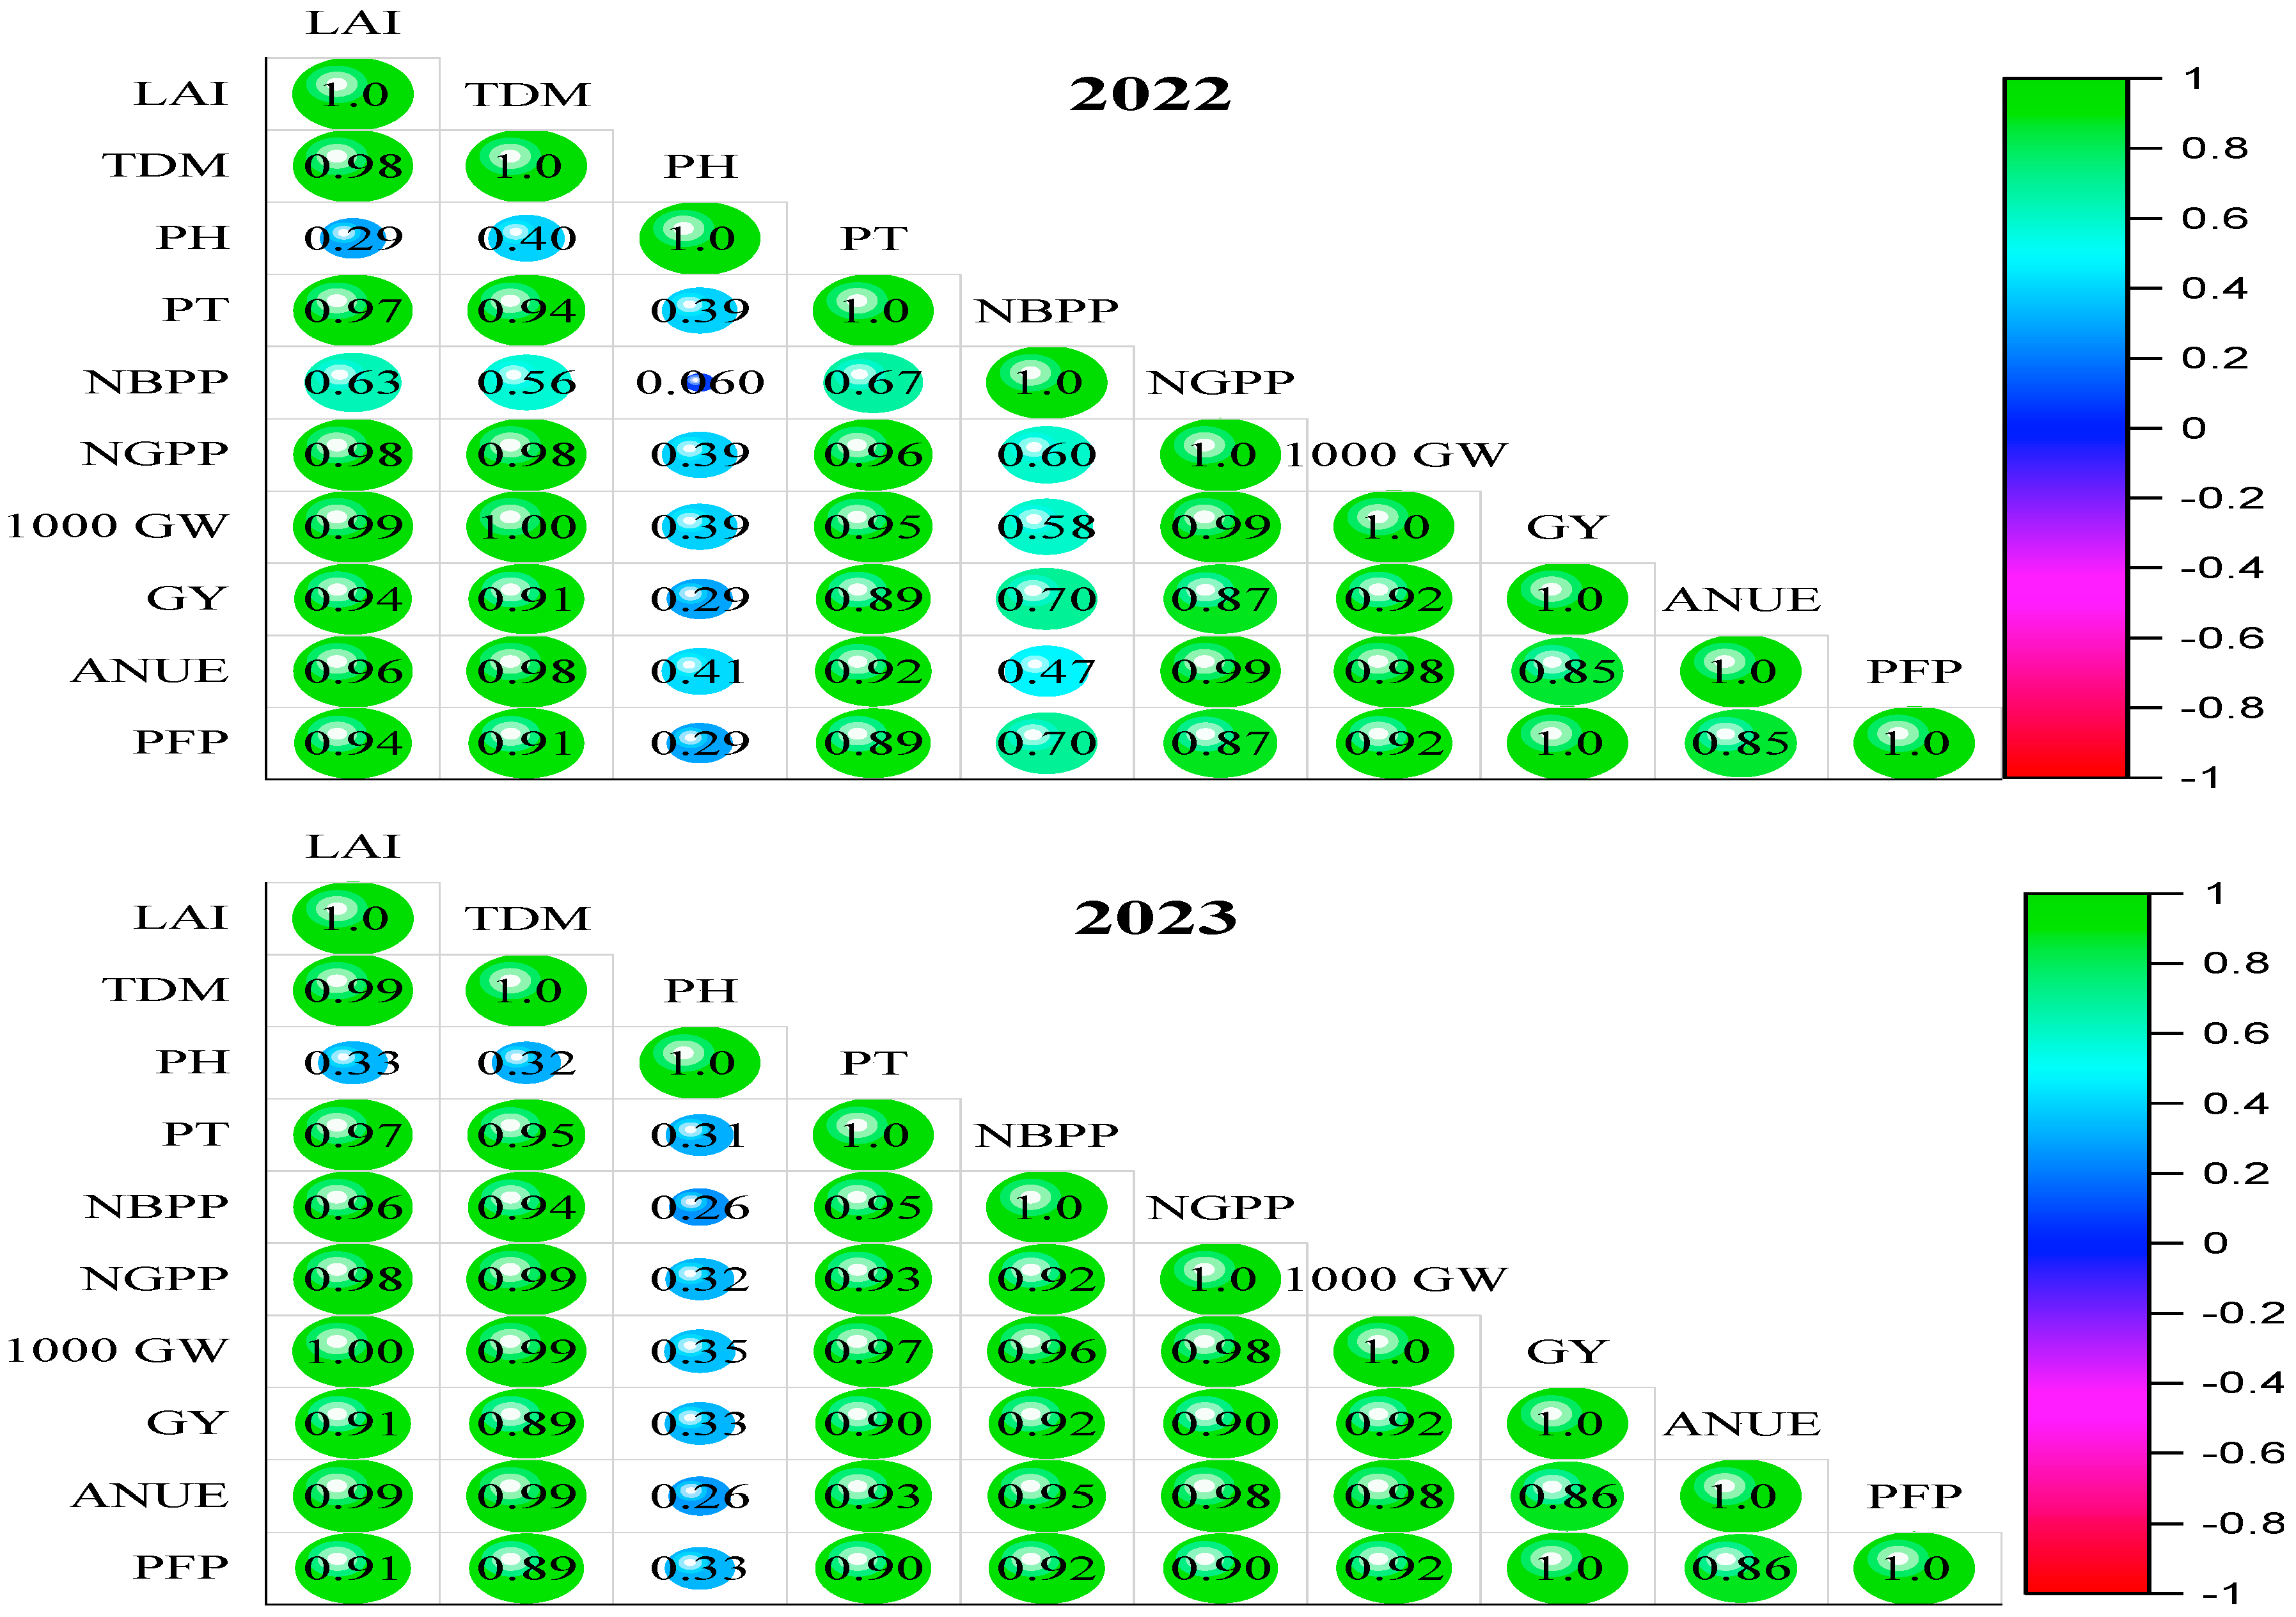
3.4. Pearson Correlation Analysis
4. Discussion
5. Conclusions
Author Contributions
Funding
Data Availability Statement
Acknowledgments
Conflicts of Interest
References
- Tesfaye, K.; Takele, R.; Sapkota, T.B.; Khatri-Chhetri, A.; Solomon, D.; Stirling, C.; Albanito, F. Model comparison and quantification of nitrous oxide emission and mitigation potential from maize and wheat fields at a global scale. Sci. Total Environ. 2021, 782, 146696. [Google Scholar] [CrossRef]
- Van-Groenigen, K.J.; Van-Kessel, C.; Hungate, B.A. Increased greenhouse-gas intensity of rice production under future atmospheric conditions. Nat. Clim. Change 2013, 3, 288–291. [Google Scholar] [CrossRef]
- Thakur, A.K.; Rath, S.; Mandal, K.G. Differential responses of system of rice intensification (SRI) and conventional flooded-rice management methods to applications of nitrogen fertilizer. Plant Soil. 2013, 370, 59–71. [Google Scholar] [CrossRef]
- Ghorbani, M.; Amirahmadi, E. Biochar and soil contributions to crop lodging and yield performance-A meta-analysis. Plant Physiol. Biochem. 2024, 215, 109053. [Google Scholar] [CrossRef]
- Nazeer, S.; Sajjad, M.; Ahmad, T.; Idrees, M.; Ali, A.; Khurshid, M.A.; Yasir, M.; Amjad, M.; Shahid, H.; Ijaz, B.; et al. Effect of micronutrients (zinc, iron and boron) application on the yield and quality of late sown wheat. Plant Health 2024, 3, 41–47. [Google Scholar]
- Gowele, G.E.; Mahoo, H.F.; Kahimba, F.C. Comparison of silicon status in rice grown under the system of rice intensification and flooding regime in Mkindo irrigation scheme, Morogoro, Tanzania. Tanzan. J. Agric. Sci. 2020, 19, 216–226. [Google Scholar]
- Baral, B.R.; Pande, K.R.; Gaihre, Y.K.; Baral, K.R.; Sah, S.K.; Thapa, Y.B.; Singh, U. Increasing nitrogen use efficiency in rice through fertilizer application method under rainfed drought conditions in Nepal. Nutr. Cycl. Agroecosyst. 2020, 118, 103–114. [Google Scholar] [CrossRef]
- Zhao, C.; Chen, M.; Li, X.; Dai, Q.; Xu, K.; Guo, B.; Hu, Y.; Wang, W.; Huo, Z. Effects of soil types and irrigation modes on rice root morphophysiological traits and grain quality. Agronomy 2021, 11, 120. [Google Scholar] [CrossRef]
- Kim, G.W.; Kim, P.J.; Khan, M.I.; Lee, S.J. Effect of rice planting on nitrous oxide (N2O) emission under different levels of nitrogen fertilization. Agronomy 2021, 11, 217. [Google Scholar] [CrossRef]
- Bagheri, N.S.; Motesharezadeh, B.; Asgari, L.B. Techniques for improving nitrogen use efficiency in rice. In Soil Nitrogen Ecology; Springer International Publishing: Cham, Switzerland, 2021; pp. 203–213. [Google Scholar]
- Congreves, K.A.; Otchere, O.; Ferland, D.; Farzadfar, S.; Williams, S.; Arcand, M.M. Nitrogen use efficiency definitions of today and tomorrow. Front. Plant Sci. 2021, 12, 637108. [Google Scholar] [CrossRef] [PubMed]
- Bhatt, H.; Ghimire, S.; Paudel, S.; Bashyal, M. Response of spring rice (Oryza sativa L.) varieties to different nitrogen application methods at Nawalparasi West, Nepal. Tr. J. Agric. Food Sci. Technol. 2024, 12, 631–643. [Google Scholar] [CrossRef]
- Kamruzzaman, M.D.; Kayum, M.A.; Hasan, M.M.; Hasan, M.M.; Da Silva, J.A.T. Effect of split application of nitrogen fertilizer on yield and yield attributes of transplanted aman rice (Oryza sativa L.). Bangladesh J. Agric. Res. 2013, 38, 579–587. [Google Scholar] [CrossRef]
- NurulNahar, E.; Shajarutulwardah, M.Y.; Hartinee, A. Increasing rice grain yield by split application of nitrogen rates. J. Trop. Agric. Food Sci. 2023, 51, 21–28. [Google Scholar]
- Zohaib, A.; Hussain, M.; Ahmad, I.; Ali, M.; Tabassum, T.; Bashir, A. Evaluation of fine basmati rice varieties for morphology, yield and economic benefits in Gujranwala cropping zone. Pak. J. Agric. Res. 2022, 35, 165–171. [Google Scholar] [CrossRef]
- Li, G.H.; Zhang, Y.; Zhou, C.; Xu, J.W.; Zhu, C.J.; Ni, C.; Huo, Z.Y.; Dai, Q.G.; Xu, K. Agronomic and physiological characteristics of high yield and nitrogen use efficient varieties of rice: Comparison between two near-isogenic lines. Food Energy Secur. 2024, 13, e539. [Google Scholar] [CrossRef]
- Chen, J.; Qin, G.; Wang, J.; Yu, J.; Shen, B.; Li, S.; Ren, Y.; Zuo, L.; Shen, W.; Das, B. One-step fabrication of sub-10-nm plasmonic nanogaps for reliable SERS sensing of microorganisms. Biosens. Bioelectron. 2013, 44, 191–197. [Google Scholar] [CrossRef] [PubMed]
- Win, E.P.; Win, K.K.; Bellingrath-Kimura, S.D.; Oo, A.Z. Influence of rice varieties, organic manure and water management on greenhouse gas emissions from paddy rice soils. PLoS ONE 2021, 16, e0253755. [Google Scholar] [CrossRef]
- Islam, S.M.; Gaihre, Y.K.; Biswas, J.C.; Jahan, M.S.; Singh, U.; Adhikary, S.K.; Satter, M.A.; Saleque, M.A. Different nitrogen rates and methods of application for dry season rice cultivation with alternate wetting and drying irrigation: Fate of nitrogen and grain yield. Agric. Water Manag. 2018, 196, 144–153. [Google Scholar] [CrossRef]
- Fageria, N.K. The Use of Nutrients in Crop Plants; CRC Press: Boca Raton, FL, USA, 2009. [Google Scholar]
- Dua, V.K.; Govindakrishnan, P.M.; Lal, S.S.; Khurana, S.P. Partial factor productivity of nitrogen in potato. Better Crops 2007, 91, 26–27. [Google Scholar]
- Lawlor, D.W. Carbon and nitrogen assimilation in relation to yield: Mechanisms are the key to understanding production systems. J. Exp. Bot. 2002, 53, 773–787. [Google Scholar] [CrossRef] [PubMed]
- Bloom, A.J.; Frensch, J.; Taylor, A.R. Influence of inorganic nitrogen and pH on the elongation of maize seminal roots. Ann. Bot. 2006, 97, 867–873. [Google Scholar] [CrossRef]
- Pathan, S.H.; Bhilare, R.L.; Damame, S.V. Seed yield of forage pearl millet varieties as influenced by nitrogen levels under rainfed condition. J. Maharashtra Agric. Univ. 2010, 35, 306–308. [Google Scholar]
- Singh, R.; Agarwal, S.K. Analysis of growth and productivity of wheat (Triticum aestivum L.) in relation to levels of FYM and nitrogen. Indian J. Plant Physiol. 2001, 6, 279–283. [Google Scholar]
- Fageria, N.K. Yield physiology of rice. J. Plant Nutr. 2007, 30, 843–879. [Google Scholar] [CrossRef]
- Azarpour, E.; Moraditochaee, M.; Bozorgi, H.R. Effect of nitrogen fertilizer management on growth analysis of rice cultivars. Int. J. Biosci. 2014, 5, 35–47. [Google Scholar]
- Wu, K.; Wang, S.; Song, W.; Zhang, J.; Wang, Y.; Liu, Q.; Yu, J.; Ye, Y.; Li, S.; Chen, J.; et al. Enhanced sustainable green revolution yield via nitrogen-responsive chromatin modulation in rice. Science 2020, 367, eaaz2046. [Google Scholar] [CrossRef] [PubMed]
- Abbasi, M.K.; Tahir, M.M.; Sadiq, A.; Iqbal, M.; Zafar, M. Yield and nitrogen use efficiency of rainfed maize response to splitting and nitrogen rates in Kashmir, Pakistan. Agron. J. 2012, 104, 448–457. [Google Scholar] [CrossRef]
- Zhang, J.; Tong, T.; Potcho, P.M.; Huang, S.; Ma, L.; Tang, X. Nitrogen effects on yield, quality and physiological characteristics of giant rice. Agronomy 2020, 10, 1816. [Google Scholar] [CrossRef]
- Wang, J.; Lu, K.; Nie, H.; Zeng, Q.; Wu, B.; Qian, J.; Fang, Z. Rice nitrate transporter OsNPF7.2 positively regulates tiller number and grain yield. Rice 2018, 11, 12. [Google Scholar] [CrossRef]
- Chen, Z.; Wang, Q.; Ma, J.; Zou, P.; Jiang, L. Impact of controlled-release urea on rice yield, nitrogen use efficiency and soil fertility in a single rice cropping system. Sci. Rep. 2020, 10, 10432. [Google Scholar] [CrossRef] [PubMed]
- Jahan, A.; Islam, A.; Sarkar, M.I.U.; Iqbal, M.; Ahmed, M.N.; Islam, M.R. Nitrogen response of two high yielding rice varieties as influenced by nitrogen levels and growing seasons. Geol. Ecol. Landsc. 2022, 6, 24–31. [Google Scholar] [CrossRef]
- Rahman, M.H.; Khatun, M.M.; Mamun, M.A.A.; Islam, M.Z.; Islam, M.R. Effect of number of seedling hill−1 and nitrogen level on growth and yield of BRRI dhan32. J. Soil. Nat. 2007, 1, 1–7. [Google Scholar]
- Ahmed, M.; Islam, M.M.; Paul, S.K.; Khulna, B. Effect of nitrogen on yield and other plant characters of local T. aman rice, var. jatai. Res. J. Agric. Biol. Sci. 2005, 1, 158–161. [Google Scholar]
- Huang, M.; Zou, Y.B.; Jiang, P.; Bing, X.I.A.; Md, I.; Ao, H.J. Relationship between grain yield and yield components in super hybrid rice. Agr. Sci. China 2011, 10, 1537–1544. [Google Scholar] [CrossRef]
- Siavoshi, M.; Nasiri, A.; Laware, S.L. Effect of organic fertilizer on growth and yield components in rice (Oryza sativa L.). J. Agric. Sci. 2011, 3, 217. [Google Scholar] [CrossRef]
- Pan, Y.P.; Wang, Y.S.; Tang, G.Q.; Wu, D. Wet and dry deposition of atmospheric nitrogen at ten sites in Northern China. Atmos. Chem. Phys. 2012, 12, 6515–6535. [Google Scholar] [CrossRef]
- Liang, K.; Zhong, X.; Huang, N.; Lampayan, R.M.; Liu, Y.; Pan, J.; Peng, B.; Hu, X.; Fu, Y. Nitrogen losses and greenhouse gas emissions under different N and water management in a subtropical double-season rice cropping system. Sci. Total Environ. 2017, 609, 46–57. [Google Scholar] [CrossRef] [PubMed]
- Ogoshi, C.; Carlos, F.S.; Waldow, D.; Miranda, F.F.; Reginato, J.L.; Ulguim, A. Influence of blast on the nutrition and yield of irrigated rice in Southern Brazil. J. Soil Sci. Plant Nutr. 2020, 20, 1378–1386. [Google Scholar] [CrossRef]
- Ghoneim, A.M.; EE, G.; Osman, M.M. Effects of nitrogen levels on growth, yield and nitrogen use efficiency of some newly released Egyptian rice genotypes. Open Agric. 2018, 3, 310–318. [Google Scholar] [CrossRef]
- Tadesse, T.; Tadesse, Z.; Asega, H.; Tafere, C. Optimum nitrogen and phosphors fertilizer rates for upland rice production in North Western Ethiopia. J. Agric. Environ. Sci. 2020, 5, 1. [Google Scholar]
- Li, D.Q.; Tang, Q.Y.; Zhang, Y.B.; Qin, J.Q.; Hu, L.I.; Chen, L.J.; Yang, S.H.; Zou, Y.B.; Peng, S.B. Effect of nitrogen regimes on grain yield, nitrogen utilization, radiation use efficiency, and sheath blight disease intensity in super hybrid rice. J. Integr. Agric. 2012, 11, 134–143. [Google Scholar] [CrossRef]
- Mae, T.; Inaba, A.; Kaneta, Y.; Masaki, S.; Sasaki, M.; Aizawa, M.; Okawa, S.; Hasegawa, S.; Makino, A. A large-grain rice cultivar, Akita 63, exhibits high yields with high physiological N-use efficiency. Field Crops Res. 2006, 97, 227–237. [Google Scholar] [CrossRef]
- Ullah, H.; Santiago-Arenas, R.; Ferdous, Z.; Attia, A.; Datta, A. Improving water use efficiency, nitrogen use efficiency, and radiation use efficiency in field crops under drought stress: A review. Adv. Agron. 2019, 156, 109–157. [Google Scholar]
- Yousaf, M.; Li, X.; Zhang, Z.; Ren, T.; Cong, R.; Ata-Ul-Karim, S.T.; Fahad, S.; Shah, A.N.; Lu, J. Nitrogen fertilizer management for enhancing crop productivity and nitrogen use efficiency in a rice-oilseed rape rotation system in China. Front. Plant Sci. 2016, 7, 1496. [Google Scholar] [CrossRef] [PubMed]
- Hameed, F.; Xu, J.; Rahim, S.F.; Wei, Q.; Liao, Q.; Ahmed, S. Rice growth and nitrogen uptake simulation by using ORYZA (v3) model considering variability in parameters. Pak. J. Agric. Sci. 2019, 56, 245–259. [Google Scholar]
- Ishfaq, M.; Akbar, N.; Zulfiqar, U.; Ali, N.; Ahmad, M.; Anjum, S.A.; Farooq, M. Influence of water management techniques on milling recovery, grain quality and mercury uptake in different rice production systems. Agric. Water Manag. 2021, 243, 106500. [Google Scholar] [CrossRef]
- Yao, Y.; Zhang, M.; Tian, Y.; Zhao, M.; Zhang, B.; Zhao, M.; Zeng, K.; Yin, B. Urea deep placement for minimizing NH3 loss in an intensive rice cropping system. Field Crops Res. 2018, 218, 254–266. [Google Scholar] [CrossRef]
- Hussain, T.; Anothai, J.; Nualsri, C.; Soonsuwon, W. Application of CSM-CERES-Rice in scheduling irrigation and simulating effect of drought stress on upland rice yield. Indian J. Agric. Res. 2018, 52, 140–145. [Google Scholar] [CrossRef]
- Yi, J.; Gao, J.; Zhang, W.; Zhao, C.; Wang, Y.; Zhen, X. Differential uptake and utilization of two forms of nitrogen in japonica rice cultivars from north-eastern China. Front. Plant Sci. 2019, 10, 1061. [Google Scholar] [CrossRef]
- Islam, S.M.; Gaihre, Y.K.; Islam, M.R.; Akter, M.; Al-Mahmud, A.; Singh, U.; Sander, B.O. Effects of water management on greenhouse gas emissions from farmers’ rice fields in Bangladesh. Sci. Total Environ. 2020, 734, 139382. [Google Scholar] [CrossRef]


| Characteristics | 2022 | 2023 | Unit | Status |
|---|---|---|---|---|
| (0–15 cm) | (15–30 cm) | |||
| Chemical analysis | ||||
| pH | 7.75 | 7.65 | – | Medium alkaline |
| EC | 1.30 | 1.68 | dS m−1 | Non-saline |
| Exchangeable sodium (Na) | 0.41 | 0.39 | mmol 100 g−1 | Normal |
| Total nitrogen (N) | 0.05 | 0.04 | % | Low |
| Available phosphorus (P) | 15.40 | 11.55 | mg kg−1 | Low |
| Exchangeable potassium (K) | 187.50 | 149.00 | mg kg−1 | Medium |
| Organic matter | 0.92 | 0.68 | % | Low |
| Boron | 0.83 | 0.66 | mg kg–1 | Deficient |
| Zinc | 2.16 | 1.38 | mg kg–1 | Deficient |
| Ferrous | 8.41 | 5.03 | mg kg–1 | Adequate |
| Bulk density | 1.48 | 1.53 | g m–3 | Low |
| Texture | Sandy Clay Loam | |||
| Management Practices | Year | |
|---|---|---|
| 2022 | 2023 | |
| Previous crop stubble management | 9 May | 12 May |
| Soaking (Rauni) irrigation | 4 July | 5 July |
| Land preparation | 5 July | 7 July |
| Nursery sowing for transplanted rice | 7 June | 10 June |
| Seed rate | 12 kg ha−1 | 12 kg ha−1 |
| Transplanting | 7 July | 10 July |
| Fertilizers application | P:K and Zn @ 90: 62.5 and 12 kg ha−1 | P:K and Zn @ 90: 62.5 and 12 kg ha−1 |
| Weed management | Oxadiargyl 80% WP (100 g ha−1) Ethoxy sulfuron 60 WG (50 g ha−1) | Oxadiargyl 80% WP (100 g ha−1) Ethoxy sulfuron 60 WG (50 g ha−1) |
| Harvesting | 8 November | 14 November |
| Treatments | Parameters | |||||||||||||
|---|---|---|---|---|---|---|---|---|---|---|---|---|---|---|
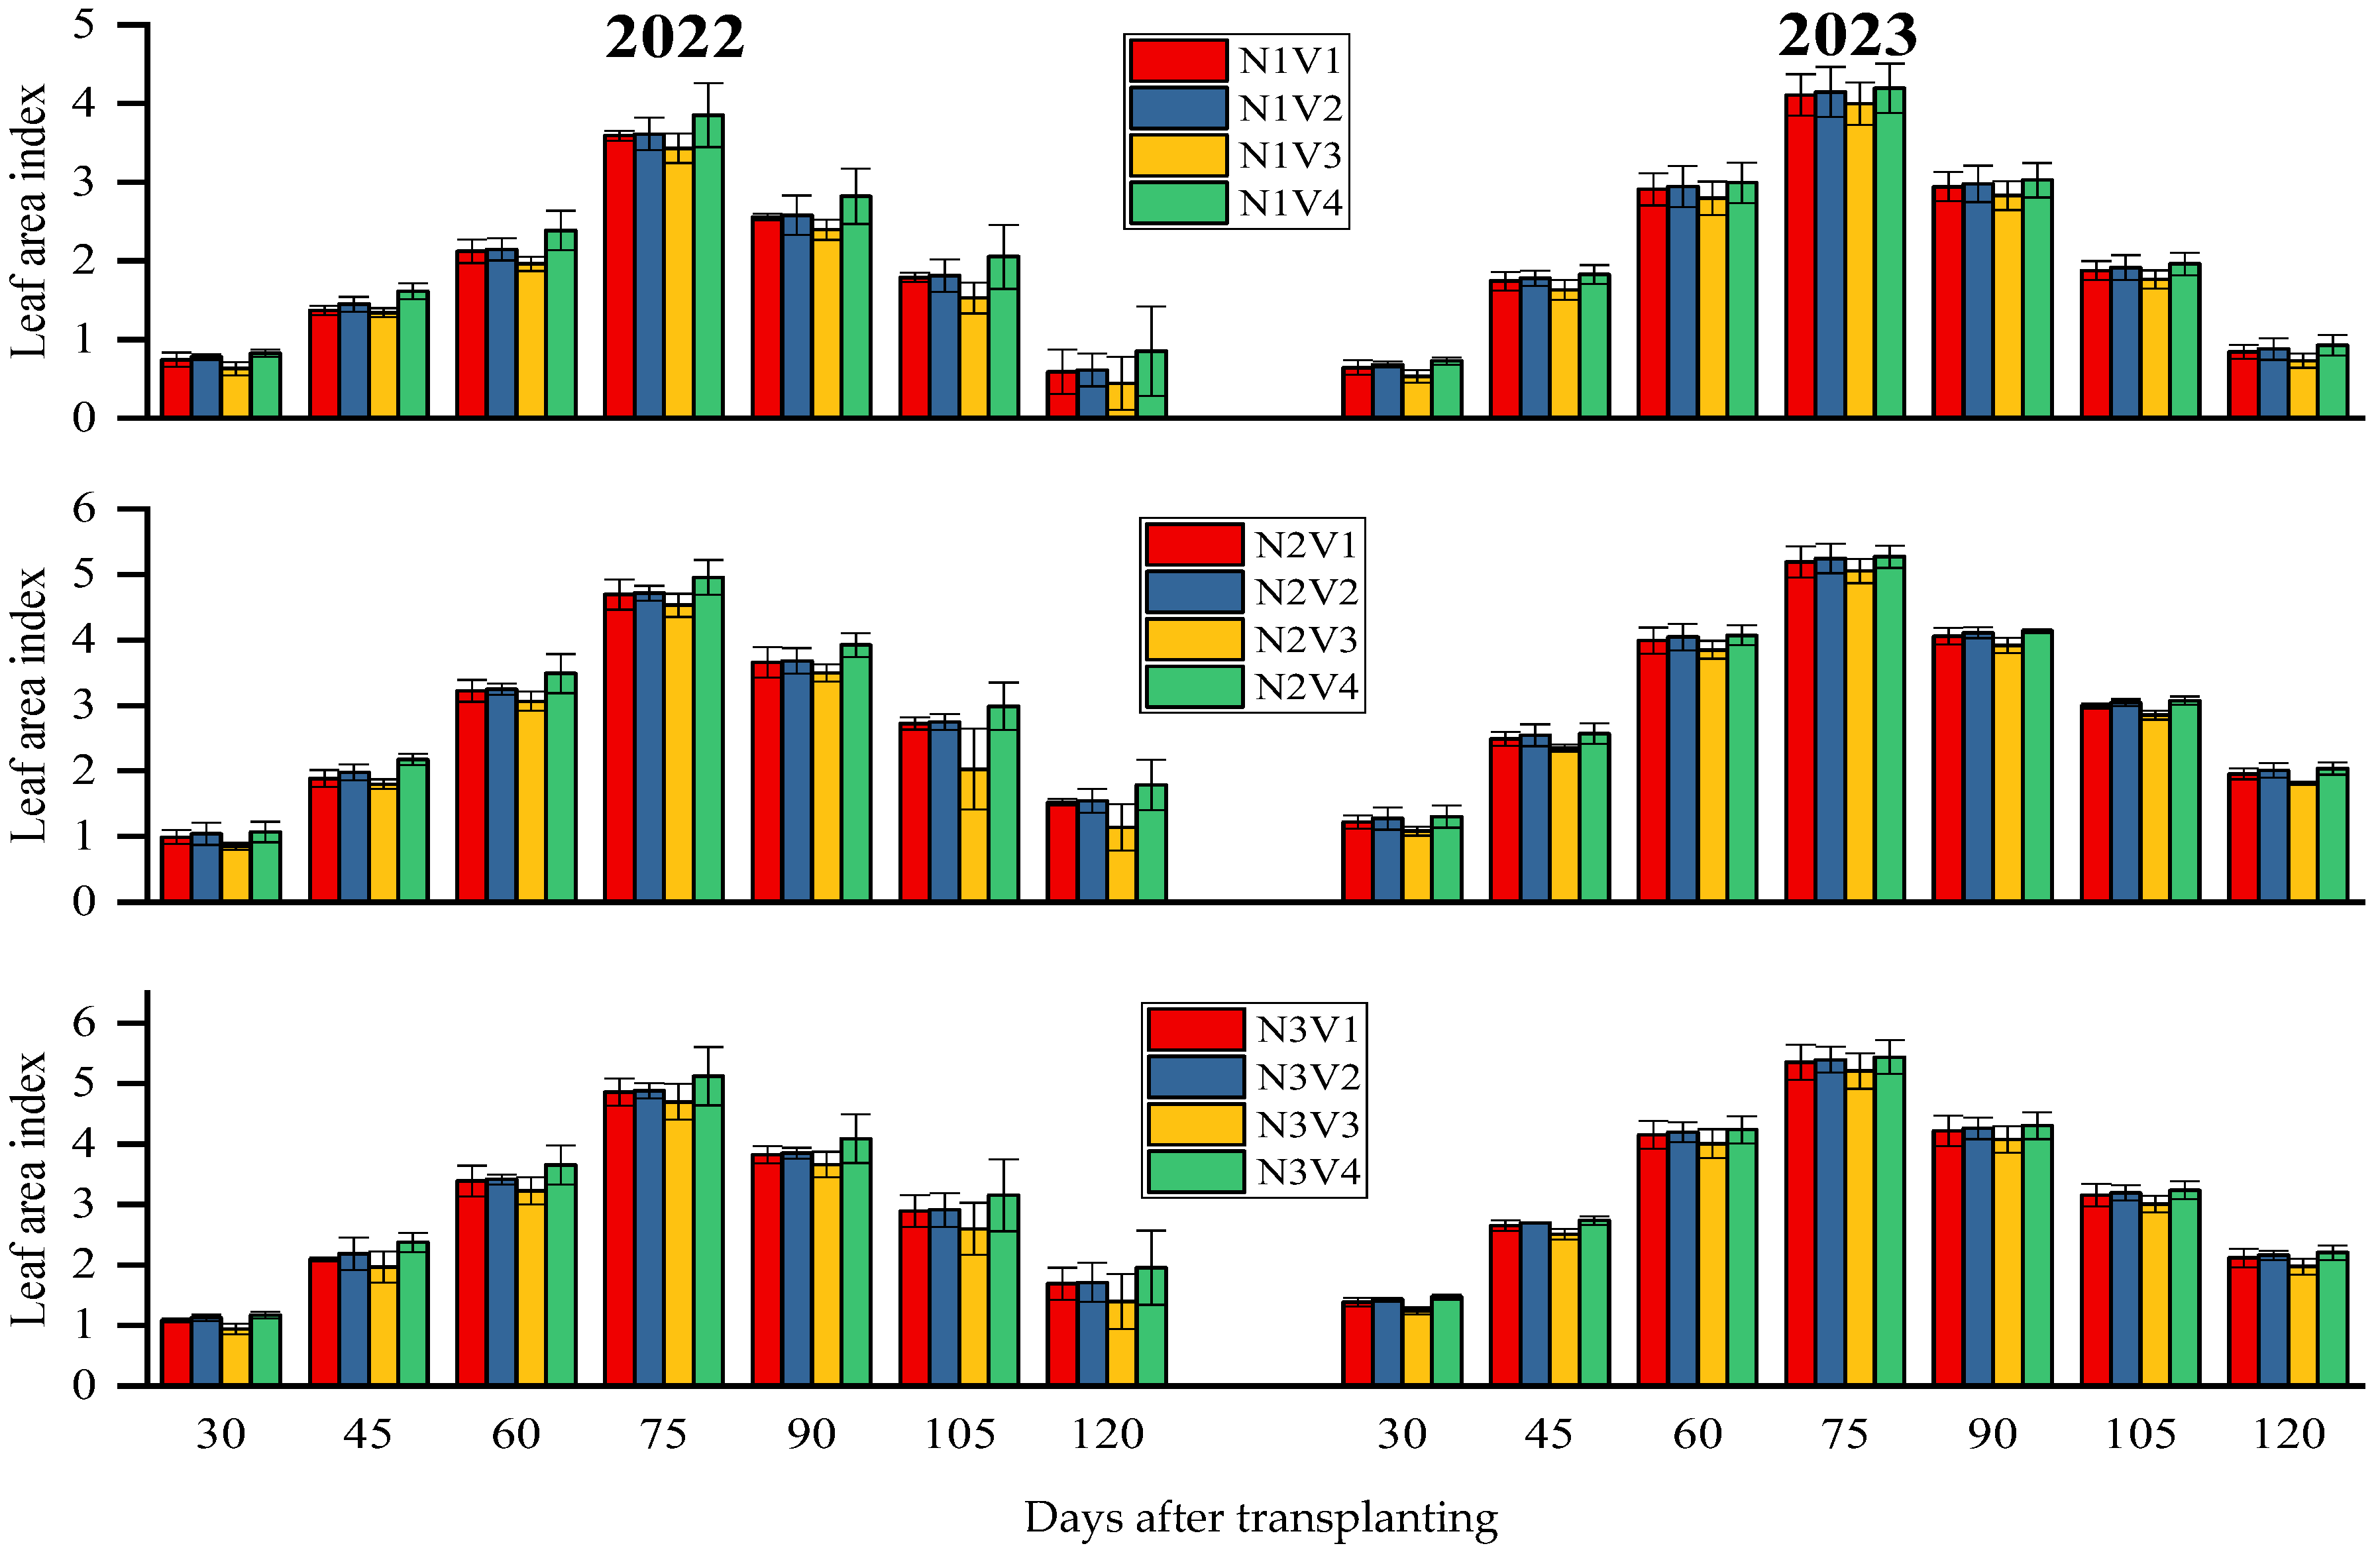
| LAI 1 | LAI 2 | LAI 3 | LAI 4 | LAI 5 | LAI 6 | LAI 7 | ||||||||
| 2022 | 2023 | 2022 | 2023 | 2022 | 2023 | 2022 | 2023 | 2022 | 2023 | 2022 | 2023 | 2022 | 2023 | |
| N1 | 0.74 ± 0.06 b | 0.64 ± 0.06 c | 1.44 ± 0.07 b | 1.74 ± 0.11 c | 2.15 ± 0.15 b | 2.91 ± 0.23 b | 3.62 ± 0.21 b | 4.11 ± 0.29 b | 2.58 ± 0.19 b | 2.94 ± 0.20 c | 1.79 ± 0.21 b | 1.87 ± 0.13 c | 0.62 ± 0.34 b | 0.84 ± 0.11 c |
| N2 | 0.98 ± 0.12 a | 1.22 ± 0.12 b | 1.96 ± 0.10 a | 2.48 ± 0.12 b | 3.25 ± 0.17 a | 3.98 ± 0.17 a | 4.72 ± 0.19 a | 5.18 ± 0.20 a | 3.68 ± 0.18 a | 4.05 ± 0.08 b | 2.62 ± 0.29 a | 2.98 ± 0.05 b | 1.49 ± 0.24 a | 1.95 ± 0.07 b |
| N3 | 1.08 ± 0.05 a | 1.38 ± 0.04 a | 2.15 ± 0.17 a | 2.64 ± 0.06 a | 3.42 ± 0.22 a | 4.14 ± 0.21 a | 4.88 ± 0.28 a | 5.34 ± 0.26 a | 3.85 ± 0.21 a | 4.21 ± 0.21 a | 2.88 ± 0.39 a | 3.14 ± 0.15 a | 1.68 ± 0.41 a | 2.11 ± 0.12 a |
| HSD (α 5%) | 0.1246 | 0.1465 | 0.2538 | 0.1524 | 0.3213 | 0.1622 | 0.3878 | 0.1622 | 0.3878 | 0.1493 | 0.4155 | 0.1493 | 0.3789 | 0.1493 |
| V1 | 0.93 ± 0.07 ab | 1.08 ± 0.08 ab | 1.78 ± 0.07 ab | 2.29 ± 0.10 ab | 2.91 ± 0.19 | 3.68 ± 0.21 ab | 3.37 ± 0.17 | 4.88 ± 0.26 ab | 3.34 ± 0.13 | 3.73 ± 0.18 ab | 2.46 ± 0.13 ab | 2.67 ± 0.11 ab | 1.26 ± 0.19 ab | 1.63 ± 0.10 ab |
| V2 | 0.98 ± 0.08 a | 1.12 ± 0.07 ab | 1.87 ± 0.16 ab | 2.33 ± 0.09 ab | 2.93 ± 0.10 | 3.72 ± 0.20 ab | 4.40 ± 0.14 | 4.92 ± 0.25 ab | 3.36 ± 0.18 | 3.78 ± 0.16 ab | 2.49 ± 0.20 ab | 2.71 ± 0.11 ab | 1.29 ± 0.23 ab | 1.68 ± 0.11 ab |
| V3 | 0.80 ± 0.07 b | 0.95 ± 0.06 b | 1.70 ± 0.12 b | 2.16 ± 0.08 b | 2.75 ± 0.15 | 3.55 ± 0.19 b | 4.21 ± 0.21 | 4.75 ± 0.24 b | 3.18 ± 0.15 | 3.60 ± 0.17 b | 2.05 ± 0.41 b | 2.54 ± 0.10 b | 0.99 ± 0.38 b | 1.08 ± 0.50 b |
| V4 | 1.02 ± 0.08 a | 1.16 ± 0.08 a | 2.05 ± 0.11 a | 2.37 ± 0.11 a | 3.17 ± 0.29 | 3.76 ± 0.21 a | 4.64 ± 0.38 | 4.96 ± 0.25 a | 3.60 ± 0.31 | 3.82 ± 0.15 a | 2.73 ± 0.45 a | 2.74 ± 0.11 a | 1.53 ± 0.52 a | 1.72 ± 0.11 a |
| HSD (α 5%) | 0.1591 | 0.1870 | 0.3240 | 0.1945 | NS | 0.2070 | NS | 0.2070 | NS | 0.1905 | 0.5303 | 0.1905 | 0.4835 | 0.1905 |
| Interaction | NS | NS | NS | NS | NS | NS | NS | NS | NS | NS | NS | NS | NS | NS |
| Treatments | Parameters | |||||||||||||
|---|---|---|---|---|---|---|---|---|---|---|---|---|---|---|
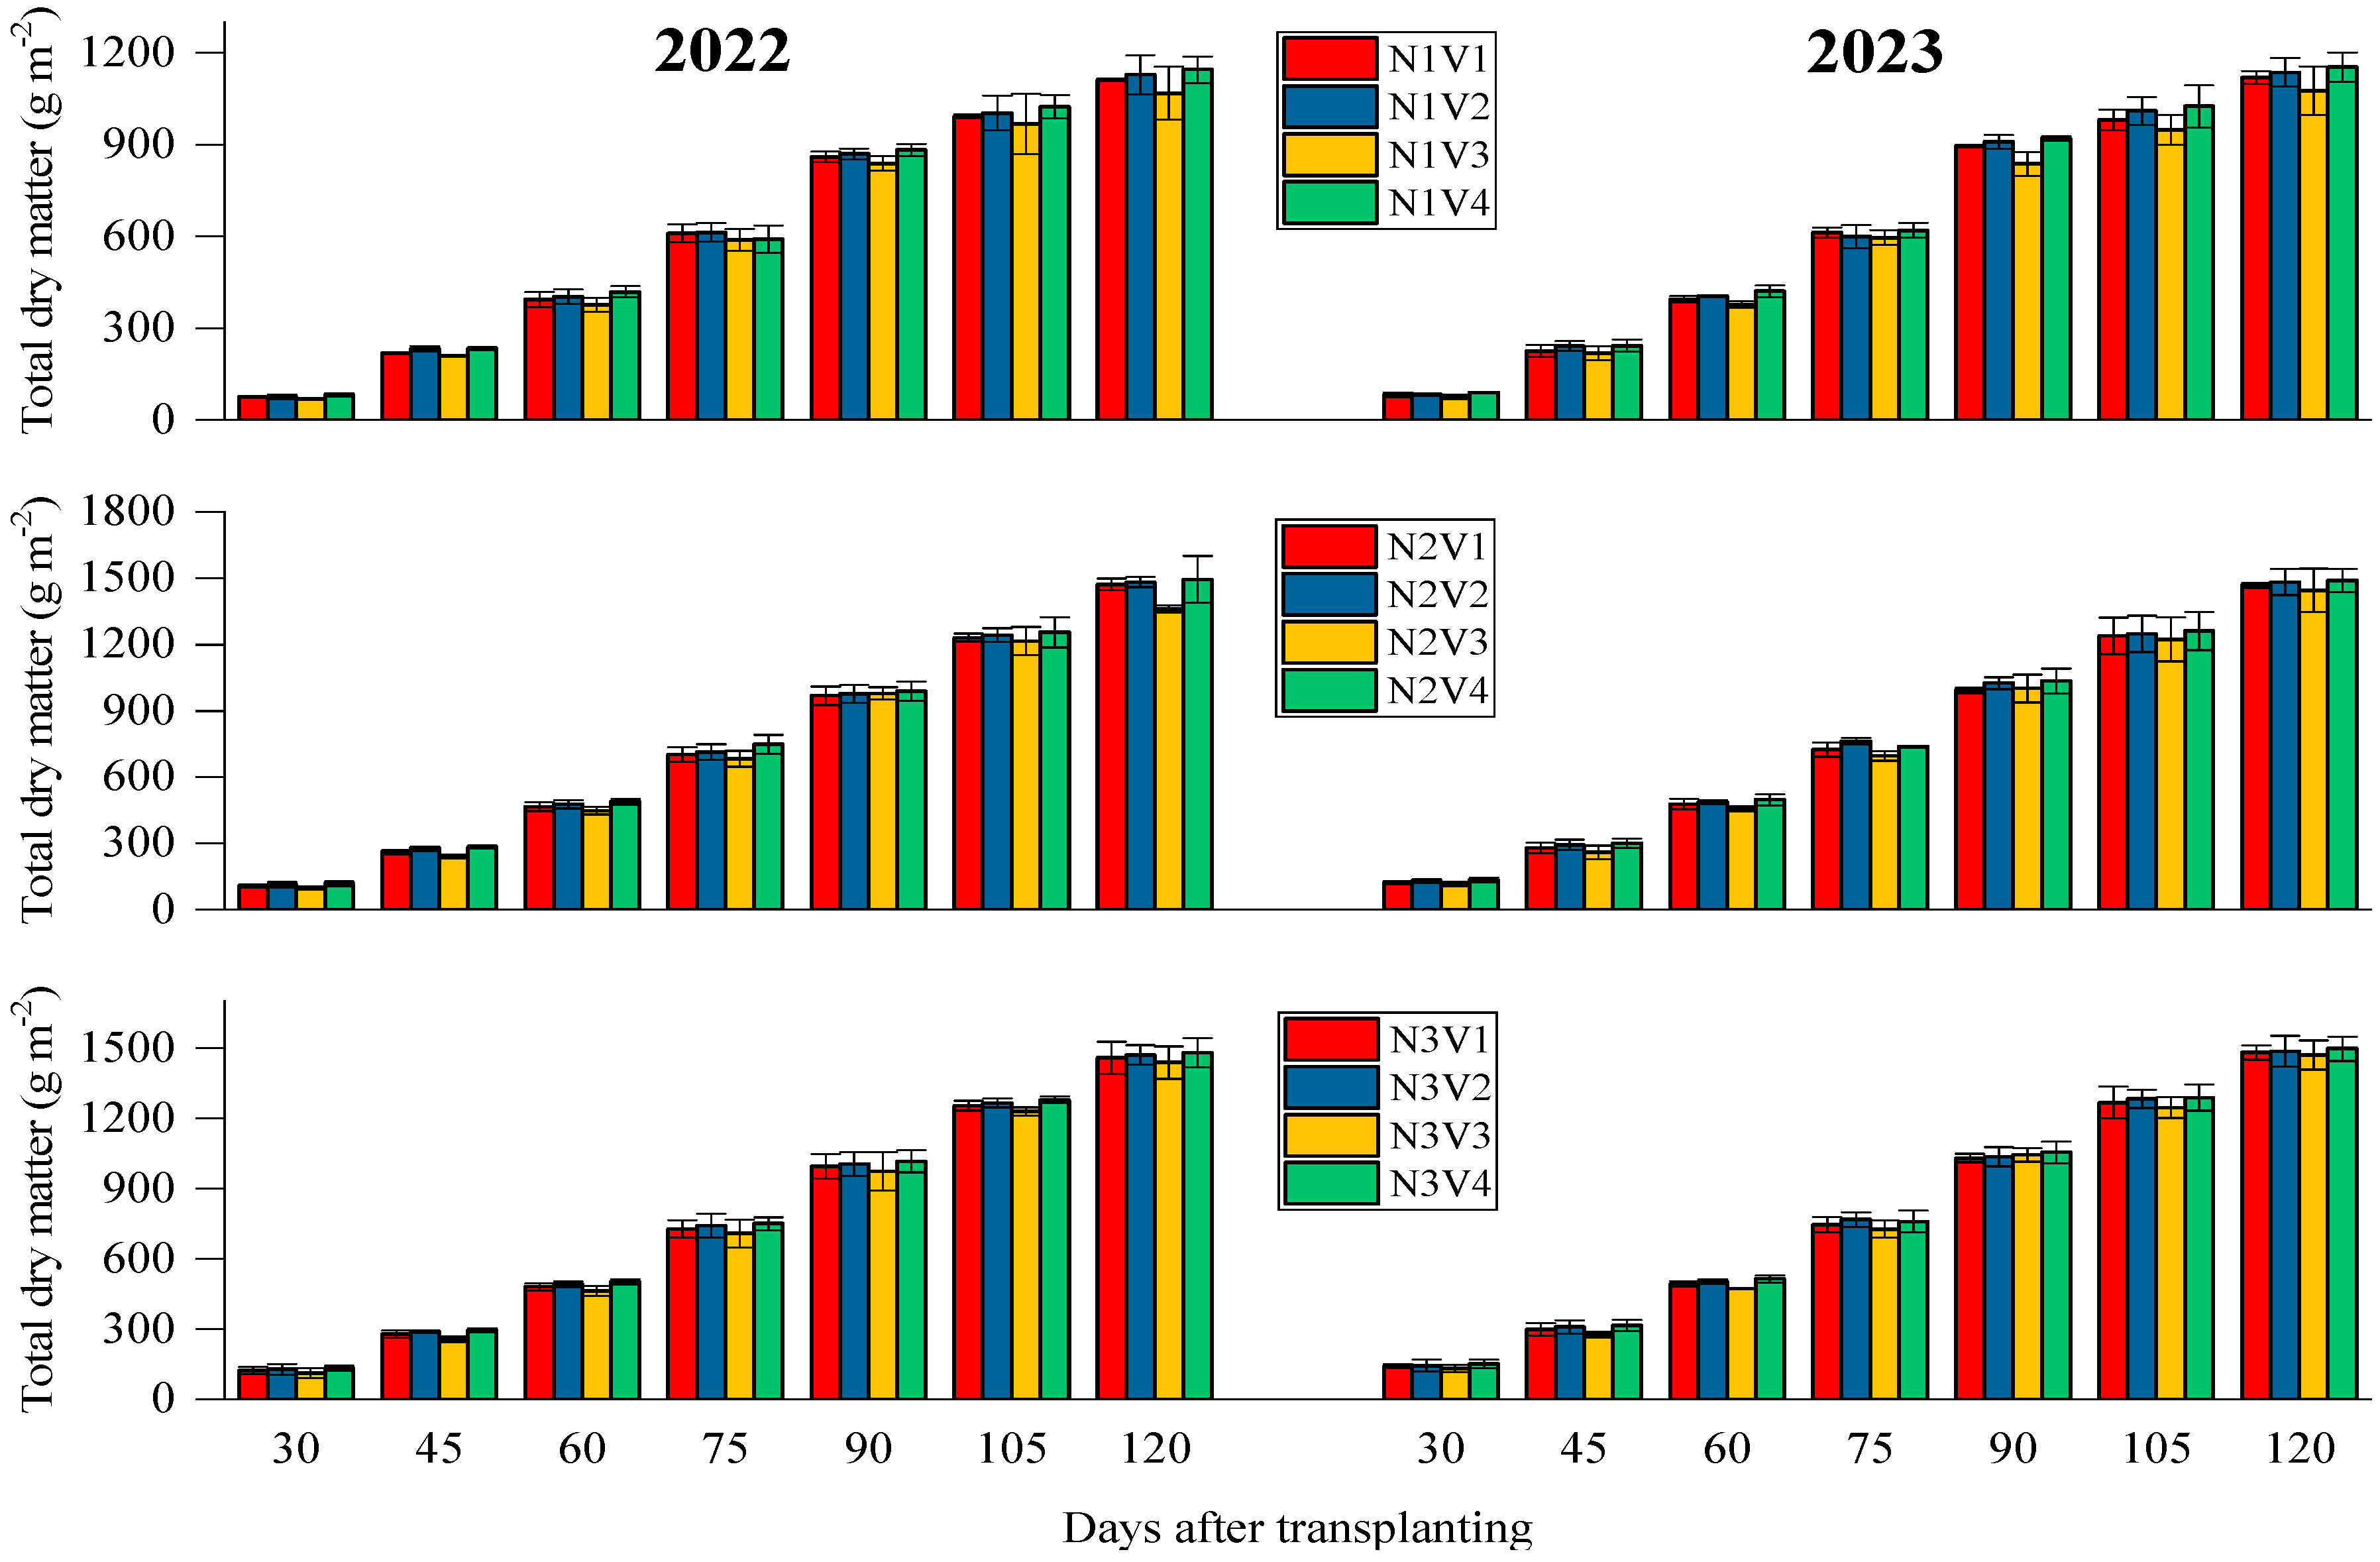
| TDM 1 | TDM 2 | TDM 3 | TDM 4 | TDM 5 | TDM 6 | TDM 7 | ||||||||
| 2022 | 2023 | 2022 | 2023 | 2022 | 2023 | 2022 | 2023 | 2022 | 2023 | 2022 | 2023 | 2022 | 2023 | |
| N1 | 75.5 ± 4.93 b | 83.0 ± 5.37 b | 223.3 ± 5.13 b | 232.5 ± 19.35 b | 398.63 ± 22.21 c | 399.39 ± 10.80 b | 600.84 ± 35.25 b | 607.08 ± 25.62 b | 863.01 ± 19.47 b | 890.70 ± 18.43 b | 997.10 ± 50.42 b | 991.50 ± 49.66 b | 1113.60 ± 49.50 b | 1121.20 ± 48.78 b |
| N2 | 108.75 ± 8.47 a | 125.29 ± 9.15 a | 265.30 ± 8.53 a | 283.37 ± 24.56 a | 469.41 ± 17.69 b | 479.84 ± 16.76 a | 711.71 ± 35.67 a | 730.12 ± 18.10 a | 978.48 ± 38.61 a | 1012.80 ± 39.40 a | 1236.20 ± 45.12 a | 1242.80 ± 87.56 a | 1452.60 ± 42.61 a | 1471.20 ± 55.53 a |
| N3 | 123.68 ± 17.91 a | 142.15 ± 16.83 a | 279.74 ± 10.42 a | 299.70 ± 22.80 a | 483.77 ± 14.72 a | 495.55 ± 10.61 a | 731.94 ± 43.32 a | 750.37 ± 36.82 a | 997.72 ± 57.97 a | 1041.20 ± 34.11 a | 1257.40 ± 17.83 a | 1271.30 ± 51.64 a | 1462.20 ± 60.65 a | 1484.30 ± 52.51 a |
| HSD (α 5%) | 16.892 | 20.049 | 14.945 | 16.889 | 13.125 | 22.787 | 21.756 | 29.551 | 40.551 | 48.355 | 71.482 | 86.606 | 82.275 | 90.918 |
| V1 | 101.30 ± 8.22 | 115.22 ± 8.32 | 252.87 ± 9.41 ab | 267.94 ± 23.34 ab | 446.84 ± 19.92 b | 454.95 ± 15.51 ab | 680.34 ± 33.10 ab | 694.73 ± 27.06 ab | 941.34 ± 37.62 | 972.20 ± 12.15 | 1159.5 ± 15.51 | 1162.30 ± 61.64 | 1347.70 ± 32.83 | 1356.30 ± 21.03 |
| V2 | 105.39 ± 13.83 | 119.54 ± 12.71 | 265.27 ± 7.81 a | 281.59 ± 22.86 a | 457.14 ± 18.17 ab | 464.75 ± 6.57 ab | 689.22 ± 38.55 a | 710.59 ± 27.52 a | 950.54 ± 36.32 | 990.50 ± 30.20 | 1170.90 ± 35.63 | 1180.90 ± 55.44 | 1360.80 ± 42.75 | 1368.50 ± 57.62 |
| V3 | 92.94 ± 10.28 | 107.34 ± 10.83 | 236.09 ± 8.04 b | 251.78 ± 21.51 b | 428.80 ± 19.94 c | 435.86 ± 8.72 b | 659.94 ± 43.26 b | 672.71 ± 27.70 b | 930.89 ± 44.06 | 960.60 ± 43.68 | 1137.70 ± 59.92 | 1139.40 ± 64.14 | 1289.20 ± 57.54 | 1330.50 ± 79.91 |
| V4 | 110.95 ± 9.42 | 125.09 ± 9.92 | 270.24 ± 6.86 a | 286.07 ± 21.24 a | 469.63 ± 14.79 a | 477.49 ± 20.09 a | 696.49 ± 38.75 a | 705.39 ± 25.11 ab | 962.85 ± 36.72 | 1003.20 ± 36.54 | 1186.30 ± 40.10 | 1191.70 ± 70.60 | 1373.50 ± 70.57 | 1380.20 ± 50.52 |
| HSD (α 5%) | NS | NS | 19.073 | 21.555 | 16.750 | 29.082 | 27.766 | 37.715 | NS | NS | NS | NS | NS | NS |
| Interaction | NS | NS | NS | NS | NS | NS | NS | NS | NS | NS | NS | NS | NS | NS |
| Treatments | Parameters | |||||||
|---|---|---|---|---|---|---|---|---|
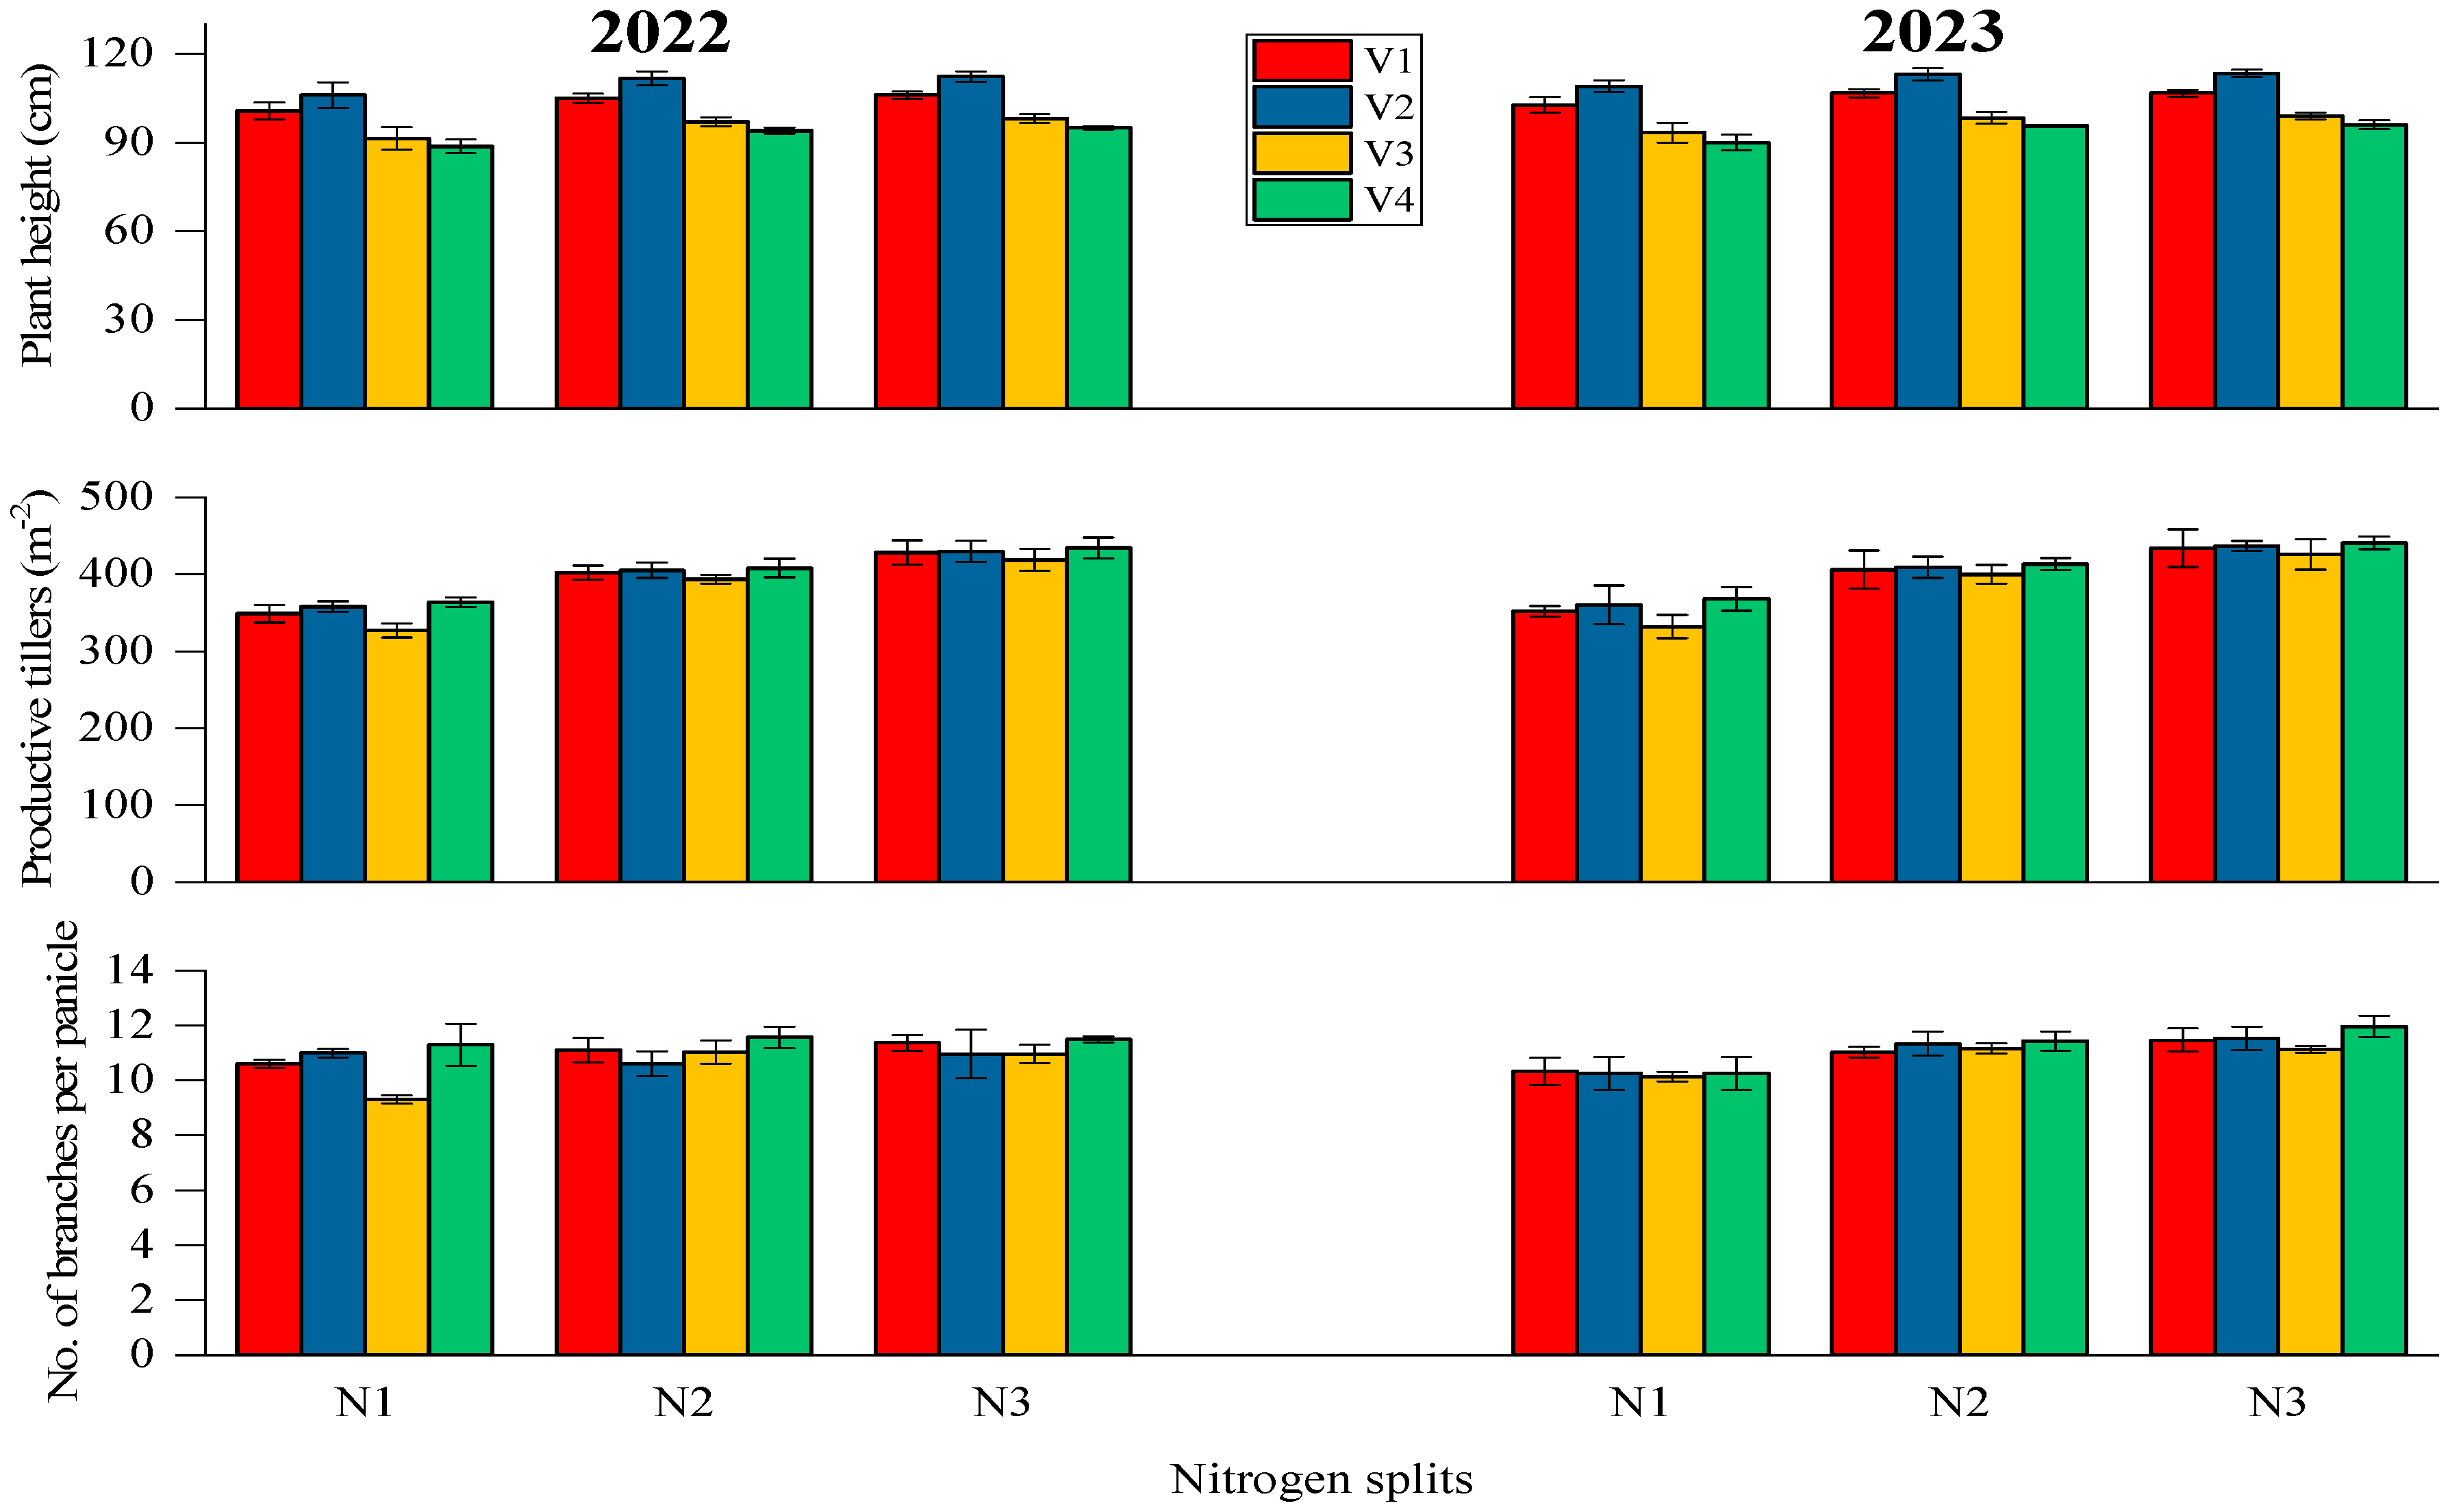
| Plant Height (cm) | Productive Tillers (m−2) | Number of Branches per Panicle | Number of Grains per Panicle | |||||
| 2022 | 2023 | 2022 | 2023 | 2022 | 2023 | 2022 | 2023 | |
| N1 | 96.67 ± 3.34 b | 98.75 ± 2.65 b | 349.34 ± 8.46 c | 352.91 ± 15.63 b | 10.55 ± 0.30 | 10.25 ± 0.47 b | 117.73 ± 3.01 b | 124.70 ± 6.20 b |
| N2 | 101.92 ± 1.6 a | 103.42 ± 1.47 a | 402.17 ± 9.24 b | 407.08 ± 14.64 a | 11.07 ± 0.42 | 11.24 ± 0.28 a | 161.33 ± 4.11 a | 169.08 ± 4.80 a |
| N3 | 102.83 ± 1.25 a | 103.75 ± 1.27 a | 427.74 ± 14.32 a | 434.39 ± 14.77 a | 11.20 ± 0.40 | 11.52 ± 0.33 a | 164.75 ± 4.68 a | 166.92 ± 6.35 a |
| HSD (α 5%) | 4.2123 | 3.6243 | 19.342 | 29.490 | NS | 0.6652 | 8.0981 | 11.052 |
| V1 | 103.89 ± 1.86 b | 105.33 ± 1.75 b | 393.10 ± 12.10 | 397.34 ± 18.89 | 11.02 ± 0.29 | 10.94 ± 0.36 | 148.81 ± 3.23 | 153.61 ± 7.81 |
| V2 | 110.00 ± 2.84 a | 111.78 ± 1.79 a | 397.61 ± 10.22 | 402.10 ± 14.96 | 10.85 ± 0.49 | 11.04 ± 0.48 | 149.21 ± 2.39 | 155.06 ± 5.65 |
| V3 | 95.44 ± 2.27 c | 96.89 ± 2.15 c | 379.71 ± 9.80 | 385.79 ± 15.79 | 10.43 ± 0.30 | 10.81 ± 0.16 | 144.11 ± 5.39 | 148.71 ± 4.84 |
| V4 | 92.56 ± 1.03 c | 93.89 ± 1.50 c | 401.93 ± 10.58 | 407.28 ± 10.42 | 11.45 ± 0.42 | 11.22 ± 0.44 | 149.81 ± 4.73 | 156.89 ± 4.83 |
| HSD (α 5%) | 5.3759 | 4.6255 | NS | NS | NS | NS | NS | NS |
| Interaction | NS | NS | NS | NS | NS | NS | NS | NS |
| Treatments | Parameters | |||||||
|---|---|---|---|---|---|---|---|---|
| 1000-Grain Weight (g) | Grain Yield (t ha−1) | Agronomic Nitrogen Use Efficiency | Partial Factor Productivity | |||||
| 2022 | 2023 | 2022 | 2023 | 2022 | 2023 | 2022 | 2023 | |
| N1 | 19.27 ± 1.68 b | 19.56 ± 1.19 b | 3.70 ± 0.21 b | 3.78 ± 0.18 b | - | - | 26.90 ± 1.55 b | 27.51 ± 1.31 b |
| N2 | 25.50 ± 0.91 a | 27.45 ± 0.87 a | 4.95 ± 0.23 a | 5.17 ± 0.25 a | 9.09 ± 1.93 a | 10.12 ± 1.91 a | 35.99 ± 1.74 a | 37.63 ± 1.82 a |
| N3 | 25.69 ± 1.13 a | 28.80 ± 0.59 a | 4.98 ± 0.20 a | 5.26 ± 0.28 a | 9.33 ± 1.75 a | 10.78 ± 2.02 a | 36.24 ± 1.52 a | 38.30 ± 2.07 a |
| HSD (α 5%) | 1.7923 | 1.5939 | 0.3309 | 0.4207 | 2.9690 | 2.8403 | 2.5066 | 3.0596 |
| V1 | 23.67 ± 1.40 | 25.47 ± 0.53 | 4.36 ± 0.20 bc | 4.67 ± 0.35 b | 6.06 ± 0.50 | 6.86 ± 1.51 | 31.75 ± 1.47 bc | 34.02 ± 2.55 b |
| V2 | 23.71 ± 1.06 | 25.64 ± 0.89 | 4.73 ± 0.22 ab | 4.98 ± 0.22 ab | 6.54 ± 1.06 | 6.70 ± 1.05 | 34.42 ± 1.62 ab | 36.28 ± 1.63 ab |
| V3 | 22.46 ± 1.46 | 24.07 ± 1.27 | 4.01 ± 0.10 c | 4.06 ± 0.08 c | 5.89 ± 0.77 | 6.78 ± 0.84 | 29.17 ± 0.77 c | 29.57 ± 0.64 c |
| V4 | 24.11 ± 1.05 | 25.91 ± 0.82 | 5.06 ± 0.35 a | 5.23 ± 0.29 a | 6.06 ± 2.57 | 7.51 ± 1.83 | 36.84 ± 2.55 a | 38.06 ± 2.12 a |
| HSD (α 5%) | NS | NS | 0.4223 | 0.5369 | NS | NS | 3.0714 | 3.9049 |
| Interaction | NS | NS | NS | NS | NS | NS | NS | NS |
Disclaimer/Publisher’s Note: The statements, opinions and data contained in all publications are solely those of the individual author(s) and contributor(s) and not of MDPI and/or the editor(s). MDPI and/or the editor(s) disclaim responsibility for any injury to people or property resulting from any ideas, methods, instructions or products referred to in the content. |
© 2024 by the authors. Licensee MDPI, Basel, Switzerland. This article is an open access article distributed under the terms and conditions of the Creative Commons Attribution (CC BY) license (https://creativecommons.org/licenses/by/4.0/).
Share and Cite
Sajjad, M.; Hussain, K.; Wajid, S.A.; Saqib, Z.A. The Impact of Split Nitrogen Fertilizer Applications on the Productivity and Nitrogen Use Efficiency of Rice. Nitrogen 2025, 6, 1. https://doi.org/10.3390/nitrogen6010001
Sajjad M, Hussain K, Wajid SA, Saqib ZA. The Impact of Split Nitrogen Fertilizer Applications on the Productivity and Nitrogen Use Efficiency of Rice. Nitrogen. 2025; 6(1):1. https://doi.org/10.3390/nitrogen6010001
Chicago/Turabian StyleSajjad, Muhammad, Khalid Hussain, Syed Aftab Wajid, and Zulfiqar Ahmad Saqib. 2025. "The Impact of Split Nitrogen Fertilizer Applications on the Productivity and Nitrogen Use Efficiency of Rice" Nitrogen 6, no. 1: 1. https://doi.org/10.3390/nitrogen6010001
APA StyleSajjad, M., Hussain, K., Wajid, S. A., & Saqib, Z. A. (2025). The Impact of Split Nitrogen Fertilizer Applications on the Productivity and Nitrogen Use Efficiency of Rice. Nitrogen, 6(1), 1. https://doi.org/10.3390/nitrogen6010001