Article

Simulating Maize Response to Split-Nitrogen Fertilization Using Easy-to-Collect Local Features

by
Léon Etienne Parent
1,* and
Gabriel Deslauriers
2
1
Department of Soils and AgriFood Engineering, Université Laval, 2425 Rue de l’Agriculture, Québec, QC G1V 0A6, Canada
2
PleineTerre Inc., 169 Rue St-Jacques, Napierville, Québec, QC J0J 1L0, Canada
*
Author to whom correspondence should be addressed.
Nitrogen 2023, 4(4), 331-349; https://doi.org/10.3390/nitrogen4040024
Submission received: 13 June 2023 / Revised: 30 October 2023 / Accepted: 3 November 2023 / Published: 9 November 2023
(This article belongs to the Special Issue Optimizing Fertilizer Nitrogen Use on Crops)

Abstract

:
Maize (Zea mays) is a high-nitrogen (N)-demanding crop potentially contributing to nitrate contamination and emissions of nitrous oxide. The N fertilization is generally split between sowing time and the V6 stage. The right split N rate to apply at V6 and minimize environmental damage is challenging. Our objectives were to (1) predict maize response to added N at V6 using machine learning (ML) models; and (2) cross-check model outcomes by independent on-farm trials. We assembled 461 N trials conducted in Eastern Canada between 1992 and 2022. The dataset to predict grain yield comprised N dosage, weekly precipitations and corn heat units, seeding date, previous crop, tillage practice, soil series, soil texture, organic matter content, and pH. Random forest and XGBoost predicted grain yield accurately at the V6 stage (R2 = 0.78–0.80; RSME and MAE = 1.22–1.29 and 0.96–0.98 Mg ha−1, respectively). Model accuracy up to the V6 stage was comparable to that of the full-season prediction. The response patterns simulated by varying the N doses showed that grain yield started to plateau at 125–150 kg total N ha−1 in eight out of ten on-farm trials conducted independently. There was great potential for economic and environmental gains from ML-assisted N fertilization.

1. Introduction

Maize (Zea mays) is a high-nitrogen (N)-demanding crop. In Canada, two main groups of maize N response patterns have been identified using a mechanistic–empirical model [1]. The economic optimum nitrogen rate (EONR) was found to range from 115 to 199 kg N ha−1 for low-nitrogen-use efficiency sites and from 79 to 154 kg N ha−1 for high-N-use efficiency sites. Compared to official N recommendations of 120 to 170 kg N ha−1 [2], the EONRs in multi-environmental trials conducted in eastern Canada were found to vary widely between 0 and 240 kg N ha−1 [3,4], indicating site-specific maize response to added N.
Disregarding the large variation in maize N requirements will result not only in economic losses but also in nitrate leaching that impacts water quality, and in emissions of nitrous oxide (N2O), a potent greenhouse gas that also depletes stratospheric ozone [5,6,7]. When addressing climate change issues, fertilization decisions to tackle N2O emissions may show even greater leverage than soil C sequestration [8]. Microbial inhibitors do not appear to be a solution to tackle N2O emissions [9]. The rate of N fertilization should thus be reduced. However, N fertilizer recommendations have been puzzling for decades, without agreement on which methodology is the best to balance environmental and economic outcomes [10]. There is an urgent need to reach high crop yields with the parsimonious use of N fertilizers, given that agriculture accounts for ≈80% of contemporary global anthropic N2O emissions in constant progression [11].
In the traditional mass balance (N budget) approach, crop nutrient uptake is computed as the product of expected yield (yield goal) and crop N concentration, which can vary widely [12]. The weakness of yield goal estimates is attributable to the selected hybrid, fertilizer type, and variability in weather and soil N supply, and the coefficient used to adjust yield goal [13]. Crop N uptake has been inflated by maize yield increasing in average by 1.55% per year between 1981 and 2019 across North America [14]. Maize hybrids of the “New Era” are more productive and more responsive to soil N in zero-N plots and per unit of applied N compared to Old Era hybrids developed before 1992 [15,16]. The budgeted N credits for previous crops, manure applications, and the mineralization of soil organic matter are pre-defined while residual soil nitrates are measured. The simplistic accounting approach is still widely used by growers [13].
Nitrate tests, the maximum return to N (MRTN), mechanistic–empirical models, and crop sensing emerged as alternative N models with which to assess EONR. Their pros and the cons were reviewed thoroughly [12,13]. The pre-sidedress nitrate tests (PSNT) performed around V5 corn developmental stage are widely used to support ex ante split-N recommendations. While split-N fertilization provides an opportunity to adjust the N rate given the site conditions prevailing before the V6 developmental stage, nitrate tests were found to be weakly correlated to EONRs (p ≤ 0.10, r2 ≤ 0.20) [13]. Mechanistic–empirical models often require nitrate tests and empirical parameters. Crop sensing for split-N application requires a representative N-rich reference and is expensive.
Large uncertainty in EORN assessment often leads growers to add “insurance extra N” against risk of yield loss [17,18,19]. A great challenge is to predict site-specific EONR accurately [17,18,19,20,21,22]. Multi-environment fertilizer trials (MEFT) are thus conducted to derive EONR values tailored to environmental conditions [12]. In field trials, many growth factors are confounded, limiting their assemblage into a database without considering several growth factors. The estimate of EONR at each experimental site also depends on the selection of the non-linear response functions that are subject to biases and errors due to slopes varying widely toward maximum yield [18].
The MEFTs have been analyzed using mechanistic–empirical, mixed linear, or machine-learning (ML) models [1,12,23,24,25,26,27,28,29]. Those learning techniques can process large amounts of data. The nature of the data is more important than the learning technique [30]. Databases can be balanced or not. Databases can be rebalanced using imputation methods [31,32]. Models are calibrated using a training dataset and validated using a testing set [33]. To verify model’s ability to generalize to untested fields, universality tests conducted in growers’ fields are crucial.
Machine learning (ML) models tend to outperform linear models to capture informative patterns as the training size increases [34]. The ML decision trees are non-parametric, have very few parameters and good scalability, and can detect multivariate interacting effects among variables in high-dimensional databases [35,36]. The extreme gradient boosting (XGBoost) and random forest (RF) proved to be efficient ML methods with which to predict EONR [29,37,38] and crop performance [39]. Several features, such as soil chemical, physical and biological properties, weather conditions, management practices, soil hydrology, and sensor data can be documented and processed [12,26,40,41,42,43,44,45]. This limits the ceteris paribus assumption of equal or optimal growing conditions [46,47] needed to run models. To facilitate model adoption, features should be easy to collect by stakeholders.
Our objectives were to (1) predict the maize response pattern to added N using machine learning (ML) models as relevant to assess the right N rate to apply at V6 stage; and (2) cross-check model outcomes by independent on-farm trials (universality tests). The models addressed the following questions: (1) which variables affect crop performance the most; (2) how is the N dosage compared to other driving variables; (3) whether the response pattern predicted at stage V6 exists with respect to factors such as managerial, edaphic, and meteorological features; and (4) can the right N rate to apply at V6 be predicted reliably from simulated response patterns? The ability of models to reflect the real world was measured by its accuracy and its ability to generalize to unseen cases in growers’ fields.

2. Materials and Methods

2.1. Database

We assembled 461 annual maize N fertilizer trials conducted in Quebec, Canada, by several research teams between 1992 and 2022. Experimental sites were located between 45.000 and 46.078 North Latitude and between −71.067 and −75.381 West Longitude. The yearly distribution of trials is presented in Figure 1. The historic database comprised 324 fertilizer trials and were unevenly documented by various research teams. We conducted 142 new trials between 2017 and 2022 that were balanced across features. There were 8908 observations in total (6789 in the historic database and 2119 in the recent database).

2.2. Features

The yield variable and the associated documented features are presented in Table 1. The choice of features is based on the current knowledge on maize production systems. Before 2013, the tillage practice was mainly conventional (ploughing and harrowing). From 2013 to 2019, 39–52% of maize areas in Quebec were under conservation tillage (reduced tillage or no till), with an objective of ≥70% by 2030 [48]. There were 1894 plots under reduced tillage, 1707 under no till, and 5043 under conventional tillage. On average, seeding, split-N application, and harvesting were conducted on 10 May, 14 June, and 19 October, respectively.
The mineral N sources included diammonium phosphate, ammonium polyphosphates, urea, ammonium nitrate mixed with lime, and urea–ammonium nitrate solutions. We assumed that differences were negligible among mineral N sources due to the rapid conversion of ammonium to nitrate in agricultural soils [49]. Some mineral N was band-applied at seeding. The remainder was split-applied between the end of V5 and the beginning of V7. Each trial comprised three to seven N treatments replicated three to four times in small plots, and two to twelve times in strip trials. Total N application ranged from 0 to 365 kg N ha−1. Most trials included an N-based fertilization at seeding. Spacings between N doses were 40 or 50 kg N ha−1. Soil bulk density in upper layers, subsurface drainage, and surface leveling were added as features in 2017 and later. Soil test results other than pH and soil organic matter were discarded because they were already addressed by local recommendation guidelines. Maize was scarcely irrigated except in some coarse-textured soils. The managerial features other than the ones listed were assumed to be addressed adequately by growers. Soil series were characterized at experimental sites or retrieved from soil maps.
While soil degradation may impact crop yield, there is still no clear relationship between maize yield and EONR [12]. Bulk density and nitrate tests are useful diagnostic tools for soil quality and N supply, respectively, but show high spatial variability and are laborious to collect [50,51]. However, they could be assessed from related features.
Nitrate (NO3) tests conducted before N split application are thought to reflect the rapidity at which NO3-N accumulates in the soil from the mineralization of soil organic matter, exogeneous organic materials and previous crops, residual synthetic fertilizers, and the nitrate remaining in the soil after leaching or denitrification under early spring weather conditions [52]. The PSNT may be redundant because its driving variables were coarsely documented in the database. For example, soil organic matter is reported as total organic matter of unknown composition but may be recalcitrant or labile. Organic fertilizers (manures, biosolids) are subject to stringent regulation on maximum P rate and the related N rate to apply considering their source and composition, the method and time of application, and proximate N availability coefficients. However, such information was not available in the database that reported the category of organic fertilizer only. The database indicated that 2192 trials received organic fertilizers and 3537 trials did not receive any organic fertilizer. Previous crops were mostly soybean in recent trials, and maize in older trials. We documented 3923 plots with soybean as previous crop, 2692 with maize, 957 with small grains, 375 with forage crops, and 89 with other crops. While N credits from previous crops are often pre-defined but vary widely [13], the contribution of previous crops to the N supply remains uncertain. Local N supply by soil organic matter, organic fertilizers, previous crops, and other N sources that also depend on local managerial, edaphic, and meteorological features must be reflected as a whole in the crop response to mineral N fertilization.
Soil bulk density is commonly used as an indicator of soil compaction [53]. While a no-till pan may overly a plough pan [54,55], the maximum depth to increase compaction was found to be 35 cm in a loam soil [56]. Soil compaction can be reversible by ripping and rooting down to 25–40 cm. We thus measured bulk density down to 45 cm. Soil bulk density is likely a redundant feature due to its close relationship with soil texture, organic matter, soil classification (soil series), soil moisture content (weekly precipitations), previous crops, organic amendments, tillage practice, and the use of heavy farm machinery associated with organic fertilization [57,58,59]. Compaction may also develop irreversibly at depths >40 cm, impacting yield permanently [59,60]. However, compaction at depths >40 cm was not documented in the database.
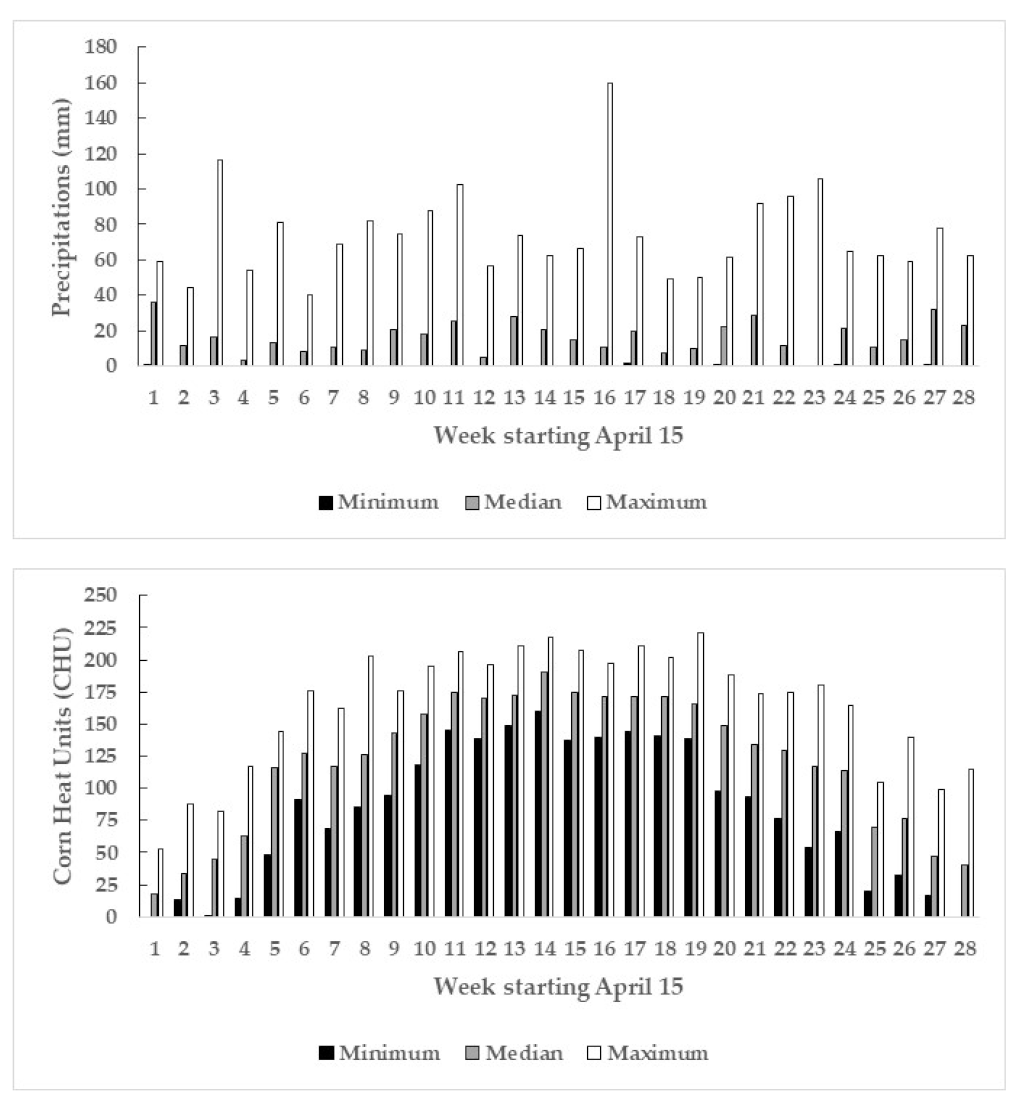
Meteorological features were assessed from the year of experimentation, geographic coordinates, and the seeding date [61]. Where the GPS coordinates were not taken at the site of experimentation in older studies, the geographical coordinates of the municipality assigned to the site were obtained from Google Maps. We documented weekly precipitations and corn heat units (CHU) from the Environment Canada meteorological stations closest to the sites (distance varied between 0.6 and 43.3 km, median distance was 10.8 km). Meteorological conditions varied widely during the 30-year experimental period (Figure 2). Weekly precipitations ranged from zero to 160 mm. The CHUs showed similar trends among minimum, median, and maximum values. The lack of adequate spatial resolution of weather data may be a constraint for the development of accurate forecasts and decision support tools [20,61]. While it is suggested that the most relevant in-season weather features should be collected between planting and 60 d after planting [62], in-season meteorological data should be collected earlier because the average time for split-N application at V6 in our database averaged 34 days after planting. Full-season weather conditions may thus show higher model accuracy compared to in-season weather conditions [61].

2.3. Missing Data

There were 31% missing data in the database, primarily in the historic dataset, due to different objectives and financial support among research projects. Missing data can limit and potentially bias posterior analyses [31,32]. The database was “rebalanced” using random forest imputation [31,32].

2.4. Data Transformation

Compositional data are strictly positive data constrained to 100%. One part can be computed via the difference between the whole (e.g., 100%) and the sum of the other parts. Any change in one part must resonate on others, generating spurious correlations and redundant information. There are thus D-1 degrees of freedom in a D-part composition [63]. The closure problem can be solved using log-ratio transformations [63,64,65]. The D-1 isometric log ratio (ilr) variables, also called contrasts or orthonormal balances, are cardinal variables or coordinates that reduce the D-parts to D-1 degrees of freedom. The ilr of the ith component is computed as follows [65]:
i l r i = r s r + s l n G r G s
where r and s are numbers of parts at numerator and denominator of the selected binary balance, respectively, and Gr and Gs are geometric means across those respective parts. The ilr transformation was applied to the sand, silt, and clay simplex [28], and to the podzolization–gleyzation fuzzy scores for soil series [66]. Fuzzy scores assign values of 1 for presence, 0.5 for weak expression, and 0 for absence of the trait in the soil genetic horizons. Fuzzy scores are numerical expressions that represent the relative importance of the podzolic to gleyic pedogenic traits in the subsoil (>30 cm), as follows: m.3a (dominant traits of podzolization), m.3b (intermediate traits), and m.3c (dominant traits of gleization). The balance designs are presented in Figure 3.

2.5. Machine Learning and Mixed Models

We tested two different tree-based ML regression models among more than 100 variants commonly used in soil science [39,67], i.e., random forest and XGBoost, two decision-tree models available in the Orange Data Mining freeware v. 3.34.0 programmed in the Python language (University of Ljubljana, Ljubljana, Slovenia). Decision-tree models separate two subsets recursively about cutoff points that minimize the variance of the target variable until a minimum number of instances is reached. Where the number of features is large, the decision rules are difficult to track (“black box”). Because each split in decision-tree models depends on the parent split from the selected feature, a few changes in the training dataset may yield different trees and model outcomes. The MEFT data are partitioned into training and testing sets using stratified random sampling by trial to avoid random sampling across observations that leads to model overfitting [28].
Random forest and XGBoost have different model structures. Random forest is a bagging decision-tree model that averages predictions made by sampling with replacement. Random forest generates hundreds of decision trees during the random extraction in the training dataset and a random extraction of features. We selected number of trees = 40, number of features at each split = 7, and no split for subsets smaller than 5 as hyperparameters. The XGBoost is a variant of the tree-based ensemble gradient-boosting method that combines weak predictive models to minimize prediction error. The XGBoost creates and adds sequentially trees of learners to correct the weakness of the preceding estimators. We selected number of trees = 50, learning rate = 0.300, and the limit of individual trees = 7 as hyperparameters. The RReliefF algorithm ranks features according to their relevance to the target variable [68]. The RReliefF computes a difference between actual and predicted values in regression problems based on the nearest neighbor paradigm and operates in a non-myopic manner after considering feature interactions. The accuracy of regression models was measured as the R2 coefficient, RMSE (root mean square error), and MAE (mean absolute difference), as follows [38]:
R 2 = 1 i = 1 n y i ŷ i 2 i = 1 n y i y i ¯ 2 ,
R M S E = 1 n i = 1 n y i ŷ i 2 ,
M A E = 1 n i = 1 n y i ŷ i ,
where y i is the observed target variable, ŷ i is the predicted target variable, y i ¯ is the mean of observed target variables, and n is the number of observations. The coefficient of determination ( R 2 ) was interpreted to qualify model strength as follows [69]: R 2 < 0.25, very weak; 0.25 ≤ R 2 < 0.50, weak; 0.50 ≤ R 2 < 0.75, moderate; R 2 ≥ 0.75: substantial.
The 85:15 partition between training and testing sets was selected to reach high model accuracy. Tuning parameters were selected iteratively to return the lowest RMSE. Because random forest and XGBoost are different ways to process the data, they may return different response patterns despite similar accuracies. The accuracy of ML models was compared to that of a mixed linear model for multi-environmental trials [45] run using statsmodels.formula.api.mixedlm.

2.6. Universality Test

Any model is a simplified approximation of the reality. Hence, models may fail to generalize to unseen cases or to cover the breadth of complexity observable in a very diversified world [33]. This requires additional tests (universality tests) for model’s truthfulness and ability to generalize by conducting on-farm trials [33]. Similar tests were conducted by [23] in the US for the mechanistic–empirical Adapt-N model. Despite potential divergence between model outcomes (simulated maize yields) in universality tests, we assumed that the optimum N rate does not depend on yield at EONR [12]. While simulated yield levels may differ among ML models, the response patterns and EONR values may be comparable.
The response patterns predicted by the ML models were verified in ten commercial fields located between 45.1 and 45.9 North Latitude and −73.5 and −72.8 West Longitude. Crop yields were predicted for total N additions in the range of 50 to 250 kg N ha−1 [3,4,12]. The simulations were initiated at 50 kg N ha−1 because most trials included a low N rate as a “starter” fertilizer at seeding. Predicted yields were compared to actual yields to assess model generalization ability [28,33,45].

3. Results

3.1. Models

3.1.1. Relative Importance of Features

The managerial and edaphic features showed high impact on maize yield (Figure 4). The tillage class and N dosage were prominent features. Soil features had an intermediate impact. The PSNT, soil bulk density, organic amendments, and soil organic matter content contributed less. There was thus great potential to improve the model by eliminating PSNT and soil bulk density, which are laborious features to collect.

3.1.2. Model Accuracy

We aimed to assess model accuracy using N dosage, precipitations, CHU, previous crop, tillage practice, soil texture, soil series, soil organic matter content, soil pH, organic amendments, and seeding date as key features easy to collect. Comparing scenarios no. 1 and 2 in Table 2, model accuracies decreased considerably by discarding meteorological features, bulk density and PSNT. Eliminating bulk density and PSNT only (scenarios no. 3 in Table 2), the impact on model accuracy was found to be negligible. Meteorological data contributed largely to model accuracy.
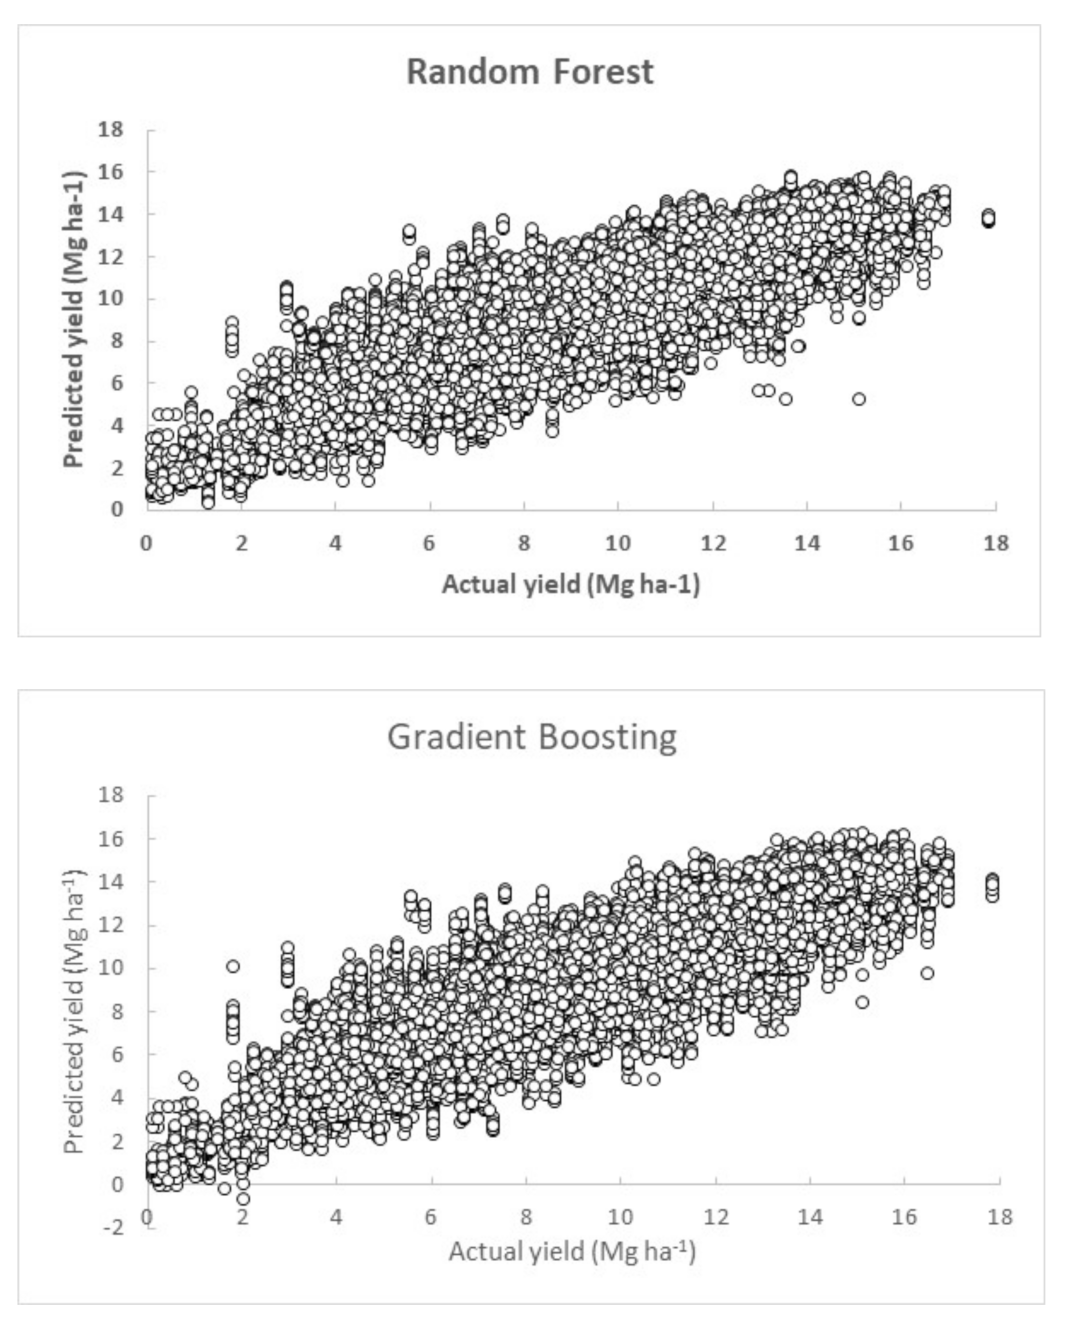
The mixed model performed much less than the ML models. The full-season mixed model returned R2 = 0.487, RSME = 1.996, and MAE = 1.529. Interestingly, random forest and XGBoost predicted grain yield accurately at stage V6 (R2 = 0.78–0.80; RSME and MAE = 1.22–1.29 and 0.96–0.98 Mg ha-1, respectively) (Table 2). The relationship between predicted and actual yields is presented in Figure 5 for scenario no. 4. Both ML models tended to overpredict low actual yields and underpredict high actual yields. Indeed, features potentially limiting yield such as grower’s management skill, soil landscape, soil thickness, and shallow water table, as well as soil water regime and other soil quality indicators that may impact crop yield were not documented in the database. Nevertheless, scenario no. 4 appeared promising to abate “insurance N”.

3.2. On-Farm Universality Tests for Model Generalization Ability

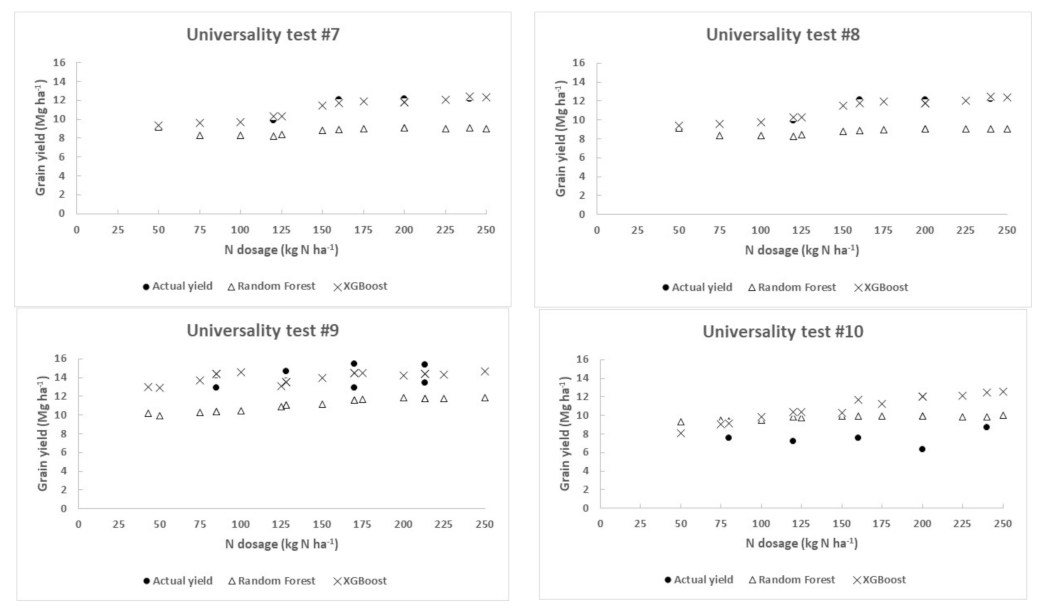
Sites used to conduct universality tests received no organic fertilizer. Previous crop, tillage practice, soil texture, and N rates varied among the sites (Table 3). Maximum actual yields varied between 9 and 15 Mg ha−1, a common range for the region. Figure 6 presents three perspectives of maize response to N fertilization to assist growers’ decision on the right N rate to apply: random forest simulation, XGBoost simulation, and growers’ own results.
Maize response patterns were point-painted by ML models at 25 kg N ha−1 intervals (Figure 6). While the N ranges selected by some growers were narrower, the simulations expanded the range of N rates to 10–13 N rates to build more comprehensive response patterns. The yields predicted by random forest and XGBoost most often overlapped across their respective RSME or MAE (except at sites #3 and #10). The trajectories of response patterns generally followed Mitscherlich-like (law of decreasing returns) or sigmoidal patterns but tended to plateau near 125–150 kg total N ha−1 except at sites #3 and #10 (Figure 6).
The yield models must be relevant to the “right” N rate more than the “righ”’ yield level. Simulations of grain yield by random forest and XGBoost fully agreed at sites #1 and #3 and paralleled each other at sites #2 and #4–9 (Figure 6). Parallel trajectories show similar slopes. At sites #3 and #10, actual yields were lower than predicted, and their patterns were chaotic. At site #3, there was evidence of large spatial variability among replicates that may require delineating further soil management zones. At site #10, actual yields were well below simulated yields, indicating a need for more local investigation on the yield-limiting features not included in the simulation. Features such as drainage, land levelling, slope, and compacted subsurface layer may have limited yield, but such features were insufficiently documented for inclusion in the ML models. Above 160 kg N ha−1 at site #10, XGBoost returned higher yields than the random forest. However, model structure would be very difficult to decipher due to the large number features selected to build decision trees.

4. Discussion

4.1. Model Accuracy

While field trials form the backbone of sound N management [12], it is assumed that all factors but the ones being varied are equal or adequate at the experimental site [46,47]. The ceteris paribus assumption does not hold at the step of assembling multi-environmental field trials due to highly variable site-specific features. According to the law of the optimum, production factors are used most efficiently if all combined at their optimum levels [70], a challenging management objective for growers. Growers most often make comparisons between areas growing normally or abnormally and try to set apart the yield-limiting features [47].
Sites showing comparable yield-impacting features can be assembled via category of similar features to guide fertilizer N recommendations [12]. Alternatively, ML models combine features to simulate crop response. In our study, model accuracy to predict maize yield reached 0.78–0.79, 1.89–1.31 Mg ha−1, and 0.96–0.98 Mg ha−1 for R2, RMSE, and MAE, respectively, for random forest, compared to 0.80–0.81, 1.31–1.35 Mg ha−1, and 0.91–0.92 Mg ha−1 for R2, RMSE, and MAE, respectively, for XGBoost. Random forest and XGBoost thus showed “substantial” performance for maize yield prediction [69]. In previous studies, the accuracy of XGBoost to predict grain yield was found to be R2 = 0.66–0.81 and RMSE = 0.92–1.68 Mg ha−1 [37,61,71]. In comparison, the accuracy (R2) of decision-tree models applied to healthcare and genomics ranged from 80 to 88% [72,73].
Some ex ante models used meteorological features collected from planting to 60 d after planting [61]. This is too long a period to predict split N rate at ≈ V6 (34 days after planting on average for the present study). There was thus great potential for the present ML models to predict split N rate from easy-to-collect features. The split N rate to apply at V6 can be computed by difference between the EONR and the N applied at seeding. Sensor data may further improve the understanding of seasonal weather conditions [61,74].
The prediction accuracy of EONR is generally lower than grain yield prediction. Previous studies reported R2 values of 0.36–0.86 and RMSE of 33–57 kg N ha−1 [18,37,71]. Indeed, the selected functions and their accuracies vary widely among sites [13] potentially injecting bias and errors [21]. Non-linear functions showing similar coefficients of determination (R2) may return contrasting EONRs due to slopes varying widely toward maximum yield [17,18,19,21,22]. The highest R2 values occur in the most responsive crop category, while the least responsive one returns the lowest R2 values. The R2 can decrease sharply by just deleting one N rate outside the near-optimal range. The number of points on the response pattern is limited to 3–7 in the present study but may reach 8 [13]. The response patterns comprised 10–13 as outcomes of our ML models (Figure 6). The large range of N rates can also assist growers to plan additional universality tests.

4.2. Economic and Environmental Costs of Nitrogen Fertilization

The EONR is reached where the marginal cost of fertilization corresponds to the marginal revenue [21]. The EONR depends not only on the choice of the response curve, the value of the grain crop, the cost of grain drying, and the cost of fertilization but also on environmental penalties related to NO3-N contamination [13] and nitrous oxide (N2O) emissions [75]. The trajectories of response patterns generally followed Mitscherlich-like (law of decreasing returns) or sigmoidal patterns that show positive slopes ad infinitum (Figure 6). While the EONR computed from the slope of the response curve was not expected to vary between models at a given site, “insurance extra N” applications against risk of yield loss can be constrained by economic and environmental penalties. Alternatively, quadratic-plateau and linear-plateau functions could constrain N application rates to the start of a plateau near 125-150 kg total N ha−1. The quadratic-plateau function, often selected over other functions [4,13], can set a limit to economic costs and environmental losses.
The NO3-N losses increase exponentially with applied N above EONR [13]. The environmental costs as NO3-N loss can be estimated by the prevention costs for conservation practices such as drainage water management, buffers, vegetative strips, erosion control, and cover crops [13]. The N2O has an environmental footprint of 265–298 times that of CO2 [75]. Averaged across sites in North America, the N2O emissions were found to be small where the N dosage was less than 110 kg N ha−1, and proportional to added N in the range of 110 to 200 kg N ha−1 [76]. The N2O emissions levelled off above 220 kg N ha−1, indicating that the soil denitrification capacity was saturated and nitrate contamination of groundwater and surface waters would contribute increasingly to the environmental damage. However, N2O emissions are known to vary widely with managerial, edaphic, and meteorological features [77,78,79,80,81,82].
The plateau of grain yield in our models started at N fertilizer rates of 125–150 kg total N ha−1, whereas the applied N rate in the regions frequently amounts to 200 kg mineral N ha−1. At sites #3 and #10, more investigation must be conducted to unravel the missing information apparently limiting maize yield. In comparison, the Adapt-N model recommended 53 and 31 kg N ha−1 less than grower rates for New York and Iowa states, with no statistically different yield [23].

4.3. Collaborative Research

In the present study, we conducted ten universality tests but far more are needed to fully capture the complexity of maize agroecosystems. The universality tests provide grower’s own assessment for his practice by comparison with practices documented in a large and diversified database. Soil and plant data used in this study were acquired using conventional methods. Because total N additions not exported in crop and livestock products rose by over 50% between 1996 and 2016 in Canada, management strategies should be tailored to site conditions to improve N use efficiencies and reduce N losses [83]. From the stakeholder viewpoint, precision agriculture technologies are unprecedented tools with which to update the maize database at low cost. Such technologies can improve nitrogen-use efficiency by delineating soil management zones using soil data (texture, organic matter, pH), seasonally sensing crop data, yield maps, or combining data [84,85,86]. This could potentially improve the modelling for site 3 and 10.
Stakeholders can hardly integrate numerous features simultaneously. To assist stakeholders in the decision process, ML models have the capacity to process several features simultaneously. Data need to be reliable, findable, accessible, interoperable, and retrievable to run models efficiently. In the present study, several features were categorical. While N credits are often assigned to previous crops to run models, values vary widely [13,76], injecting error in response models. Nevertheless, the N credits from previous crops grown on sites showing similar conditions are likely to be close. Likewise, organic fertilizers were documented as categories, assuming that the N requirements followed jurisdictional recommendations from N composition as well as the method and time of fertilizer application. Additional effort may be needed in order to quantify the actual N credits from previous crops and organic amendments. Progress in nutrient stewardship, management practices, irrigation, genetics, and pest control will prompt updating databases with additional features under climate change [70].

5. Conclusions

Crop response patterns were elaborated to guide evidence-based fertilization decisions. We elaborated ML models to address the complexity of N management in maize agroecosystems using easy-to-collect features. Grain yields, rather than EONRs were used as target variables by which to control biases and errors inherent in the selection of non-linear response functions. Response patterns were simulated by ML models across a wide range of N rates. In addition, compared to actual yields. Where the N rates applied by growers misses the N plateau, the predicted response patterns can help reformulate the N range to run future universality tests.
This study addressed agronomic, economic, and environmental issues of maize production systems by integrating several yield-impacted features to derive response patterns representative of site conditions. The decision on the right N rate to apply at V6 in growers’ fields can be assessed from simulated and actual response patterns. The response patterns tended to plateau at 125–150 kg total N ha−1. There is great potential to abate speculations on “insurance” extra N rates that lead to economic loss, potential nitrate leaching, and N2O emissions. For several universality tests, apparent economic and environmental gains of 50–75 kg total N ha−1 could be expected from model simulations compared to the frequently applied rate of 200 kg total N ha−1.

Author Contributions

Conceptualization, L.E.P. and G.D; methodology, L.E.P. and G.D.; software, L.E.P.; validation, L.E.P. and G.D.; formal analysis, L.E.P.; investigation, G.D.; resources, G.D.; data curation, L.E.P. and G.D.; writing—original draft preparation, L.E.P.; writing—review and editing, L.E.P. and G.D.; visualization, L.E.P. and G.D.; supervision, L.E.P. and G.D.; project administration, G.D.; funding acquisition, G.D. All authors have read and agreed to the published version of the manuscript.

Funding

The project received financial assistance from the Research and development of knowledge and decision support tools (Project no. 16-GES-11 and 19-2.2-11-PLEI), Quebec Ministry of Agriculture, Fisheries and Food, Quebec, QC, Canada.

Data Availability Statement

The database is unavailable due to privacy restrictions.

Acknowledgments

We thank the research organizations and the participating growers who contributed to the database. Thanks are extended to Serge-Étienne Parent, ecological engineer, who advised us on model implementation, Eric Thibault, senior agronomist, who documented the soil profiles, as well as Gilles Tremblay, Marc-Olivier Gasser, Aubert Michaud, and Catherine Tremblay, who shared their data on maize trials conducted before 2017.

Conflicts of Interest

The authors declare no conflict of interest. The funders had no role in the design of the study; in the collection, analyses, or interpretation of data; in the writing of the manuscript; or in the decision to publish the results.

References

  1. Mesbah, M.; Pattey, E.; Jégo, G.; Didier, A.; Geng, X.; Tremblay, N.; Zhang, F. New model-based insights for strategic nitrogen recommendations adapted to given soil and climate. Agron. Sustain. Dev. 2018, 38, 36. [Google Scholar] [CrossRef]
  2. Parent, L.E.; Gagné, G. Guide de Référence en Fertilisation, 2nd ed.; Centre de Référence en Agriculture et Agroalimentaire du Québec (CRAAQ): Québec, QC, Canada, 2010. (In French) [Google Scholar]
  3. Nyiraneza, J.; N’Dayegamiye, A.; Gasser, M.O.; Giroux, M.; Grenier, M.; Landry, C.P.; Guertin, S. Soil and crop parameters related to maize nitrogen response in Eastern Canada. Agron. J. 2010, 102, 1478–1490. [Google Scholar] [CrossRef]
  4. Kablan, L.A.; Chabot, V.; Mailloux, A.; Bouchard, M.-È.; Fontaine, D.; Bruulsema, T. Variability in maize response to nitrogen fertilizer in Eastern Canada. Agron. J. 2017, 109, 2231–2242. [Google Scholar] [CrossRef]
  5. Zebarth, B.J.; Drury, C.F.; Tremblay, N.; Cambouris, A.N. Opportunities for improved fertilizer nitrogen management in production of arable crops in eastern Canada: A review. Can. J. Soil Sci. 2009, 89, 113–132. [Google Scholar] [CrossRef]
  6. Stewart, B.A.; Lal, R. The nitrogen dilemma: Food or the environment. J. Soil. Water Conserv. 2017, 72, 124A–128A. [Google Scholar] [CrossRef]
  7. Shcherbak, I.; Millar, N.; Robertson, G.P. Global metaanalysis of the nonlinear response of soil nitrous oxide (N2O) emissions to fertilizer nitrogen. Proc. Natl. Acad. Sci. USA 2014, 111, 9199–9204. [Google Scholar] [CrossRef]
  8. Lawrence, N.C.; Tenesaca, C.G.; VanLoocke, A.; Hall, S.J. Nitrous oxide emissions from agricultural soils challenge climate sustainability in the US Maize Belt. Proc. Natl. Acad. Sci. USA 2021, 118, e2112108118. [Google Scholar] [CrossRef]
  9. Souza, E.F.C.; Rosen, C.J.; Venterea, R.T.; Tahir, M. Intended and unintended impacts of nitrogen-fixing microorganisms and microbial inhibitors on nitrogen losses in contrasting maize cropping systems. J. Environ. Qual. 2023, 52, 972–983. [Google Scholar] [CrossRef]
  10. Mandrini, G.; Archontoulis, S.V.; Pittelkow, C.M.; Mieno, T.; Martin, N.F. Simulated dataset of corn response to nitrogen over thousands of fields and multiple years in Illinois. Data Brief 2022, 40, 107753. [Google Scholar] [CrossRef]
  11. Hoben, J.P.; Gehl, R.J.; Millar, N.; Grace, P.R.; Robertson, G.P. Nonlinear nitrous oxide (N2O) response to nitrogen fertilizer in on-farm corn crops of the US Midwest. Glob. Change Biol. 2011, 17, 1140–1152. [Google Scholar] [CrossRef]
  12. Morris, T.F.; Murrell, T.S.; Beegle, D.B.; Camberato, J.J.; Ferguson, R.B.; Grove, J.; Ketterings, Q.; Kyveryga, P.M.; Laboski, C.A.M.; McGrath, J.M.; et al. Strengths and Limitations of Nitrogen Rate Recommendations for Maize and Opportunities for Improvement. Agron. J. 2017, 110, 1–37. [Google Scholar] [CrossRef]
  13. Ransom, C.J.; Kitchen, N.R.; Camberato, J.J.; Carter, P.R.; Ferguson, R.B.; Fernandez, F.G.; Franzen, D.W.; Laboski, C.A.M.; Myers, D.B.; Nafziger, E.D.; et al. Corn nitrogen rate recommendation tools’ performance across eight US midwest corn belt states. Agron. J. 2020, 112, 470–492. [Google Scholar] [CrossRef]
  14. Forest Lavoie Conseil. Competitivity of Quebec Grain Producers (AOI-2-19-S-124); Addendum to Final Report; Quebec Ministry of Agriculture, Fisheries and Food (MAPAQ): Quebec City, QC, Canada, 2020; p. 198. (In French) [Google Scholar]
  15. Mueller, S.M.; Vyn, T.J. Maize Plant Resilience to N Stress and Post-silking N Capacity Changes over Time: A Review. Front. Plant Sci. 2016, 7, 53. [Google Scholar] [CrossRef] [PubMed]
  16. Ciampitti, I.; Vyn, T.J. Understanding Global and Historical Nutrient Use Efficiencies for Closing Maize Yield Gaps. Agron. J. 2014, 106, 2107–2117. [Google Scholar] [CrossRef]
  17. Kyveryga, P.M.; Blackmer, T.M.; Caragea, P.C. Categorical Analysis of Spatial Variability in Economic Yield Response of Maize to Nitrogen Fertilization. Agron. J. 2011, 103, 796–804. [Google Scholar] [CrossRef]
  18. Kyveryga, P.M.; Blackmer, T.M.; Morris, T.F. Disaggregating Model Bias and Variability when Calculating Economic Optimum Rates of Nitrogen Fertilization for Maize. Agron. J. 2007, 99, 1048–1056. [Google Scholar] [CrossRef]
  19. Kyveryga, P.M.; Blackmer, A.M.; Morris, T.F. Alternative Benchmarks for Economically Optimal Rates of Nitrogen Fertilization for Corn. Agron. J. 2007, 99, 1057–1065. [Google Scholar] [CrossRef]
  20. Correndo, A.A.; Jose, L.; Rotundo, J.L.; Tremblay, N.; Archontoulis, S.; Coulter, J.A.; Ruiz-Diaz, D.; Franzen, D.; Franzluebbers, A.L.; Nafziger, E.; et al. Assessing the uncertainty of maize yield without nitrogen fertilization. Field Crops Res. 2021, 260, 107985. [Google Scholar] [CrossRef]
  21. Bachmaier, M. Sources of inaccuracy when estimating economically optimum N fertilizer rates. Agric. Sci. 2012, 3, 331–338. [Google Scholar] [CrossRef]
  22. Cerrato, M.E.; Blackmer, A.M. Comparison of models for describing maize yield response to nitrogen fertilizer. Agron. J. 1990, 82, 138–143. [Google Scholar] [CrossRef]
  23. Sela, S.; van Es, H.M.; Moebius-Clune, B.N.; Marjerison, R.; Melkonian, J.; Moebius-Clune, D.; Schindelbeck, R.; Gomes, S. Adapt-N Outperforms Grower-Selected Nitrogen Rates in Northeast and Midwestern United States Strip Trials. Agron. J. 2016, 108, 1726–1734. [Google Scholar] [CrossRef]
  24. Basford, K.E.; Federer, W.T.; Delacy, I.H. Mixed Model Formulations for Multi-Environment Trials. Agron. J. 2004, 96, 143–147. [Google Scholar]
  25. Tolhurst, D.J.; Gaynor, R.C.; Gardunia, B.; Hickey, J.M.; Gorjanc, G. Genomic selection using random regressions on known and latent environmental covariates. Theor. Appl. Genet. 2022, 135, 3393–3415. [Google Scholar] [CrossRef] [PubMed]
  26. Parent, S.-É.; Leblanc, M.A.; Parent, A.C.; Coulibali, Z.; Parent, L.E. Site-Specific Multilevel Modeling of Potato Response to Nitrogen Fertilization. Front. Environ. Sci. 2017, 5, 81. [Google Scholar] [CrossRef]
  27. Ransom, C.J.; Kitchen, N.R.; Camberato, J.J.; Carter, P.R.; Ferguson, R.B.; Fernandez, F.G.; Franzen, D.W.; Laboski, C.A.M.; Myers, D.B.; Nafziger, E.D.; et al. Statistical and machine learning methods evaluated for incorporating soil and weather into maize nitrogen recommendations. Comput. Electron. Agric. 2019, 164, 104872. [Google Scholar] [CrossRef]
  28. Coulibali, Z.; Cambouris, A.N.; Parent, S.-É. Site-specific machine learning predictive fertilization models for potato crops in Eastern Canada. PLoS ONE 2020, 15, e0230888. [Google Scholar] [CrossRef]
  29. Hahn, L.; Parent, L.E.; Paviani, A.C.; Feltrim, A.L.; Wamser, A.; Rozane, D.E.; Ender, M.M.; Grando, D.L.; Moura-Bueno, J.M.; Brunetto, G. Garlic (Allium sativum) feature-specific nutrient dosage based on using machine learning models. PLoS ONE 2022, 17, e0268516. [Google Scholar] [CrossRef]
  30. Hu, S.; Wang, Y.G.; Drovandi, C.; Cao, T. Predictions of machine learning with mixed-effects in analyzing longitudinal data under model misspecification. Stat. Methods Appl. 2023, 32, 681–711. [Google Scholar] [CrossRef]
  31. Petrazzini, B.O.; Naya, H.; Lopez-Bello, F.; Vazquez, G.; Spangenberg, L. Evaluation of different approaches for missing data imputation on features associated to genomic data. BioData Min. 2021, 14, 44. [Google Scholar] [CrossRef]
  32. Kokla, M.; Virtanen, I.; Kolehmainen, M.; Paananen, J.; Hanhineva, K. Random forest-based imputation outperforms other methods for imputing LC-MS metabolomics data: A comparative study. BMC Bioinform. 2019, 20, 492. [Google Scholar] [CrossRef]
  33. Sinclair, T.R.; Seligman, N. Criteria for publishing papers on crop modeling. Field Crops Res. 2000, 8, 165–172. [Google Scholar] [CrossRef]
  34. Westhues, C.C.; Simianer, H.; Beissinger, T.M. learnMET: An R package to apply machine learning methods for genomic prediction using multi-environment trials data. G3 2022, 12, jkac226. [Google Scholar] [CrossRef] [PubMed]
  35. Chlningaryan, A.; Sukkarieh, S.; Whelan, B. Machine learning approaches for crop yield prediction and nitrogen status estimation in precision agriculture: A review. Comput. Electron. Agric. 2018, 151, 61–69. [Google Scholar] [CrossRef]
  36. Huynh-Thu, V.A.; Geurts, P. Unsupervised Gene Network Inference with Decision Trees and Random Forests. In Gene Regulatory Networks; Methods in Molecular Biology; Sanguinetti, G., Huynh-Thu, V., Eds.; Humana Press: New York, NY, USA, 2019; Volume 1883. [Google Scholar] [CrossRef]
  37. Wang, X.; Miao, Y.; Dong, R.; Zha, H.; Xia, T.; Chen, Z.; Kusnierek, K.; Mi, G.; Sun, H.; Li, M. Machine learning-based in-season nitrogen status diagnosis and side-dress nitrogen recommendation for maize. Eur. J. Agron. 2021, 123, 126193. [Google Scholar] [CrossRef]
  38. Qin, Z.; Myers, D.B.; Ransom, C.J.; Kitchen, N.R.; Liang, S.Z.; Camberato, J.J.; Carter, P.R.; Ferguson, R.B.; Fernandez, F.G.; Franzen, D.W.; et al. Application of Machine Learning Methodologies for Predicting Maize Economic Optimal Nitrogen Rate. Agron. J. 2018, 110, 2596–2607. [Google Scholar] [CrossRef]
  39. Shahhosseini, M.; Hu, G.; Huber, I.; Archontoulis, S.V. Coupling machine learning and crop modeling improves crop yield prediction in the US Maize Belt. Sci. Rep. 2021, 11, 1606. [Google Scholar] [CrossRef]
  40. Ziadi, N.; Cambouris, A.N.; Nyraneza, J.; Nolin, M.C. Across a landscape, soil texture controls the optimum rate of N fertilizer for maize production. Field Crops Res. 2013, 148, 78–85. [Google Scholar] [CrossRef]
  41. Tremblay, N.; Bouroubi, Y.M.; Belec, C.; Mullen, R.W.; Kitchen, N.R.; Thomason, W.E.; Ebelhar, S.; Mengel, D.B.; Raun, W.R.; Francis, D.D.; et al. Maize response to nitrogen is influenced by soil texture and weather. Agron. J. 2012, 104, 1658–1671. [Google Scholar] [CrossRef]
  42. Cambouris, A.N.; Ziadi, N.; Perron, I.; Alotaibi, K.D.; St. Luce, M.; Tremblay, N. Maize yield components response to nitrogen fertilizer as a function of soil texture. Can. J. Soil Sci. 2016, 96, 386–399. [Google Scholar] [CrossRef]
  43. Anderson, C.J.; Kyveyga, P.M. Combining on-farm and climate data for risk management of nitrogen decisions. Clim. Risk Manag. 2016, 13, 10–18. [Google Scholar] [CrossRef]
  44. Alotaibi, K.D.; Cambouris, A.N.; St. Luce, M.; Ziadi, N.; Tremblay, N. Economic Optimum Nitrogen Fertilizer Rate and Residual Soil Nitrate as Influenced by Soil Texture in Maize Production. Agron. J. 2018, 110, 2233–2242. [Google Scholar] [CrossRef]
  45. Parent, S.É.; Dossou-Yovo, W.; Ziadi, N.; Leblanc, M.; Tremblay, G.; Pellerin, A.; Parent, L.E. Corn response to banded phosphorus fertilizers with or without manure application in Eastern Canada. Agron. J. 2020, 112, 2176–2187. [Google Scholar] [CrossRef]
  46. De Wit, C.T. Resource use efficiency in agriculture. Agric. Syst. 1992, 40, 125–151. [Google Scholar] [CrossRef]
  47. Munson, R.D.; Nelson, W.L. Principles and practices in plant analysis. In Soil Testing and Plant Analysis, 3rd ed.; Westerman, R.L., Ed.; Book Series #3; Soil Science Society of America Inc.: Madison, WI, USA, 1990; pp. 359–387. [Google Scholar]
  48. Government of Quebec. Improve Soil Health and Soil Conservation. Available online: https://cdn-contenu.quebec.ca/cdn-contenu/adm/min/agriculture-pecheries-alimentation/politique-bioalimentaire/agriculture-durable/FI_agriculturedurable_indicateur_sol_MAPAQ.pdf (accessed on 5 May 2023)In French.
  49. Norton, J.; Ouyang, Y. Controls and Adaptive Management of Nitrification in Agricultural Soils. Front. Microbiol. 2019, 10, 1931. [Google Scholar] [CrossRef]
  50. Lengwick, L.L. Spatial variability of early season nitrogen availability indicators in corn. Commun. Soil Sci. Plant Anal. 1997, 28, 1271–1736. [Google Scholar]
  51. Gülser, C.; Ekberli, I.; Candemir, F.; Demir, Z. Spatial variability of soil physical properties in a cultivated field. Eurasian J. Soil Sci. 2016, 5, 192–200. [Google Scholar] [CrossRef]
  52. Magdoff, F. Understanding the Magdoff Pre-Sidedress Nitrate Test for Maize. J. Prod. Agric. 1991, 4, 297–305. [Google Scholar] [CrossRef]
  53. Mukherjee, A.; Lal, R. Comparison of Soil Quality Index Using Three Methods. PLoS ONE 2014, 9, e105981. [Google Scholar] [CrossRef]
  54. Reichert, J.M.; Susuki, L.E.A.S.; Reinert, D.J.; Horn, R.; Hakansson, I. Reference bulk density and critical degree-of-compactness for no-till crop production in a subtropical highly weathered soil. Soil Tillage Res. 2009, 102, 242–254. [Google Scholar] [CrossRef]
  55. Horn, R. Time dependence of soil mechanical properties and pore functions for arable soils. Soil Sci. Soc. Am. J. 2004, 68, 1131–1137. [Google Scholar] [CrossRef]
  56. Stewart, G.A.; Vyn, T.J. Influence of high axle loads and tillage systems on soil properties and grain maize yield. Soil Tillage Res. 1994, 29, 229–235. [Google Scholar] [CrossRef]
  57. Tabi, M.; Tardif, L.; Carrier, D.; Laflamme, G.; Rompré, M. Survey of Soil Degradation Problems in Quebec; Report Synthesis 90-130156; MAPAQ: Québec City, QC, Canada, 1990; ISBN 2-550-211161-8. (In French) [Google Scholar]
  58. Xu, Y.; Jimenez, M.A.; Parent, S.-É.; Leblanc, M.; Ziadi, N.; Parent, L.E. Compaction of Coarse-Textured Soils: Balance Models across Mineral and Organic Compositions. Front. Ecol. Evol. 2017, 5, 83. [Google Scholar] [CrossRef]
  59. Håkansson, I.; Lipiec, J. A review of the usefulness of relative bulk density values in studies of soil structure and compaction. Soil Tillage Res. 2000, 53, 71–85. [Google Scholar] [CrossRef]
  60. Abu-Hamdeh, N.H. Compaction and subsoiling effects on maize growth and soil bulk density. Soil Sci. Soc. Am. 2003, 67, 1213–1219. [Google Scholar] [CrossRef]
  61. Correndo, A.A.; Tremblay, N.; Coulter, J.A.; Ruiz-Diaz, D.; Franzen, D.; Nafziger, E.; Prasad, V.; Moro Rosso, L.H.; Steinke, K.; Du, J.; et al. Unraveling uncertainty drivers of the maize yield response to nitrogen: A Bayesian and machine learning approach. Agric. For. Meteorol. 2021, 311, 108668. [Google Scholar] [CrossRef]
  62. Van Roekel, R.J.; Coulter, J.A. Agronomic response of corn to planting date and plant density. Agron. J. 2011, 103, 1414. [Google Scholar] [CrossRef]
  63. Aitchison, J. Principles of compositional data analysis. Multivar. Anal. Its Appl. IMS Lect. Notes Monogr. Ser. 1994, 24, 73–81. [Google Scholar]
  64. Aitchison, J. The Statistical Analysis of Compositional Data; Chapman and Hall: London, UK, 1986. [Google Scholar]
  65. Egozcue, J.J.; Pawlowsky-Glahn, V. Groups of parts and their balances in compositional data analysis. Math. Geol. 2005, 37, 795–828. [Google Scholar] [CrossRef]
  66. Leblanc, M.A.; Gagné, G.; Parent, L.E. Numerical clustering of soil series using profile morphological attributes for potato. In Digital Soil Morphometrics; Hartemink, A.E., Minasny, B., Eds.; Springer: New York, NY, USA, 2016; pp. 253–266. [Google Scholar] [CrossRef]
  67. Padarian, J.; Minasny, B.; McBratney, A.B. Machine learning and soil sciences: A review aided by machine learning tools. SOIL 2020, 6, 35–52. [Google Scholar] [CrossRef]
  68. Robnik- Šikonja, M.; Kononenko, I. Theoretical and Empirical Analysis of ReliefF and RReliefF. Mach. Learn. J. 2003, 53, 23–69. [Google Scholar] [CrossRef]
  69. Ravelojaona, N.; Jégo, G.; Ziadi, N.; Mollier, A.; Lafond, J.; Karam, A.; Morel, C. STICS Soil–Crop Model Performance for Predicting Biomass and Nitrogen Status of Spring Barley Cropped for 31 Years in a Gleysolic Soil from Northeastern Quebec (Canada). Agronomy 2023, 13, 2540. [Google Scholar] [CrossRef]
  70. Wallace, A.; Wallace, G.A. Limiting factors, high yields, and law of the maximum. Hortic. Rev. 1993, 13, 409–441. [Google Scholar]
  71. Gao, J.; Zeng, W.; Ren, Z.; Ao, C.; Lei, G.; Gaiser, T.; Srivastava, A.K. A Fertilization Decision Model for Maize, Rice, and Soybean Based on Machine Learning and Swarm Intelligent Search Algorithms. Agronomy 2023, 13, 1400. [Google Scholar] [CrossRef]
  72. An, Q.; Rahman, S.; Zhou, J.; Kang, J.J. A Comprehensive Review on Machine Learning in Healthcare Industry: Classification, Restrictions, Opportunities and Challenges. Sensors 2023, 23, 4178. [Google Scholar] [CrossRef] [PubMed]
  73. Monaco, A.; Pantaleo, E.; Amoroso, N.; Lcalamita, A.; Lo Guidice, C.; Fonzoni, A.; Fosso, B.; Picardi, E.; Tangaro, S.; Pesole, G.; et al. A primer on machine learning techniques for genomic applications. Comput. Struct. Biotechnol. J. 2021, 19, 4345–4359. [Google Scholar] [CrossRef] [PubMed]
  74. Cerro, J.; Cruz Ulloa, C.; Barrientos, A.; León Rivas, J. Unmanned Aerial Vehicles in Agriculture: A Survey. Agronomy 2021, 11, 203. [Google Scholar] [CrossRef]
  75. Government of Canada. Update of the Pan-Canadian Approach to Carbon Pollution Pricing. 2023–2030. Available online: https://www.canada.ca/en/environment-climate-change/services/climate-change/pricing-pollution-how-it-will-work/carbon-pollution-pricing-federal-benchmark-information/federal-benchmark-2023-2030.html (accessed on 22 April 2023).
  76. Omonode, R.A.; Halvorson, A.D.; Gagnon, B.; Vyn, T.J. Achieving Lower Nitrogen Balance and Higher Nitrogen Recovery Efficiency Reduces Nitrous Oxide Emissions in North America’s Maize Cropping Systems. Front. Plant Sci. 2017, 8, 1080. [Google Scholar] [CrossRef] [PubMed]
  77. Mackenzie, A.F.; Fan, M.X.; Cadrin, F. Nitrous Oxide Emission in Three Years as Affected by Tillage, Maize-Soybean-Alfalfa Rotations, and Nitrogen Fertilization. J. Environ. Qual. 1998, 27, 698–703. [Google Scholar] [CrossRef]
  78. Drury, C.F.; Yang, X.M.; Reynolds, W.D.; McLaughlin, N.B. Nitrous oxide and carbon dioxide emissions from monoculture and rotational cropping of maize, soybean and winter wheat. Can. J. Soil Sci. 2008, 88, 163–174. [Google Scholar] [CrossRef]
  79. Roy, A.K.; Wagner-Riddle, C.; Deen, B.; Lauzon, J.; Bruulsema, T. Nitrogen application rate, timing and history effects on nitrous oxide emissions from maize (Zea mays L.). Can. J. Soil Sci. 2014, 94, 563–573. [Google Scholar] [CrossRef]
  80. Pelster, D.E.; Larouche, F.; Rochette, P.; Chantigny, M.H.; Allaire, S.; Angers, D.A. Nitrogen fertilization but not soil tillage affects nitrous oxide emissions from a clay loam soil under a maize–soybean rotation. Soil Tillage Res. 2011, 115–116, 16–26. [Google Scholar] [CrossRef]
  81. Rochette, P.; Worth, D.E.; Lemke, R.L.; McConkey, B.G.; Pennock, D.J.; Wagner-Riddle, C.; Desjardins, R.L. Estimation of N2O emissions from agricultural soils in Canada. I. Development of a country-specific methodology. Can. J. Soil Sci. 2008, 88, 641–654. [Google Scholar] [CrossRef]
  82. Pelster, D.E.; Thiagarajan, A.; Liang, C.; Chantigny, M.H.; Wagner-riddle, C.; Lemke, R.; Glenn, A.; Tenuta, M.; Hernandez-Ramirez, G.; Bittman, S.; et al. Ratio of non-growing season to growing season N2O emissions in Canadian croplands: An update to national inventory methodology. Can. J. Soil Sci. 2023, 103, 344–352. [Google Scholar] [CrossRef]
  83. Karimi, R.; Pogue, S.J.; Kröbela, R.; Beauchemin, K.A.; Schwinghamera, T.H.; Janzen, H.H. An updated nitrogen budget for Canadian agroecosystems. Agric. Ecosyst. Environ. 2020, 304, 107046. [Google Scholar] [CrossRef]
  84. Cambouris, A.N.; Nolin, M.C.; Zebarth, B.J.; Laverdiere, M.R. Soil Management Zones Delineated by Electrical Conductivity to Characterize Spatial and Temporal Variations in Potato Yield and in Soil Properties. Am. J. Potato Res. 2006, 83, 381–395. [Google Scholar] [CrossRef]
  85. Lang, V.; Tóth, G.; Dafnaki, D.; Csenki, S. Comparison and validation of different soil survey techniques to support a precision agricultural system. In Proceedings of the 15th International Conference on Precision Agriculture, Minneapolis, MN, USA, 26–29 June 2022. [Google Scholar]
  86. Cordero, E.; Longchamps, L.; Khosla, R.; Sacco, D. Spatial management strategies for nitrogen in maize production based on soil and crop data. Sci. Total Environ. 2019, 697, 133854. [Google Scholar] [CrossRef]
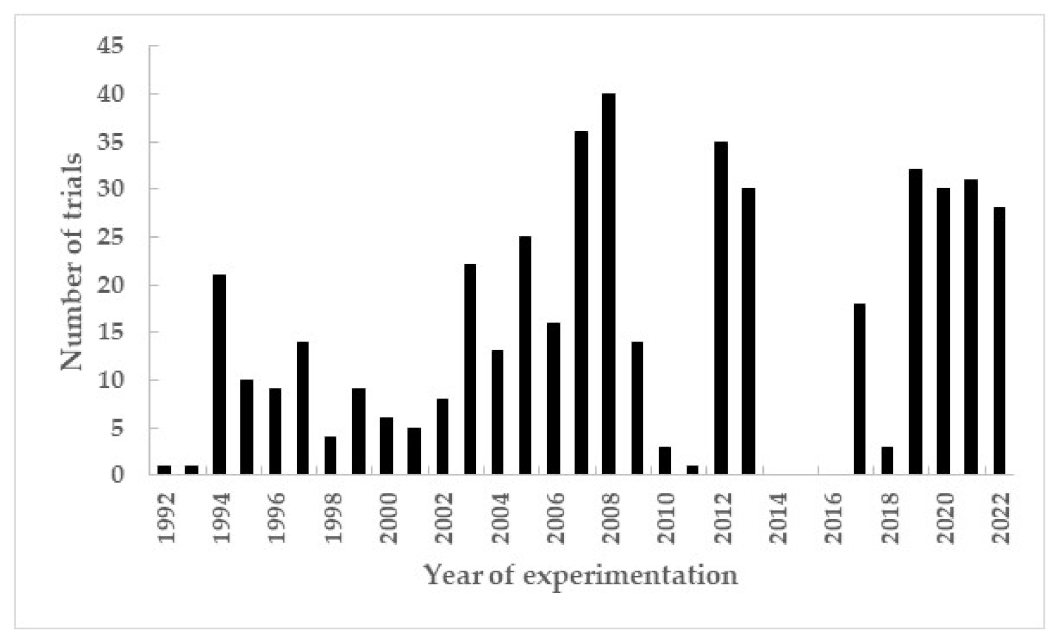
Figure 1. Number of maize N trials conducted yearly between 1992 and 2022 in Quebec, Canada.
Nitrogen 04 00024 g001
Figure 2. Variations in meteorological conditions during the 1992–2022 period in the Quebec (Canada) maize production area.
Nitrogen 04 00024 g002
Figure 3. Balance designs for soil texture (left side) and fuzzy scores (right side). The m3a, m3b, and m3c are fuzzy scores reflecting the degree of membership of the soil series to the podzolic or gleyic genetic soil classes.
Nitrogen 04 00024 g003
Figure 4. RReliefF values ranking the relative importance of maize yield predictors.
Nitrogen 04 00024 g004
Figure 5. Relationship between actual and predicted grain yields (15.5% moisture content) using N dosage, pre-split-N precipitations, pre-split-N CHU, previous crop, tillage practice, soil texture, soil organic matter content, soil pH, soil series, organic amendments (yes/no), and seeding date as features. See Table 1 for statistics.
Nitrogen 04 00024 g005
Figure 6. Universality tests for maize response patterns to added N simulated by random forest and XGBoost. See Table 3 for the lists of predictors. For RF, RMSE = 1.288 and MAE = 0.960. For XGBoost, RMSE = 1.231 and MAE = 0.925.
Nitrogen 04 00024 g006aNitrogen 04 00024 g006b
Table 1. Documented variables in the Quebec maize database.
VariableUnitMeasureMin.MedianMax.
Grain yieldMg ha−115.5% moisture content 0.110.417.9
Year-Year of experimentation
LatitudedecimalField or municipality45.00045.39646.677
LongitudedecimalField or municipality −75.381−73.304−71.067
Corn Heat UnitsCHU 1.8 × T m i n 4 + 3.33 × T m a x 10 0.084 × T m a x 10 2 / 2   where T m i n is minimum daily temperature and T m a x is maximum daily temperature for 28 weeks starting 15 April
Precipitationsmm28-week records starting 15 April
Previous cropcategorySeven categories as follows: maize, soybean-pea-bean, non-legume annuals other than small grains, small grains, meadow, legume perennials (clover, alfalfa, lupin), fallow ---
Tillage practicecategoryConventional, reduced tillage, no-till ---
Seeding datejulian dayProject113131158
Split N application datejulian dayProject135169190
Harvest datejulian dayProject266294319
N fertilization at seedingkg N ha−1Project05087
Split N fertilizationkg N ha−1Project0100308
Total N fertilizationkg N ha−1N applied at seeding and as split application0150365
PSNT (0–30 cm)mg NO3-N kg−1Nitrate test in the 0–30 cm layer at pre-side-dress quantified by ion chromatography21070
Sand%Sedimentation method03196
Silt %Sedimentation method 33588
Clay %Sedimentation method 02575
Genetic score m.3afuzzy scoreTrend toward podzolization from soil series characteristics0.0000340.0179820.999833
m.3bfuzzy scoreIntermediate trend from soil series characteristics0.0001140.4943610. 999753
m.3cfuzzy scoreTrend toward gleization from soil series characteristics0.0000340.2158940.999853
Bulk density 0–15 cmg cm−3Cylinder method0.521.351.83
Bulk density 15–30 cmg cm−3Cylinder method 0.561.431.76
Bulk density 30–45 cmg cm−3Cylinder method 0.351.451.80
pH in water-pHwater and SMP buffer pH 5.06.57.9
Soil nutrientsmg cm−3 or mg kg−1Mehlich-3-extracted nutrients followed by ICP quantification
Organic matter%Dumas combustion, Walkley–Black oxidation, loss on ignition 1.13.650.3
Table 2. Accuracy of random forest and XGBoost to estimate maize yield from the selected predictors.
Scenarios of PredictorsRandom ForestXGBoost
R2RMSEMAER2RMSEMAE
Mg ha−1 Mg ha−1
  • Previous crop, tillage practice, soil texture, soil organic matter content, soil pH, fuzzy scores, organic amendments, seeding date, N dosage
0.7291.4531.0910.7911.2770.952
2.
Precipitations, CHU, previous crop, tillage practice, soil texture, soil organic matter content, soil pH, fuzzy scores, organic amendments, seeding date, N dosage, PSNT, soil bulk density
0.7811.3090.9720.8021.2460.925
3.
Precipitations, CHU, previous crop, tillage practice, soil texture, soil organic matter content, soil pH, fuzzy scores, organic amendments, seeding date, N dosage
0.7871.2880.9600.8051.2310.918
4.
Pre-split-N precipitations (10 week) , pre-split-N CHU (10 week), previous crop, tillage practice, soil texture, soil pH, fuzzy scores, organic amendments, seeding date, N dosage
0.7791.3140.9790.8001.2490.927
Number of weeks starting 15 April. R2 = regression coefficient for the relationship between predicted and actual yields; RMSE = root mean square error; MAE = mean absolute error.
Table 3. Features collected at ten sites where universality tests have been conducted without organic amendment.
FeatureSite No. 1Site No. 2Site No. 3Site No. 4Site No. 5Site No. 6Site No. 7Site No. 8Site No. 9Site No. 10
Year of trial2017201720171994199419941997200620072006
Tillage classNo tillNo tillReduced tillageConventionalConventionalConventionalConventionalNo tillConventionalConventional
Previous cropSoybeanSoybeanSoybeanMaizeMaizeWheatSoybean-Soybean-
Seeding date (Julian day)-138145---138138134132
Soil textureSandy clay loamSilty claySilty clay loamSilty claySilty claySilty clayClayClay-Silty clay
Soil seriesBoitreauxProvidence-ProvidenceSt-MarcelSt-Marcel---Providence
Soil pH6.456.70-6.205.906.40---6.72
% organic matter3.22.7-4.04.14.0---5.9
N rate (kg N ha−1)176, 18899, 129, 159, 18964, 114, 214, 264126, 159, 179, 206122, 140, 162, 183122, 140, 162, 183120, 160, 200, 240120, 160, 200, 24043, 85, 128, 170, 21380, 120, 160, 200, 240
Replicates3331111111
Disclaimer/Publisher’s Note: The statements, opinions and data contained in all publications are solely those of the individual author(s) and contributor(s) and not of MDPI and/or the editor(s). MDPI and/or the editor(s) disclaim responsibility for any injury to people or property resulting from any ideas, methods, instructions or products referred to in the content.