Article

Three-Dimensional Flow Simulation by a Hybrid Two-Phase Solver for the Assessment of Liquid/Gas Transport in a Volute-Type Centrifugal Pump with Twisted Blades †

1
Chair of Hydraulic Fluid Machinery, Ruhr University Bochum, Universitätsstr. 150, 44801 Bochum, Germany
2
Department of Mechanical Power Engineering, Faculty of Engineering—Mattaria, Helwan University, Cairo 11718, Egypt
3
Laboratory of Fluid Dynamics & Technical Flows, University of Magdeburg “Otto Von Guericke”, 39106 Magdeburg, Germany
*
Author to whom correspondence should be addressed.
This paper has also been published in the Proceedings of 15th European Turbomachinery Conference, Budapest, Hungary, 24–28 April 2023.
Int. J. Turbomach. Propuls. Power 2023, 8(3), 28; https://doi.org/10.3390/ijtpp8030028
Submission received: 12 June 2023 / Revised: 16 June 2023 / Accepted: 1 August 2023 / Published: 30 August 2023

Abstract

:
A hybrid two-phase flow solver is proposed, based on an Euler–Euler two-fluid model with continuous blending of a Volume-of-Fluid method when phase interfaces of coherent gas pockets are to be resolved. In a preceding study on a two-dimensional bladed research pump with reduced rotational speed, the transition from bubbly flow to coherent steady gas pockets observed in optical experiments with liquid/gas flow could be well captured by the hybrid solver. In the present study, the experiments and solver validation are extended to an industrial-scale centrifugal pump with twisted three-dimensional blades and elevated design rotational speed. The solver is combined with a population balance model, and a scale-adaptive turbulence model is employed. Compared to the two-dimensional bladed pump, the transition from agglomerated bubbles flow to attached gas pockets is shifted to larger gas loading, which is well captured by the simulation. The pump head drop with increasing gas load is also reproduced, showing the hybrid solver’s validity for realistic pump operation conditions.

1. Introduction

Radial volute-type centrifugal pumps are frequently required in industrial processes to transport multi-phase flows consisting of liquid and non-condensable gas. However, they are usually designed to convey pure liquids and, hence, even a small load of gas, i.e., an inlet gas volume fraction ε 3 % [1], may cause a considerable disturbance in conveying. In the worst case, even a full breakdown of the pump head may occur [2], and flow instabilities may destroy the pump’s components.
The resolution of experimental measurements is inherently limited [3,4]. As pointed out by, for example, Yin et al. [5] and De Santis et al. [6], computational fluid dynamics (CFD) simulation of liquid/gas flow provides a high amount of local flow information and may complement experimental results. In a preceding study [7], we presented a hybrid two-phase (H2P) solver for the 3D simulation of a water/air pump flow. A transparent research pump with a 2D cylindrical blade design facilitated detailed optical accessibility and a unique validation database. However, the impeller speed was reduced to n = 650 min 1 to protect the damageable transparent impeller material. It was shown that the transition of flow morphology from dispersed bubbly to segregated pocket flow was captured by the H2P solver. In the current study, the experiments and H2P solver validation are extended to an industrial-scale volute-type centrifugal pump with twisted 3D blades and a design rotational speed n = 1450 min 1 , which is considerably higher than the corresponding design speed of the 2D bladed pump used by Hundshagen et al. [7].
Experimental validation data is essential for assessing CFD models, and optical data of the two-phase flow field offer a sound validation basis. For example, Stel et al. [8,9], He et al. [10], Zhang et al. [11], Parikh et al. [12] and, also, the present authors [7] used optical measurement data to access the prediction of gas distribution within 2D bladed impellers in CFD studies. Recent high-speed imaging experiments [1,13,14,15,16,17,18] confirmed the existence of gas pockets inside the pump impeller channels, which block a part of the blade channel, making the flow guidance inefficient and causing the head drop. Based on optical measurements, together with the head drop characteristics, several authors [1,8,13,14,15,19,20,21,22,23,24] provided performance maps of the conveyance of a mixture. Subject to the volumetric flow rate and the inlet gas volume fraction, some of the present authors [1,13,14,15] observed a transition from bubbly flow to steady gas accumulation in the blade channel and introduced a categorization in terms of flow regime maps. Experimental studies by Mansour et al. [1,13,14,15], and the corresponding simulations with the H2P solver by Hundshagen et al. [7], were, however, confined to a 2D bladed impeller at reduced speed, as mentioned above. In studies where 3D twisted blades were used, the assessment of CFD models was restricted to integral pump characteristics, such as those of the pump head, or inner efficiency [25,26]. In this study, optical measurements of a 3D bladed impeller, having an elevated design speed, were performed and used for the validation of the H2P solver, which is a major novelty of this study.
The optical experimental results provided by Mansour et al. [15] and Parikh et al. [12] also pointed out that there is a significant size variation of gas bubbles within the pump. Chen et al. [27] even concluded that coalescence is one of the primary mechanisms for the formation of gas pockets. Inspired by the observations made in experiments, the H2P solver is extended by a population balance model (PBM) to take into account bubble polydispersity, which is a further novelty of this study. The class method of Lo [28] is adopted, together with coalescence and breakup models.
A high unsteadiness of particular void regions was observed in experiments by Mansour et al. [15] and Liao et al. [29], which is also confirmed by an inspection of video sequences in this study. Alternating unsteady pockets are present in the transition zone between bubbly and pocket flow regime. Even inherently steady adherent void regions in the pocket flow regime show an unsteady wake [7]. Statistical turbulence models may be inappropriate to resolve the highly unsteady flow regions observed in experiments, so that a turbulence-scale resolving approach is preferred. The scale-adaptive simulation (SAS) approach of Egorov & Menter [30], together with the hybrid H2P solver, has already been applied in our preceding study [7]. The SAS treatment of turbulence is also adopted in this study. The liquid/gas flow is investigated in terms of a water/air system in the following. This manuscript corresponds to our paper published in the proceedings of the 15th European Turbomachinery Conference [31].

2. Experiments

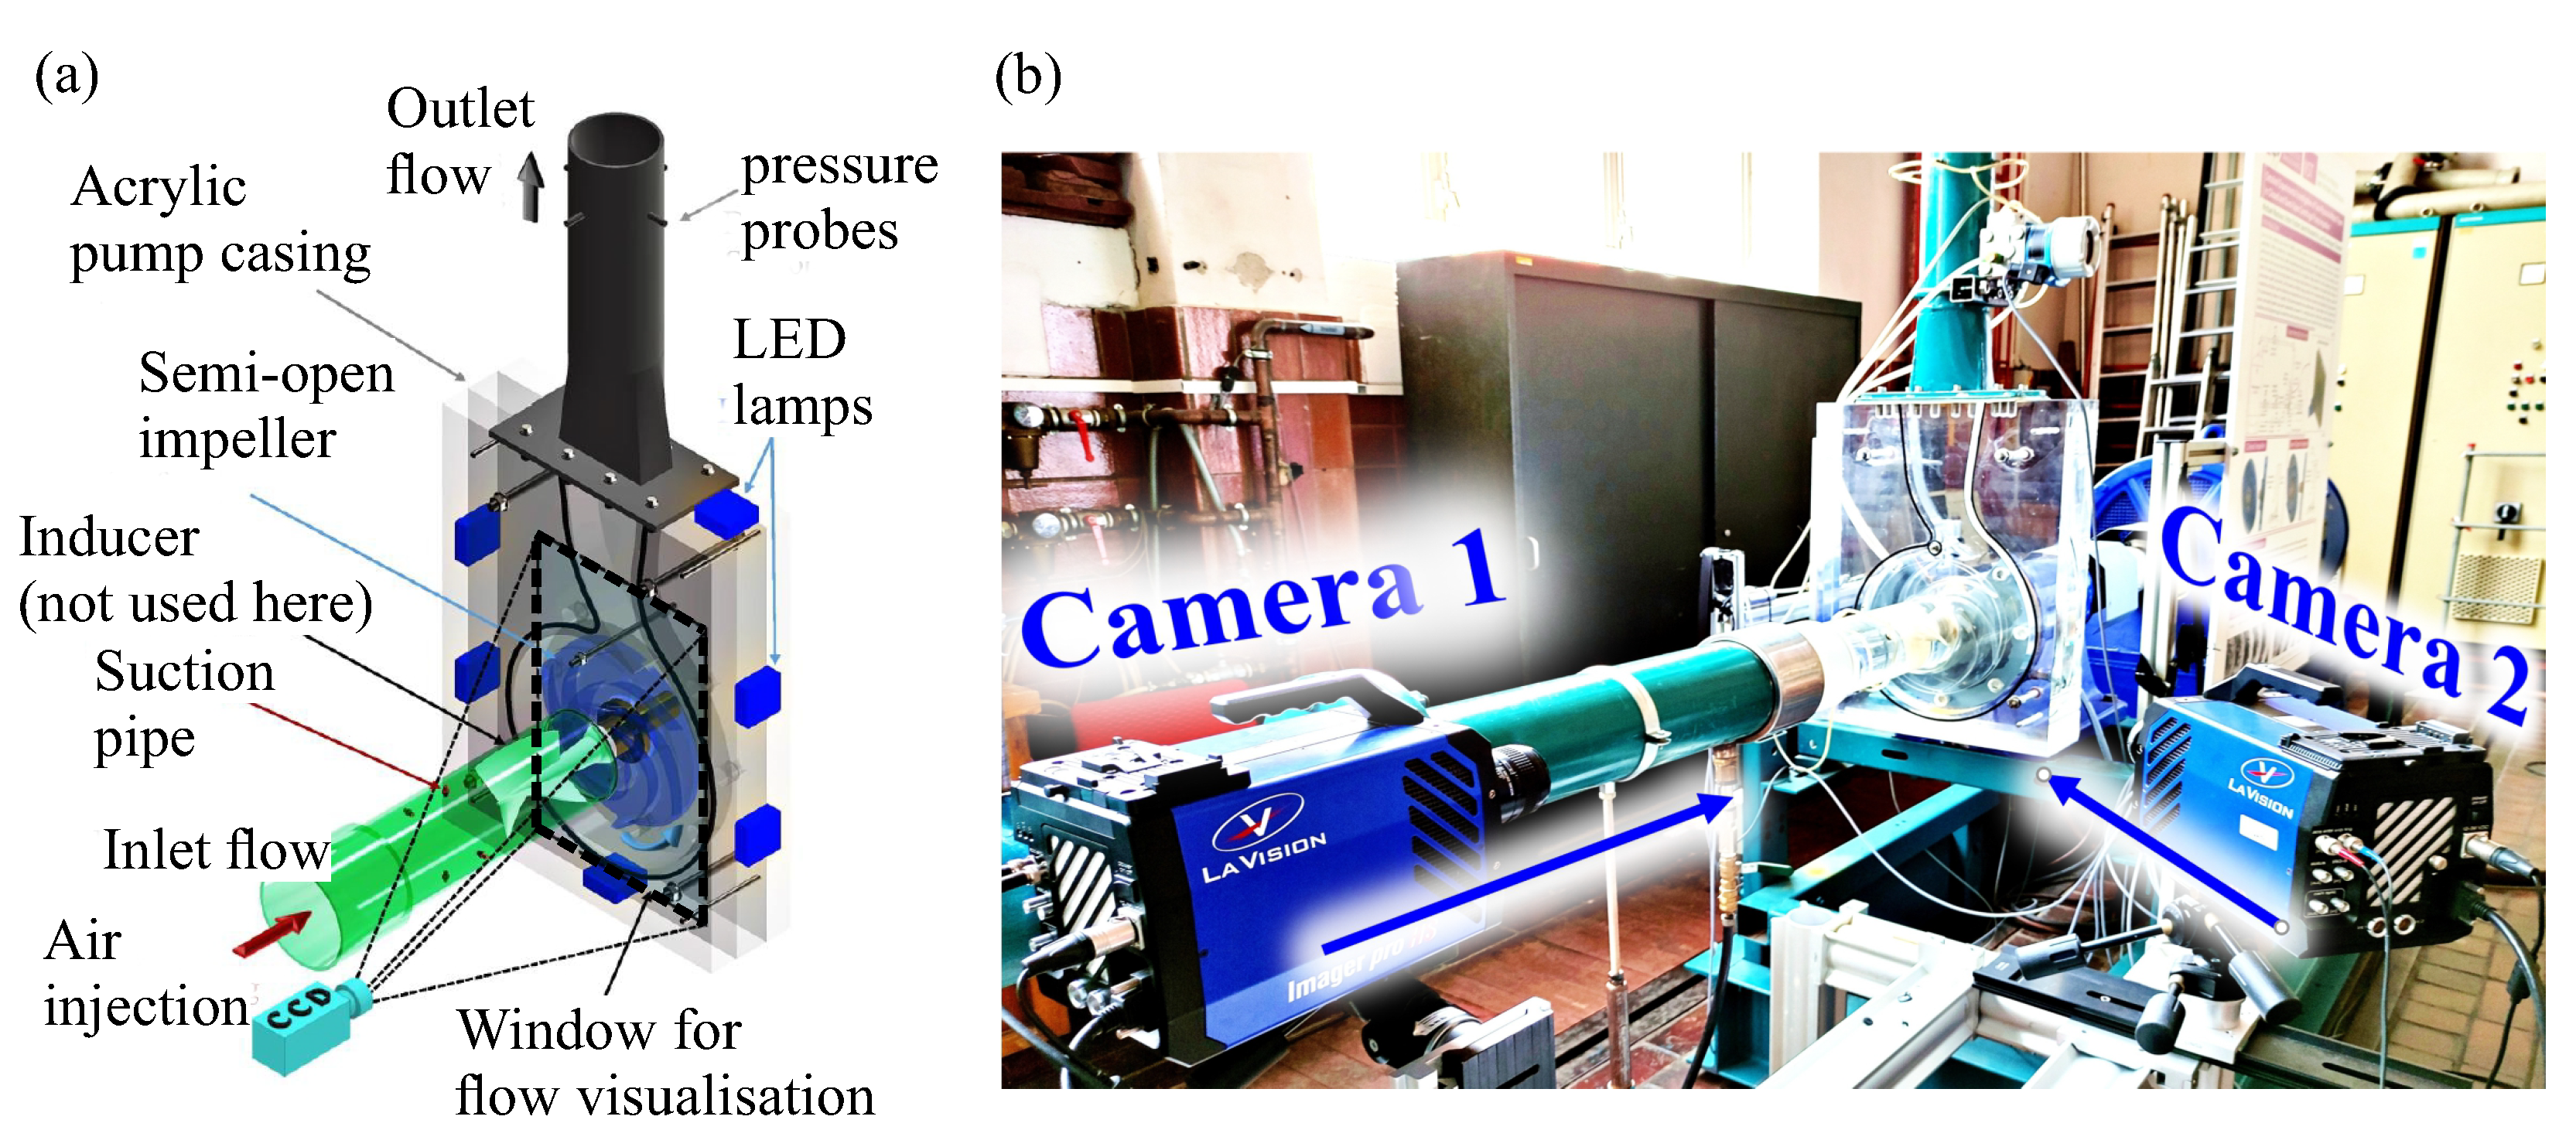
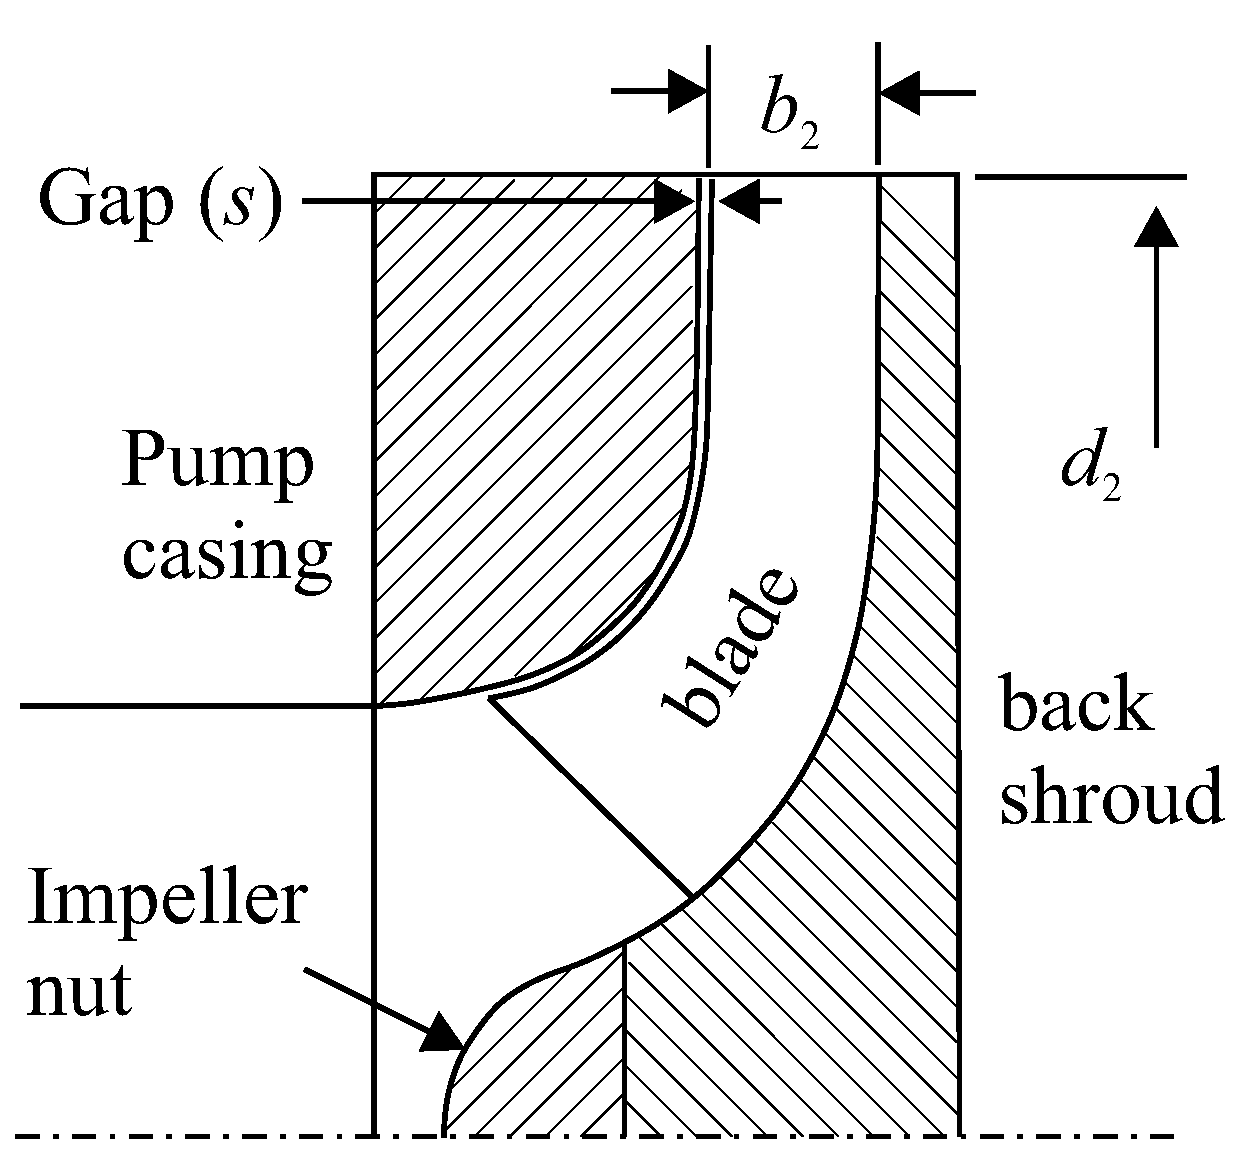
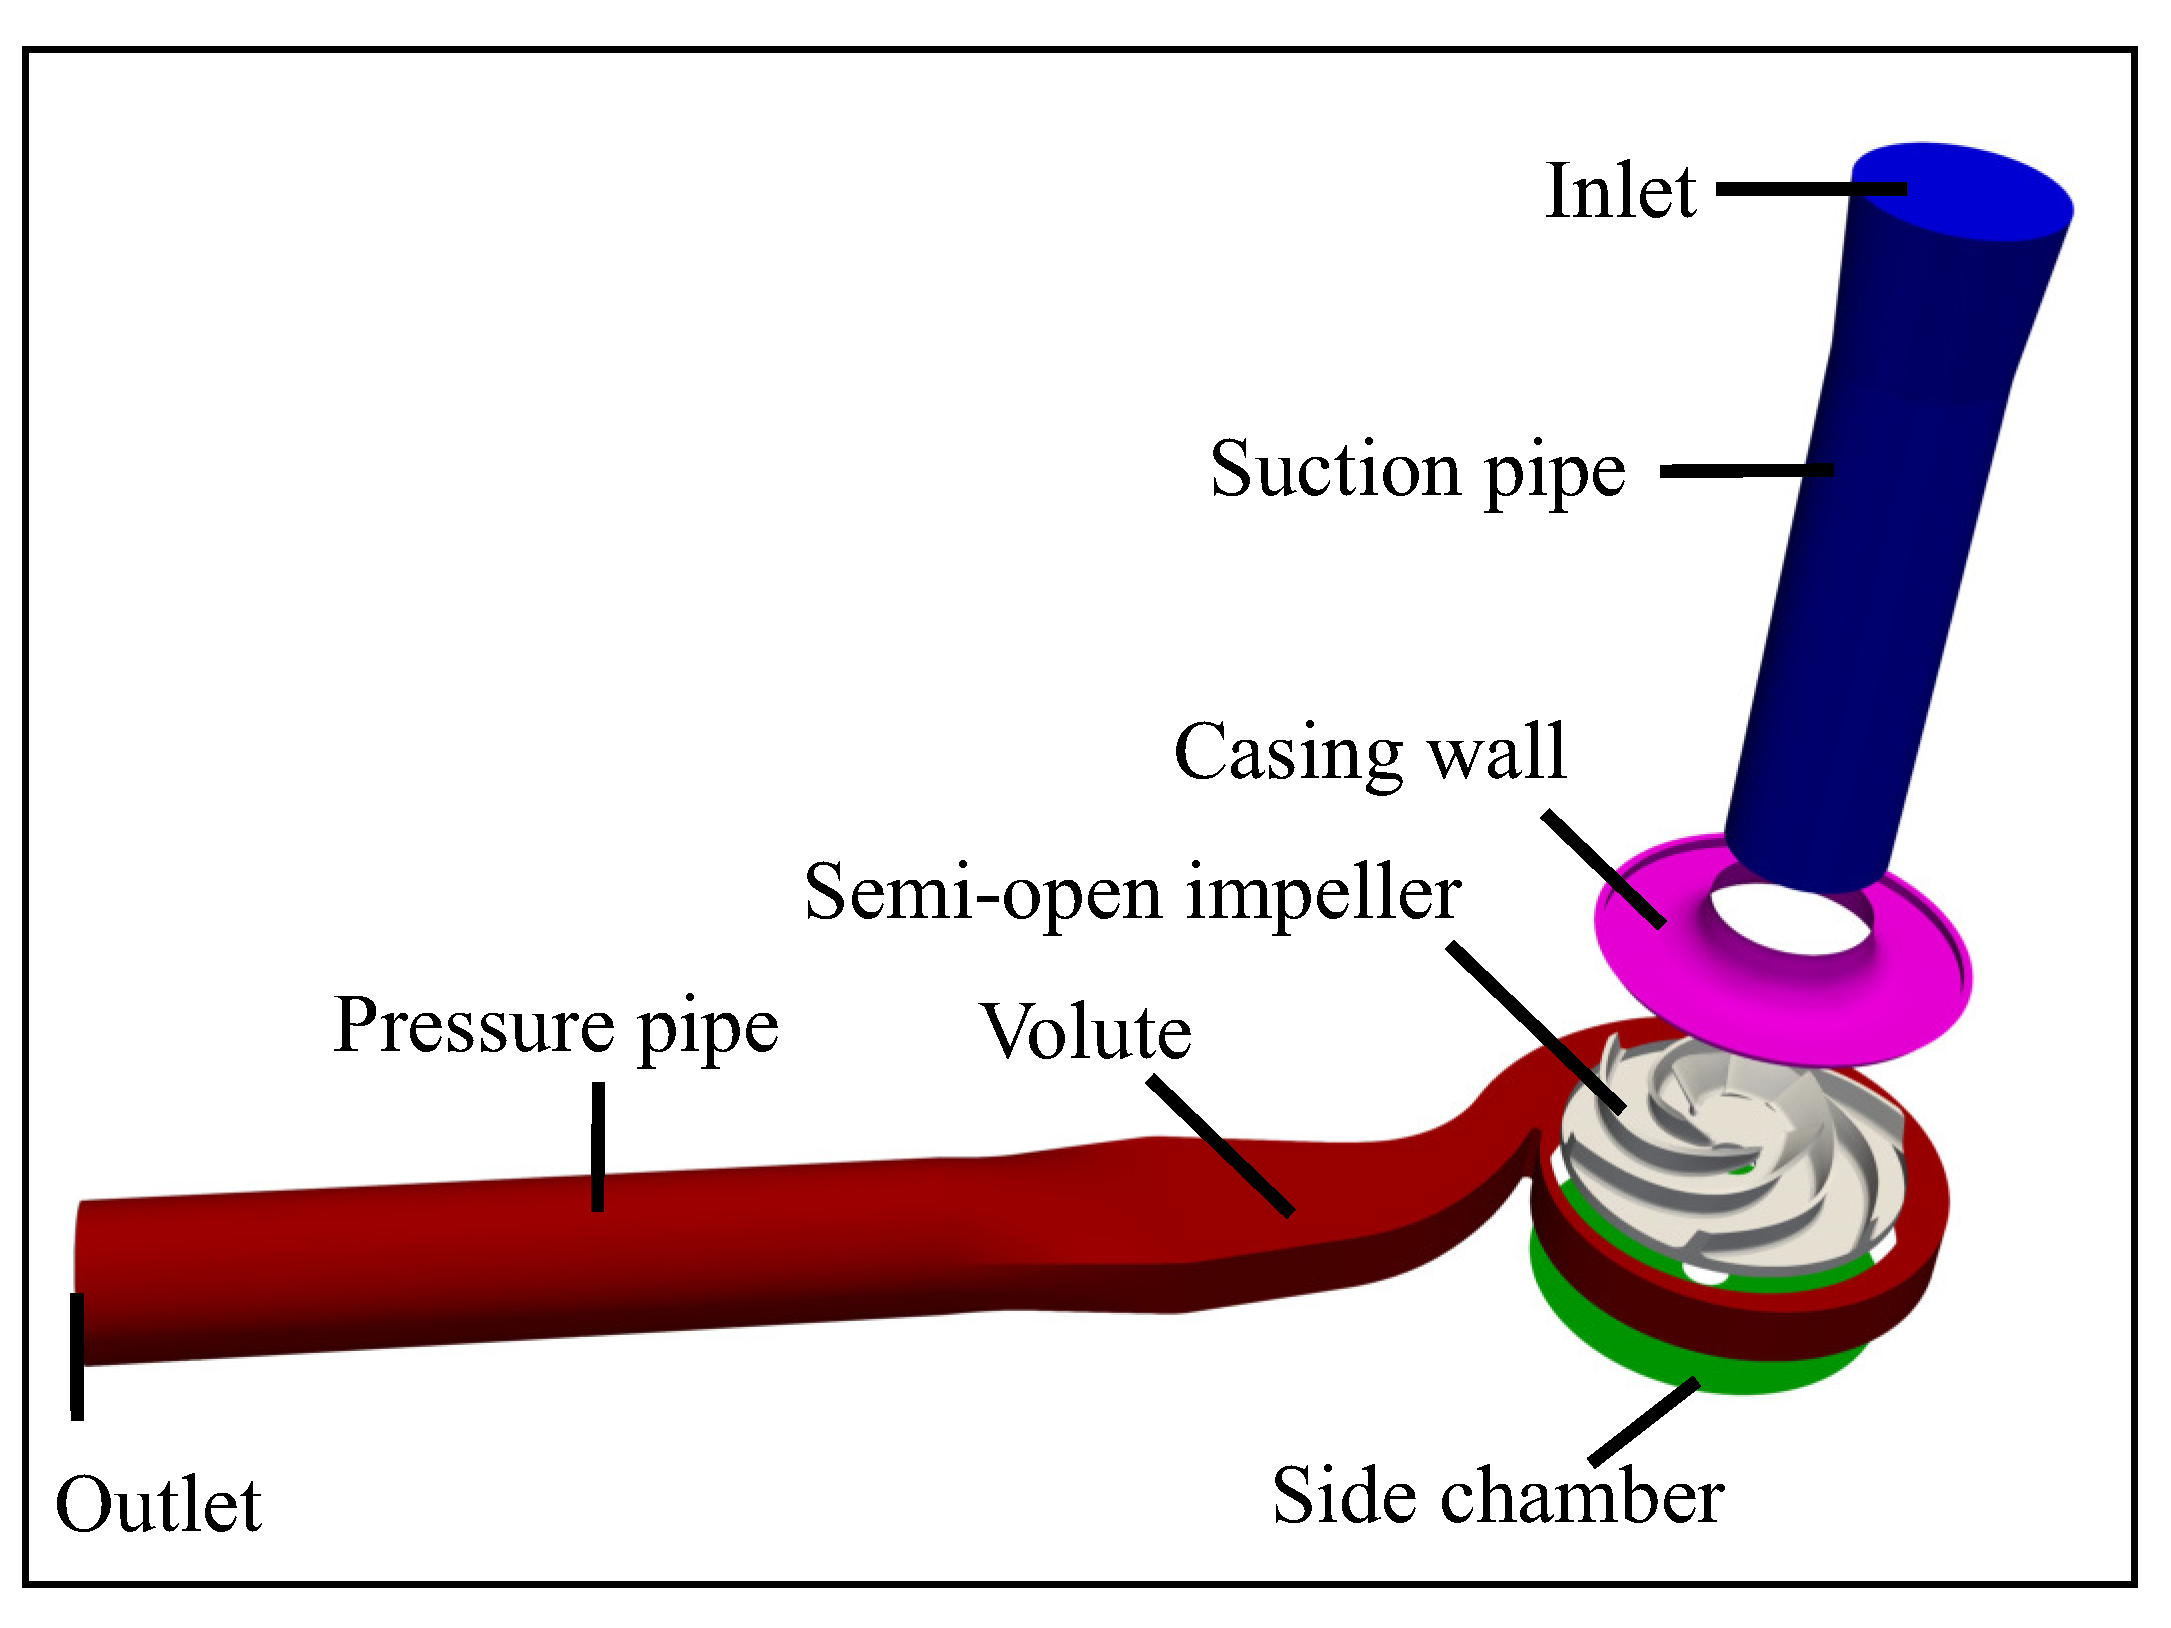
2.1. Experimental Set-Up and Pump Characteristics
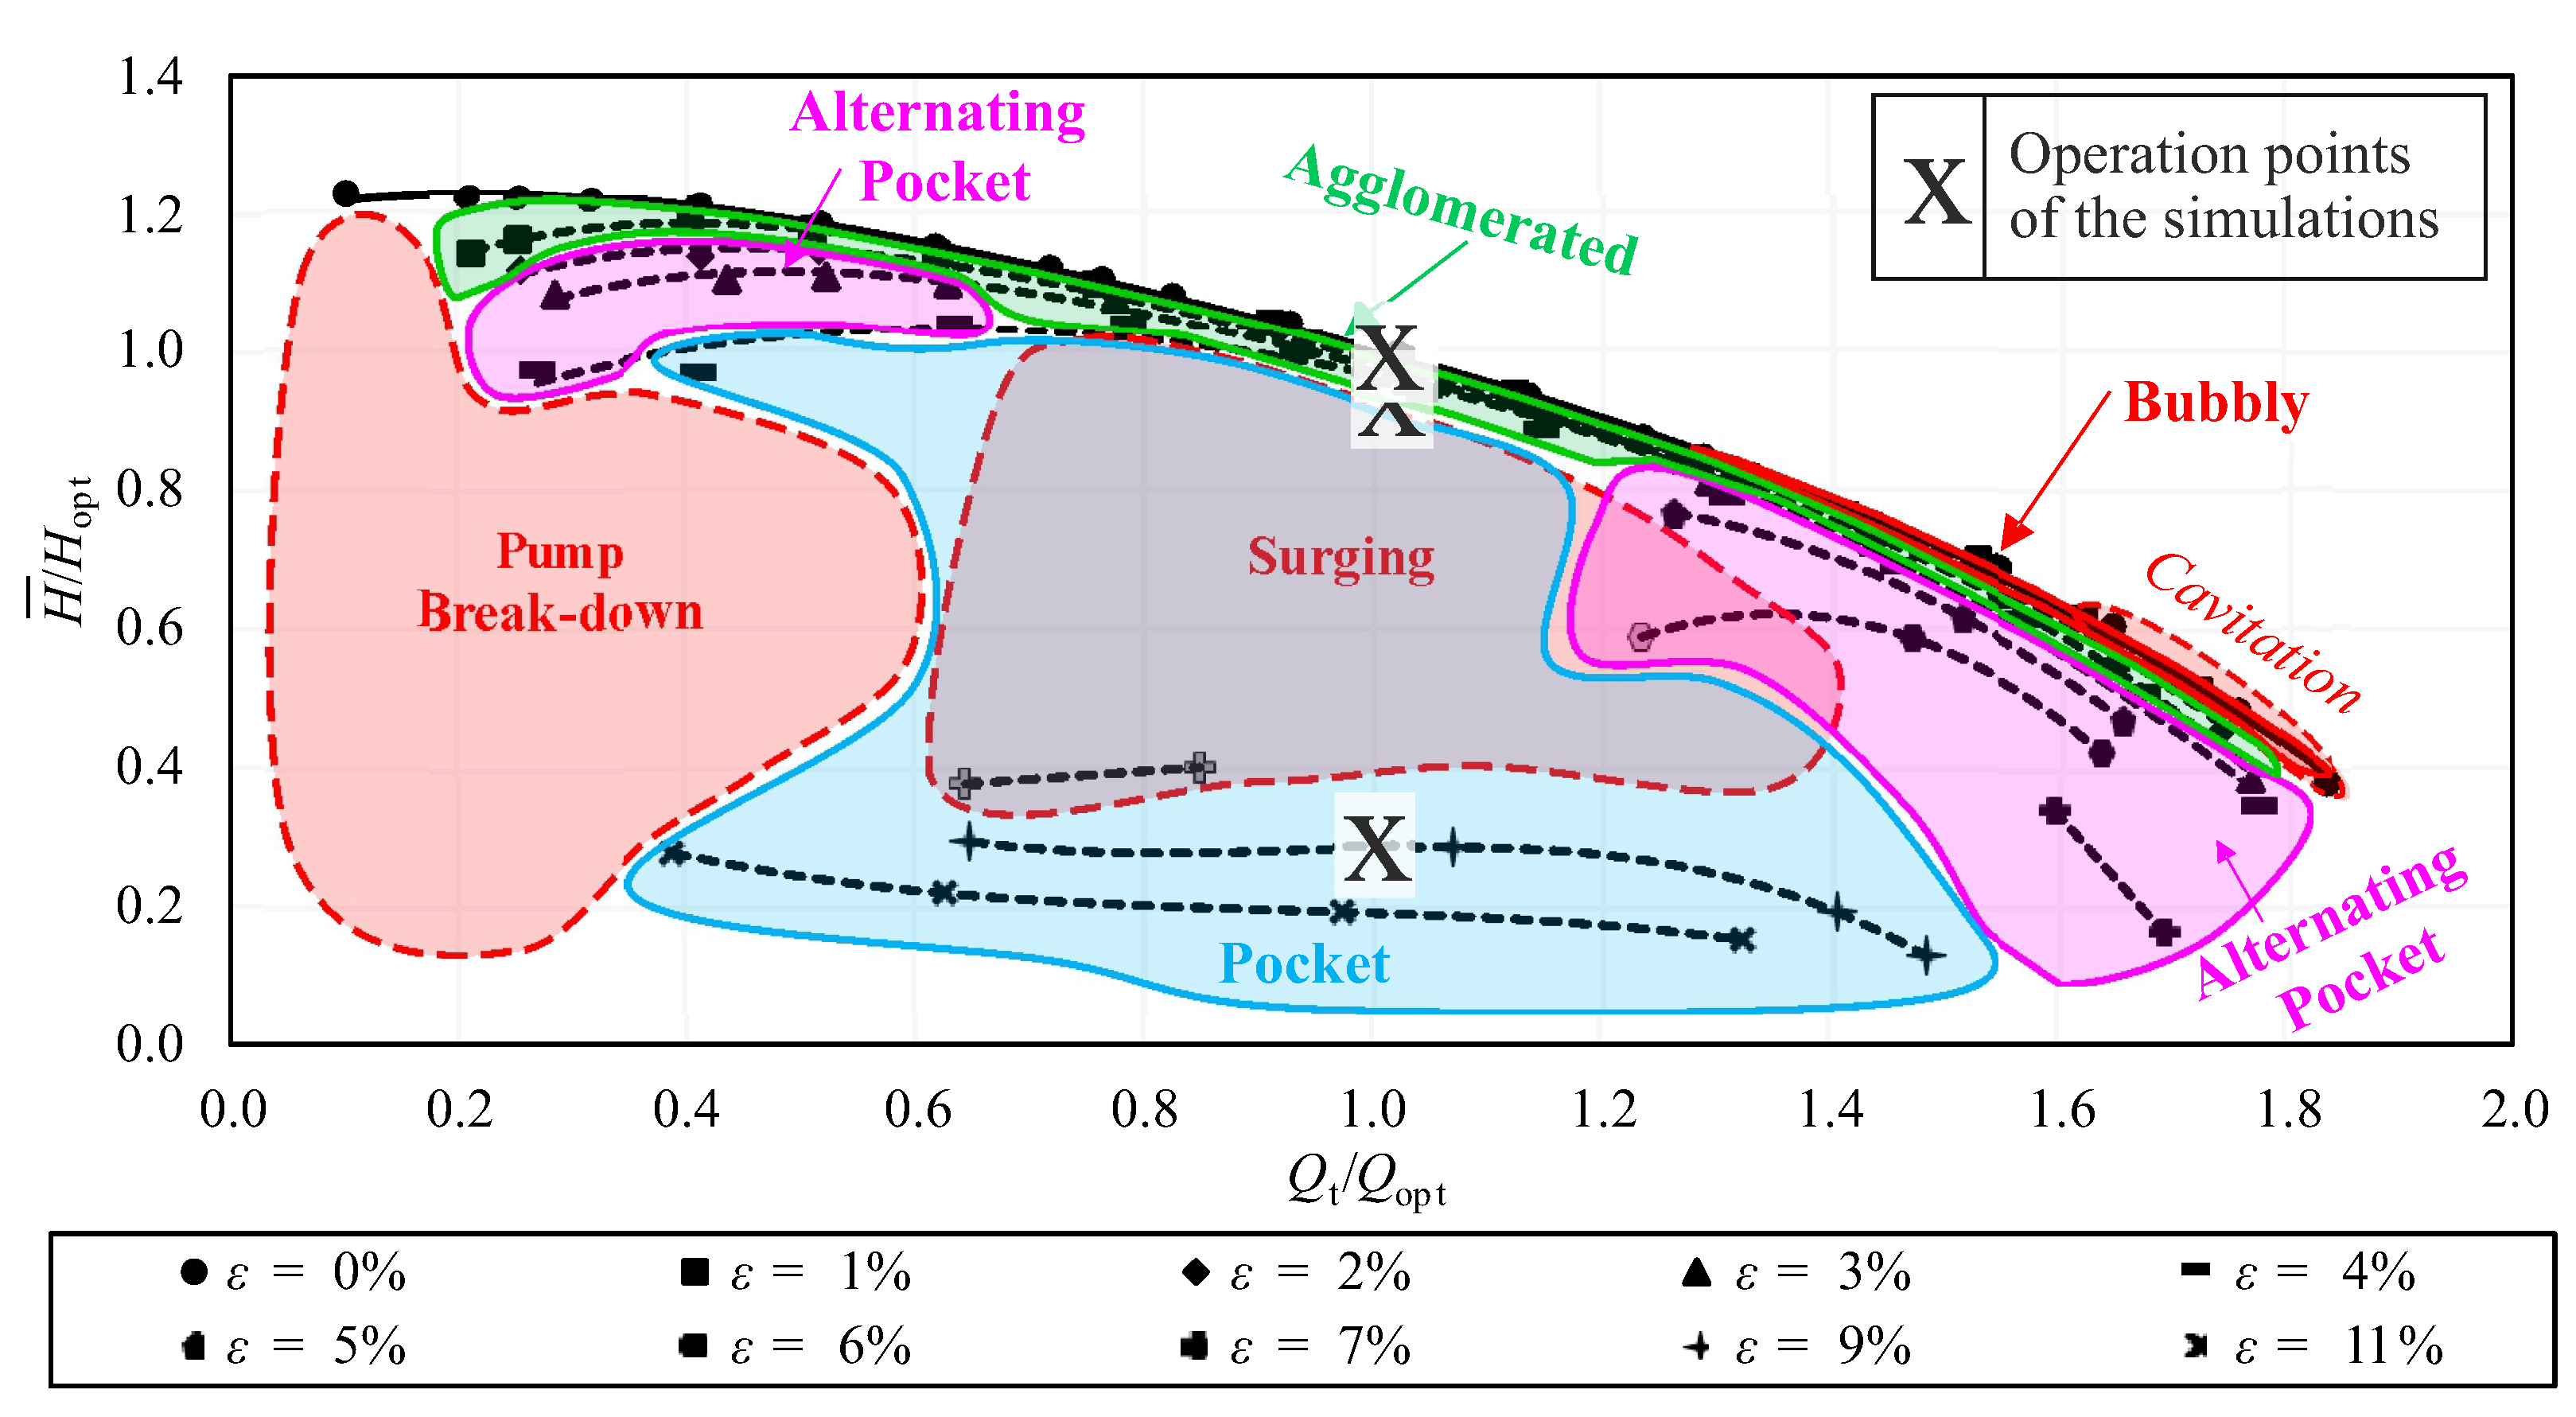
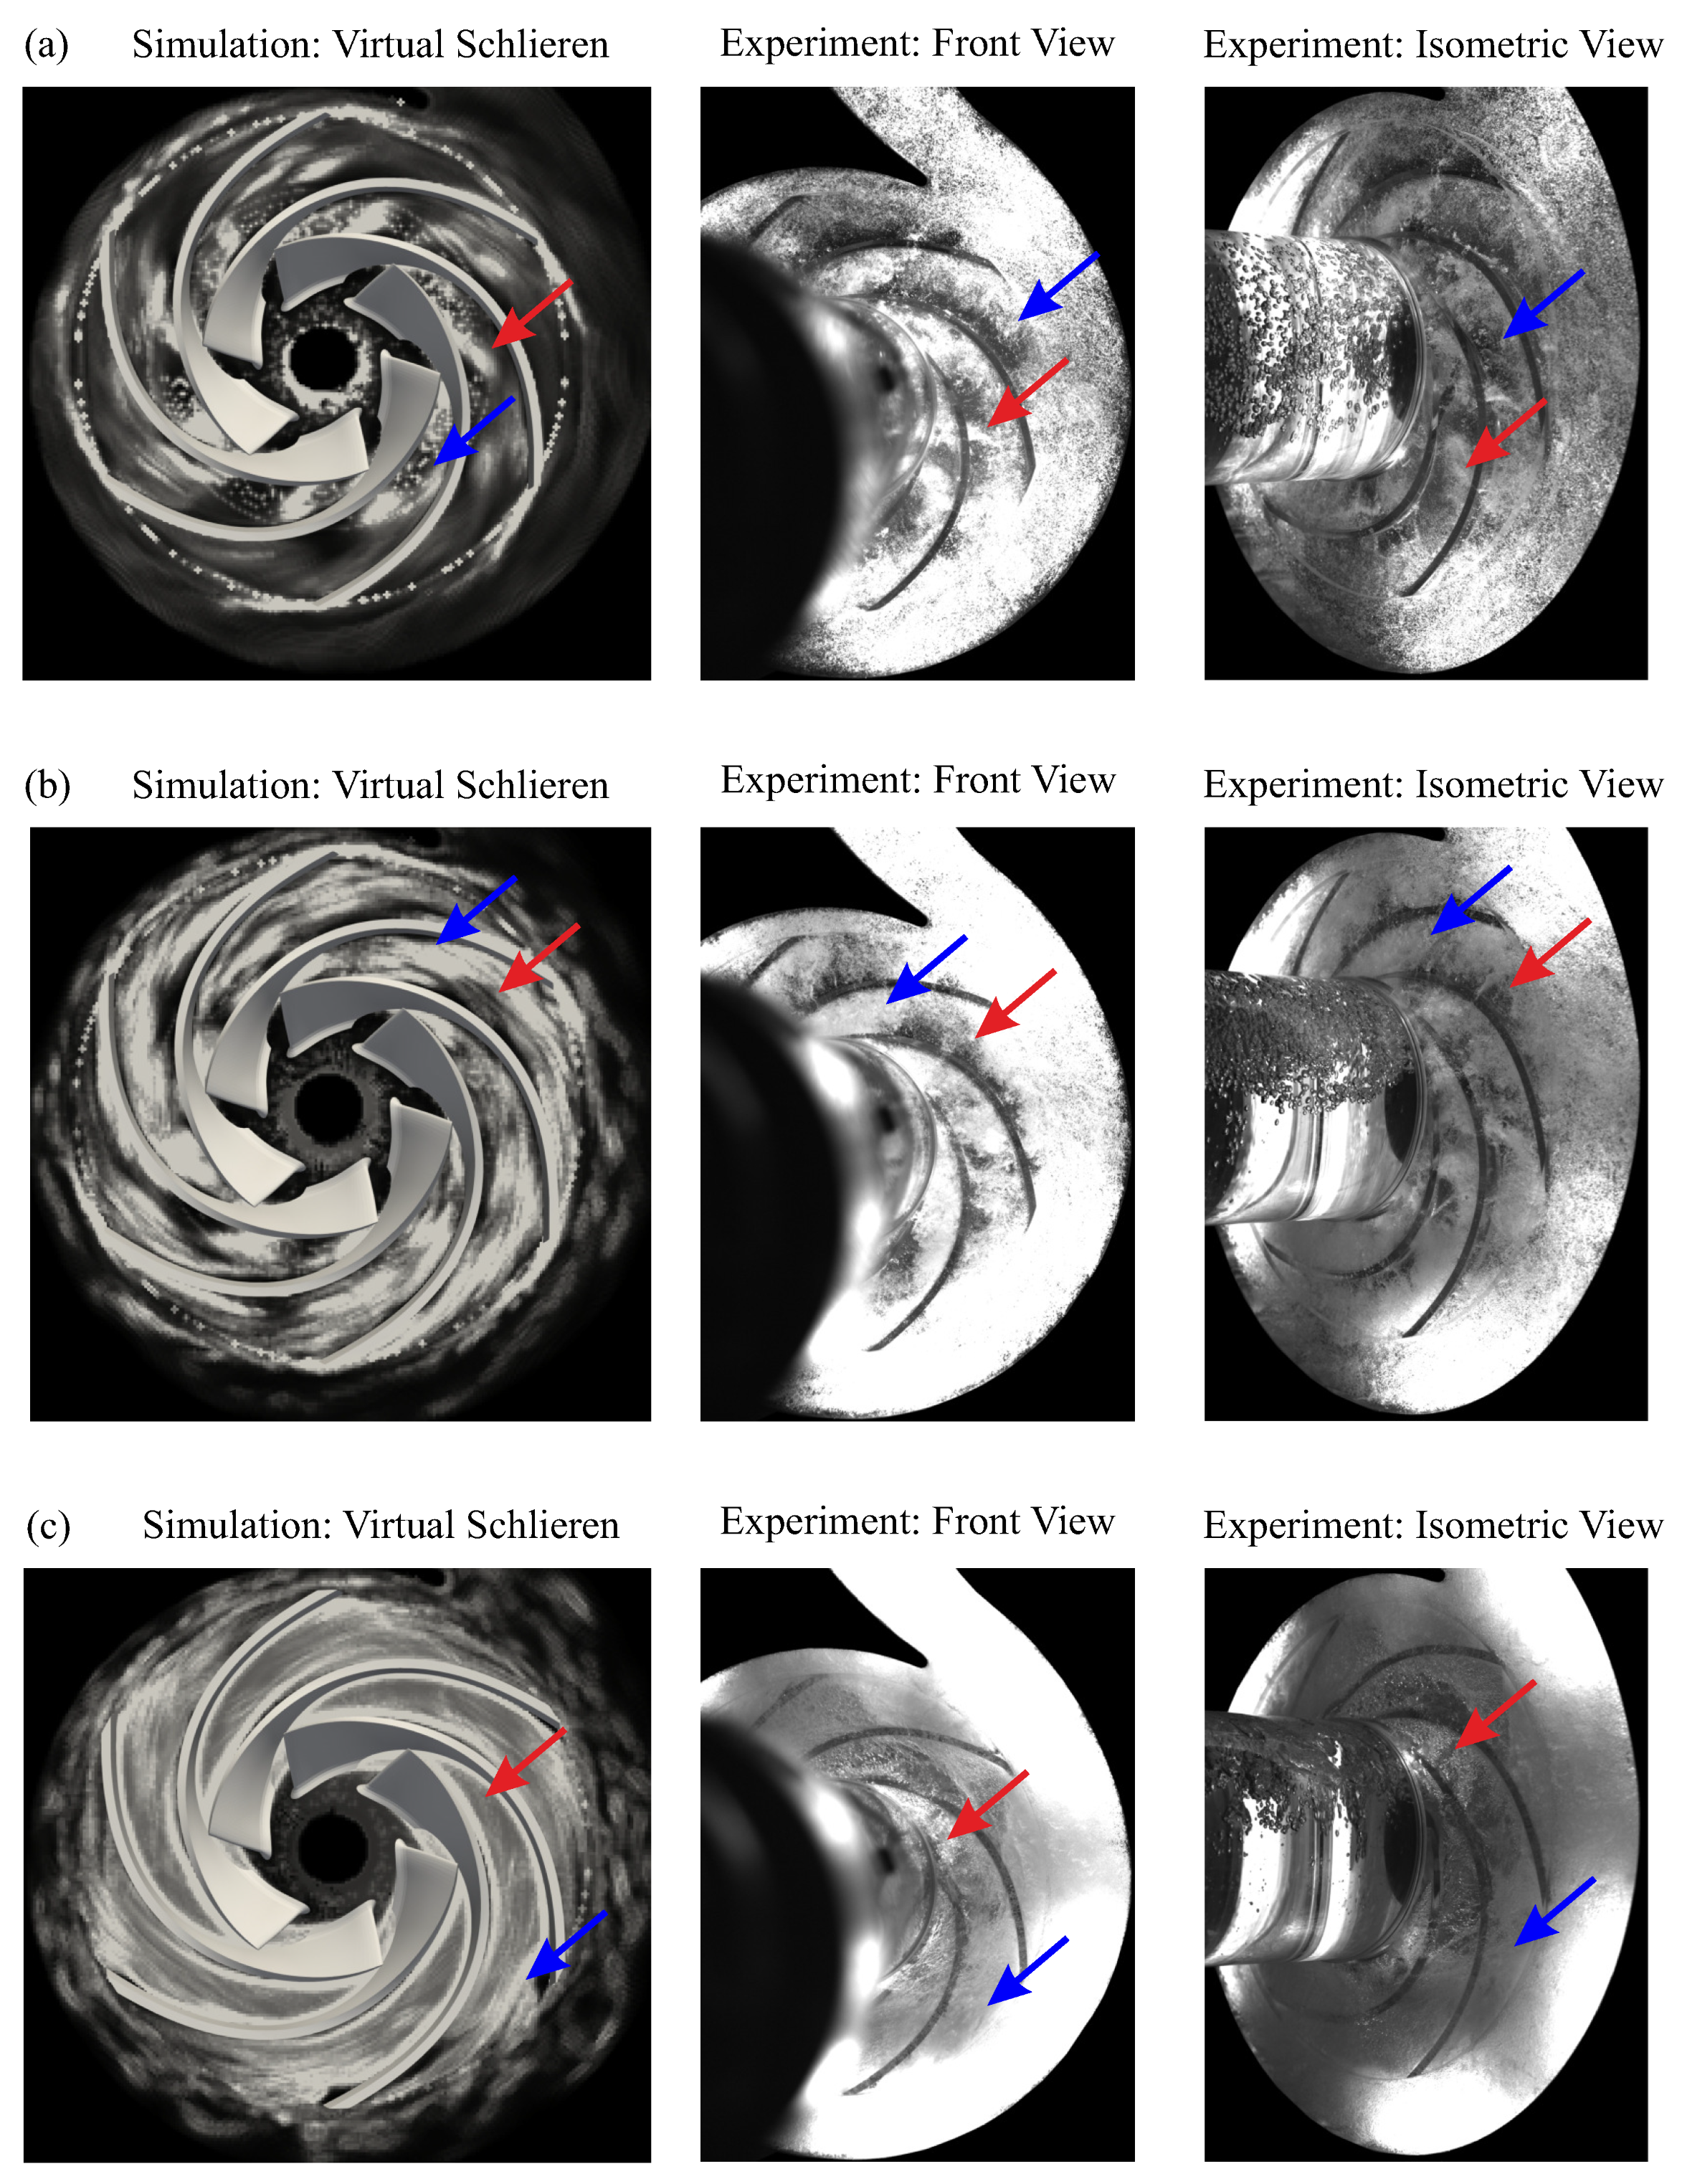
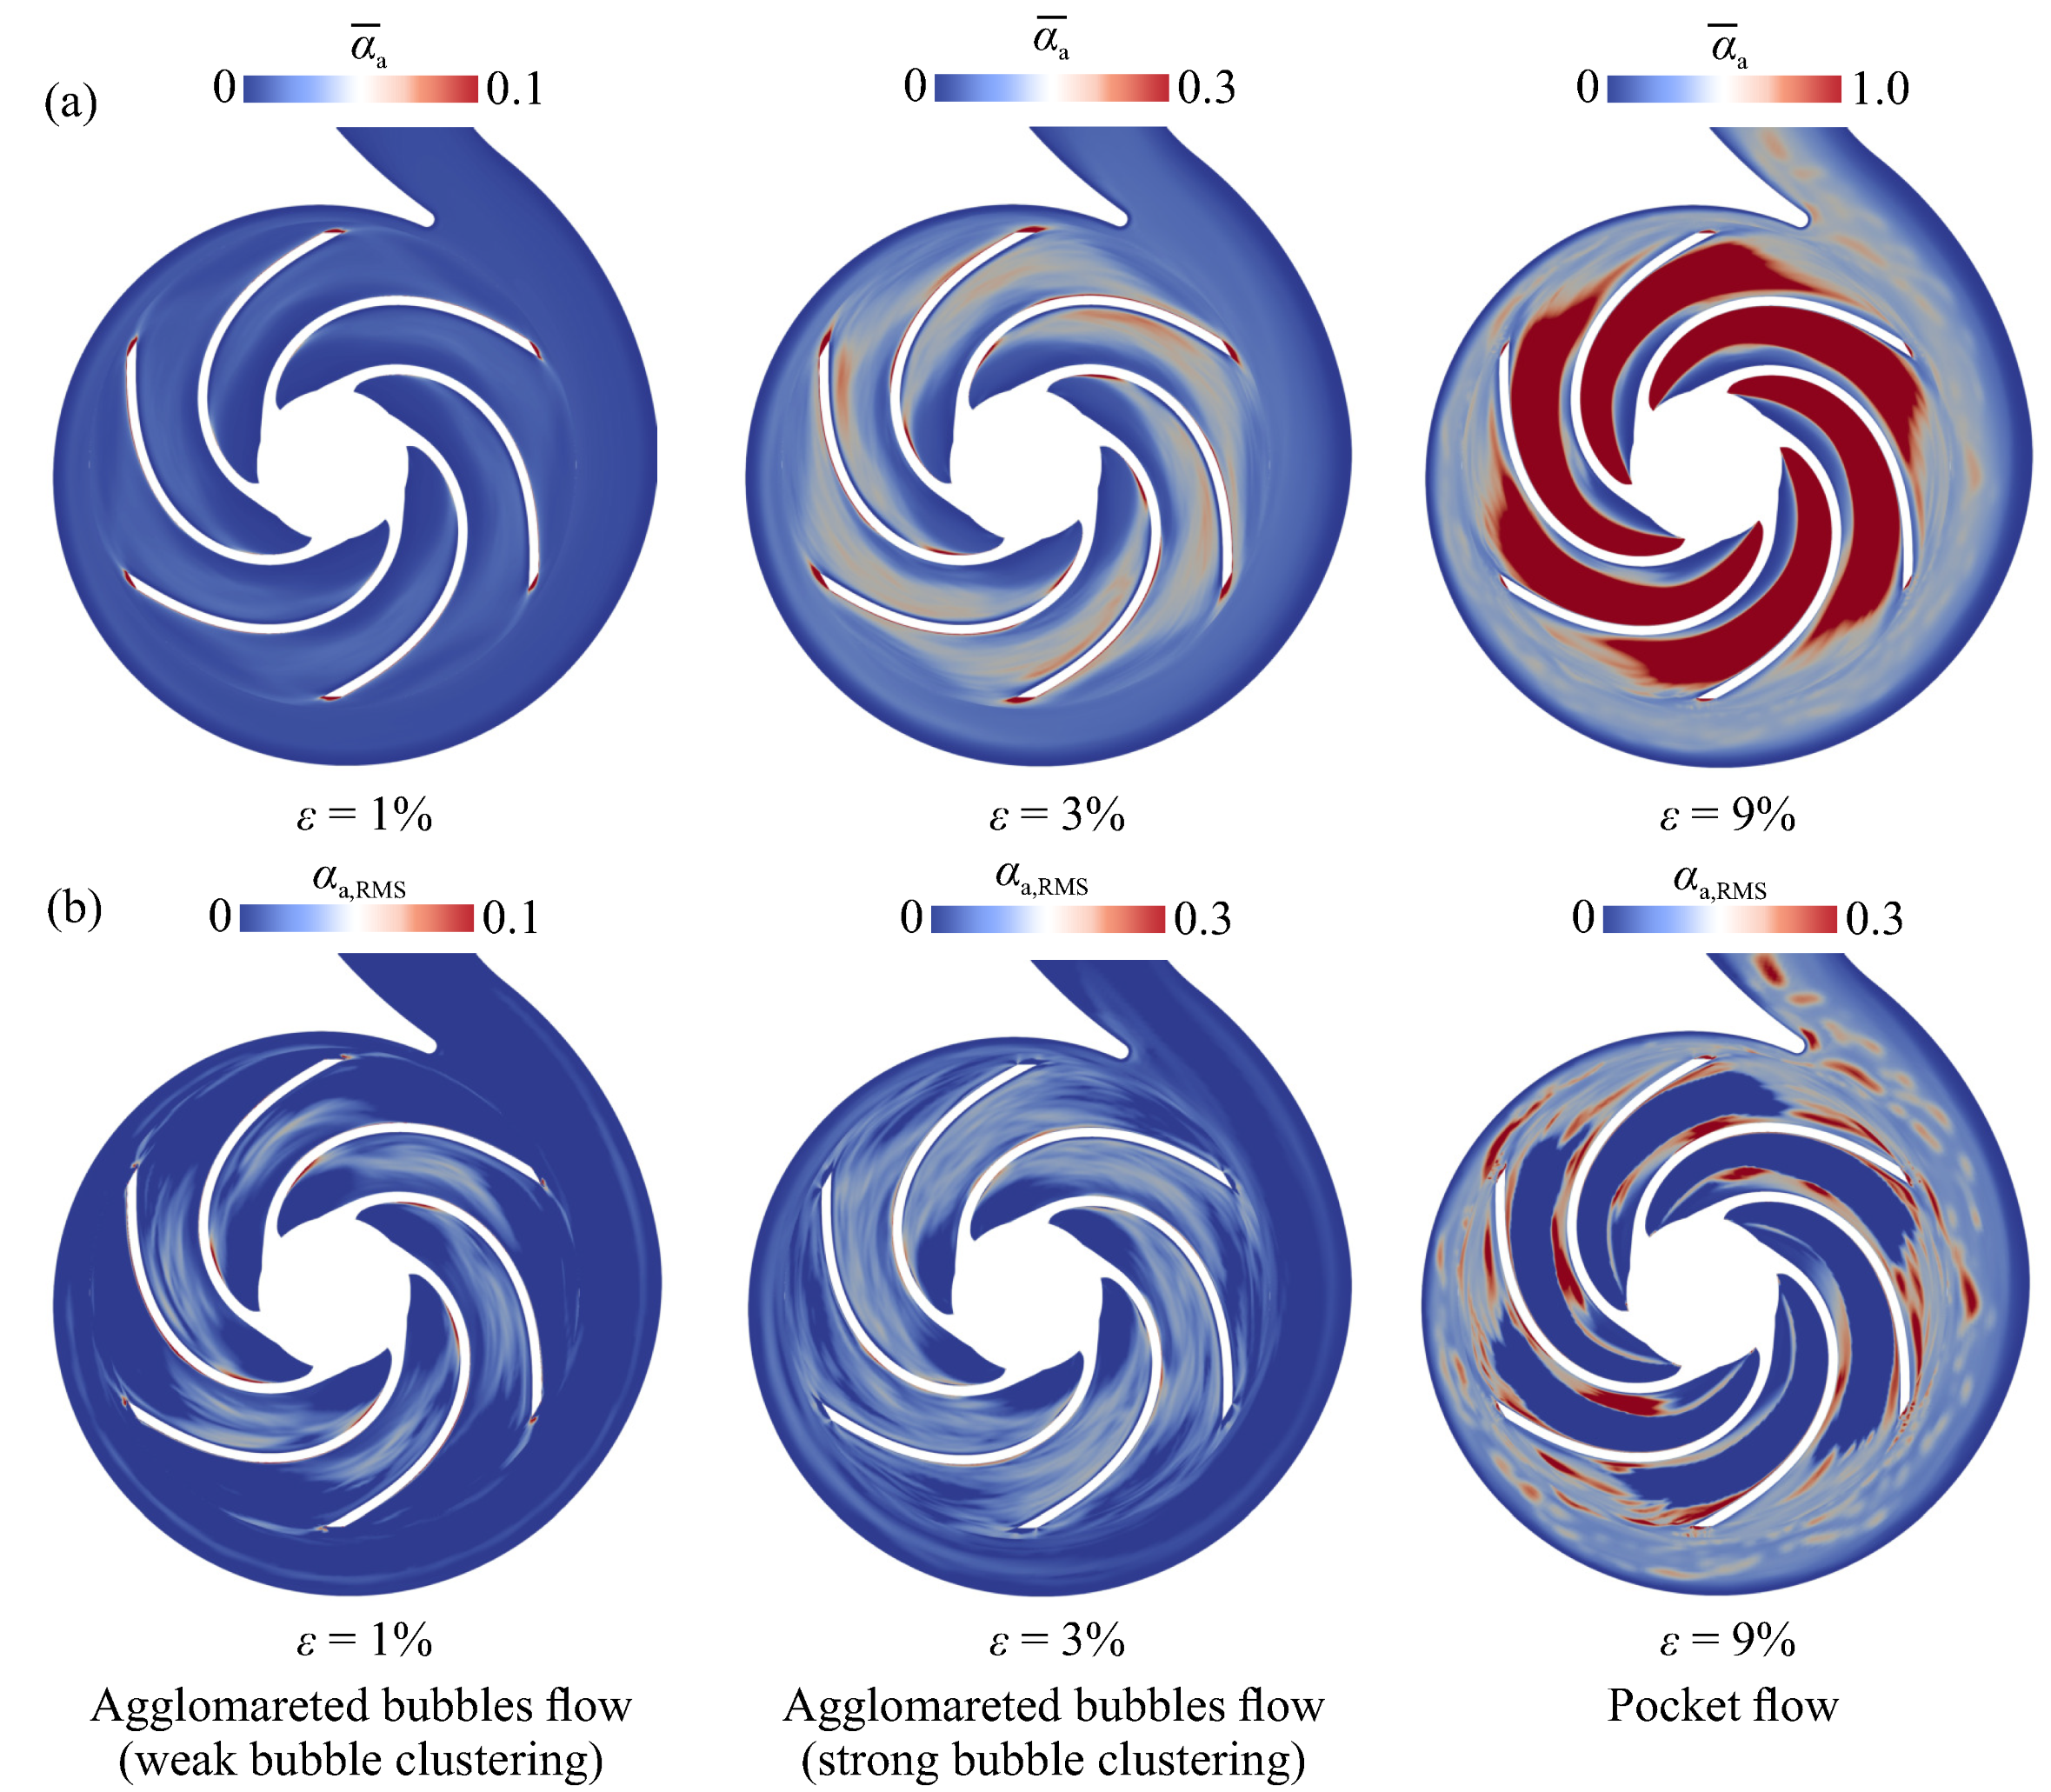
A 3D view of the pump and a photograph of the test rig are provided in Figure 1. The pump casing and the impeller are made of transparent acrylic glass and transparent polycarbonate, respectively, to allow flow visualization. The two-phase flow patterns are captured using two high-speed cameras with a 2016 × 2016 pixel resolution. The cameras are located in axial (camera 1) and isometric (camera 2) views, as depicted in Figure 1b.
Acrylic glass, polycarbonate and water have different optical refractive indices. In this study, only images obtained by camera 1 are used for direct comparison with simulation results, while images from camera 2 serve as a means for additional visual inspection of air accumulation zones. The arrangement of camera 1 is orthogonal to the casing wall. Therefore, it is assumed that the effect of refraction is minor. For a more quantitative comparison, the actual location and size of bubbles may be calibrated and double-checked, based on the geometrical pump dimensions, such as impeller diameter and blade thickness. However, this is out of scope of this study. Six LED lamps are distributed around the pump casing to illuminate the flow, as shown in Figure 1a, making the water/air interfaces visible. A dashed rectangle in Figure 1a indicates the window where the two-phase flow patterns are observed. A rotational speed of n = 1450 min 1 is applied, resulting in a specific speed of about n q = 24 min 1 , according to the definition of Gülich [32], and corresponding to a non-dimensional specific speed of N s = 0.44 . A semi-open impeller is applied, and its meridional view is sketched in Figure 2. Two tip clearance gap sizes s are investigated in the experiments: s / b 2 = 2.5 % and s / b 2 = 4.5 % , where b 2 is the outlet width of the impeller blades.
It is found that the void patterns are not significantly affected by tip clearance size. Therefore, this study focuses on the smaller clearance gap. The volumetric flow rates of air and water, Q a and Q w , are separately measured to calculate the inlet air volume fraction ε . The static pressure difference across the pump is recorded to calculate the pump head. No bubble size spectra are measured. Therefore, we confine our investigations to a qualitative comparison between experimental and simulation results. Details of the experimental set-up, measurement techniques, and data evaluation are provided elsewhere [1,7,15,33].

2.2. Flow Regimes

The flow regime map observed in the experiments, in terms of pump head H versus total flow rate Q t is depicted in Figure 3. The bubbly flow, agglomerated bubbles flow, alternating pocket flow, and pocket flow regime are discernible. The basic structure of the regimes essentially corresponds to the one of the 2D bladed pump from our previous study [7]. However, there are distinctive shifts in individual regimes.
A detailed analysis of the effect of blade geometry and impeller design speed on the flow regimes is out of scope of this study. We confine our discussion to the effects which are immediately helpful for solver validation. For example, the bubbly flow regime is shifted to overload conditions, while the agglomerated bubbles flow regime is near the nominal flow rate, presumably because a rise in speed enhances Coriolis forces, so that the pressure gradient in the cross-flow direction and the tendency of bubble agglomeration are also enhanced. Furthermore, the pocket flow regime is present at rather large values of the inlet air volume fraction, ε 9 % . A wide surging range between 3 % < ε < 9 % is discernible, which means that the pump jumps back and forth between two operation points. Alternating pockets occur only at part-load and overload, and at moderate air loading 3 % < ε < 7 % . Ref. [15] showed that, by increasing the rotational speed, the water/air mixing and, therefore, the two-phase pump performance is improved. Hence, it is assumed that the shift of pocket flow to higher levels of ε can be traced back to a rise in design speed. It is interesting to note that the Reynolds number evaluated by the impeller diameter and circumferential impeller outlet velocity is the same for the present pump and the 2D bladed pump of our previous investigations [7], so that the shift of flow regime maps to higher values of ε was not a Reynolds number effect. A more in-depth analysis of experimental data for assessing flow regime maps is left to further studies. In this study, the validation of the H2P method for a 3D bladed pump with elevated design speed is the focus. Therefore, three operation points are considered with ε = 1 % , 3 % , and 9 % , additionally marked in Figure 3. ε = 1 % and 3 % correspond to the agglomerated bubbles flow regime, while ε = 9 % corresponds to the pocket flow regime.

3. Simulation Method

3.1. Flow Solver

The H2P solver from our preceding studies [7,34] is adopted, and its main features are summarised here. It is an extension of the Euler–Euler two-fluid (EE2F) model with the ability to continuously activate Volume-of-Fluid (VOF) features for a proper interface resolution of coherent void structures. According to Wardle & Weller [35], the balance equations for mass and momentum for each isothermal phase φ (water and air) read:
α φ t + · α φ c φ + C α · c c α φ 1 α φ interface compression = 0
α φ ρ φ c φ t + · α φ ρ φ c φ c φ T + · α φ ρ φ R φ eff = α φ p + C β M D , φ + M vm , φ + M s , φ .
The volume fraction, density, and velocity of phase φ are symbolized by α φ , ρ φ , and c φ , respectively, and R φ eff represents the stress tensor combining Reynolds (turbulent) and viscous stresses. Note that the marking of Reynolds-averaged quantities is omitted for convenience. Both phases share the same static pressure field p. Water and air are treated as incompressible fluids, which enhances solver stability [36]. The interfacial momentum exchange terms, i.e., drag and virtual mass force, are symbolized by M D , φ and M vm , φ . For the former, the drag model of Schiller & Naumann [37], and, for the latter, a constant virtual mass coefficient of 0.5 [38], are applied, respectively. The force M s , φ is the surface tension force, estimated as a continuum force, according to Brackbill et al. [39].
The hybrid multi-scale character of the solver is facilitated by two blending functions for the interface compression term in Equation (1) and the drag force M D , φ , respectively. By following Hänsch et al. [40], the blending function for the interface compression C α reads:
C α = 0.5 tanh a B α a a min + 0.5 0.5 tanh a B a max α a + 0.5 .
We set the constants a B , a min , and a max to 35, 0.1, and 0.9, respectively. If C α is set to 0, the original EE2F formulation is retained, while with C α = 1 , a VOF-like interface resolution is achieved, which counteracts the numerical diffusion at the phase interface by including the compression velocity c c in Equation (1). Details of the c c evaluation can be found in Wardle & Weller [35]. A second blending function C β blends the drag force between the formulation of [37] for spherical bubbles and a treatment of large coherent air structures where the drag is set to a low finite value of 10 4 . The C β function is presented in [7] and is not repeated here. Note that applying two different blending functions for the interface compression and the drag force is attributed to the complexity of the pump flow, since it would be more consistent to use the same blending function for both sub-models. However, using Equation (3) for the drag force as well has produced stability issues [7].
The limitations of a monodisperse approach have been pointed out by Hundshagen et al. [7]. Therefore, a polydisperse bubble size distribution is considered here. An additional transport equation for the specific number density n B d B of bubbles is solved in each computational cell and timestep. Beyond the transport of n B d B , birth and death rates, due to coalescence and breakup, are treated by source and sink terms. Thereby, a variable bubble diameter d B is facilitated, e.g., in the drag force M D , φ . By adopting the approach of Kumar & Ramkrishna [41], the population balance equation is discretized in size groups, leading to the class method of Lo [28]. Twelve size classes, with a duplication of the bubble volume between consecutive classes, are adopted, resulting in a spectrum of bubble diameters for each size class, ranging from roughly 0.16 mm < d B < 2.00 mm . This bubble diameter range corresponds to the one observed by Barrios & Prado [20] in electrical submersible pump flow for speed variation. Each bubble size class comprises the same velocity, and coalescence and breakup kernels are evaluated for each class. The coalescence kernel of Prince & Blanch [42], and the breakup kernel of Luo & Svendsen [43] are chosen. The coalescence kernel is used with an extension for maximum bubble packing, as proposed by [44], resulting in a formulation similar to the one suggested by Stel et al. [9] for a centrifugal rotor flow. Although the breakup and coalescence kernels are simply adopted from entirely different applications, e.g., bubble columns or mixer vessels, they have also been adopted in other two-phase pump studies, such as those by He et al. [10] and Yan et al. [25]. Hence, this is also done in this study. From the resulting bubble size distribution, the Sauter mean diameter d 32 is evaluated, corresponding to a time and space distribution of d B .
The SAS approach by Egorov & Menter [30] is adopted, which is based on the k- ω shear stress transport turbulence model of Menter [45]. A separate turbulence field, in terms of turbulence kinetic energy k φ and specific dissipation rate ω φ , is calculated for air and water. The wall functions of Kalitzin et al. [46] are employed for both phases. Hence, c φ , k φ , and ω φ are directly integrated to the wall or calculated by the logarithmic wall law depending on the value of the non-dimensional wall distance y w , φ + .
The multiphaseEulerFoam solver of OpenFOAM-9 (https://github.com/OpenFOAM/OpenFOAM-9 accessed on 1 May 2022) was used, customized by means of several model extensions, as described above. The PIMPLE solution algorithm with pressure relaxation was chosen, which is a combination of the pressure-implicit with splitting of operators (PISO) [47] method and the semi-implicit method for pressure-linked equation (SIMPLE) [48] algorithms. The timestep is set in such a way that the Courant–Friedrich–Levy number does not exceed 0.75 at the maximum, to achieve numerical stability. Three outer PIMPLE iteration loops turned out to yield a drop of non-linear residuals below 5 · 10 4 in each time step. Additionally, a drop of residuals of linear solvers below 10 8 is applied. Different discretization schemes for the respective balance equations are used, which are summarized in Table 1.

3.2. Simulation Set-Up

The simulation set-up consists of the suction and discharge pipe, volute casing, side chamber, and 360 impeller to reflect the entire pump geometry. An explosion view of the computational domain is shown in Figure 4. Constant Dirichlet inlet boundary conditions are chosen for c φ , α φ , d B , k φ , and ω φ . The phase velocity is set according to the measured flow rate and water and air have the same inlet velocity. A constant bubble diameter of 0.5 mm is set at the inlet, following the estimation by Barrios & Prado [20]. At the suction side cross-section, i.e., the inlet boundary of the computational domain, a constant value of α φ is prescribed. A Neumann boundary condition with zero gradient is set for pressure at the inlet, while a constant static pressure is defined at the outlet. At the outlet, Neumann zero gradient boundary conditions are set for c φ , α φ , d B , k φ , and ω φ .
Numeca AutoGrid® is used for the impeller and side chamber grid generation. For the suction and discharge pipes and the volute casing, Numeca HexPress® is employed, and local grid refinement by hanging nodes is utilized. The grids are optimized in terms of non-orthogonality, following the OpenFOAM nomenclature of Jasak [47]. In this way, grids with reasonably high quality are generated, taking into account the complexity of the 3D-twisted blade design. A grid study, by means of refining grid level G1 to G2, is performed, and some grid parameters are summarized in Table 2.
The single-phase simulation results, regarding the pump head and the inner efficiency for the same impeller geometry, but with a different volute casing, were investigated elsewhere [53,54]. Therefore, the single-phase results are not again discussed here in detail. Preliminary simulation results showed that the change in single-phase pump head between G1 and G2 simulations approaches at maximum 1.5% in over-load conditions and less than 0.5% in nominal and part-load conditions. Regarding the two-phase flow, by means of a grid refinement, successively finer void structures are resolved by the H2P solver, which transitions from EE2F mode towards a VOF-like scheme with phase–interface resolving capabilities. Thus, an inherent grid dependence of the results cannot be avoided. The same holds for the SAS, since a successively larger portion of the turbulence spectrum is directly resolved by the computational grid. Details of a two-phase grid study are omitted here for brevity, but were presented elsewhere [7], and it is ensured that the conclusions drawn from the simulation results in the following are not affected by grid dependence. The G1 results are described below.

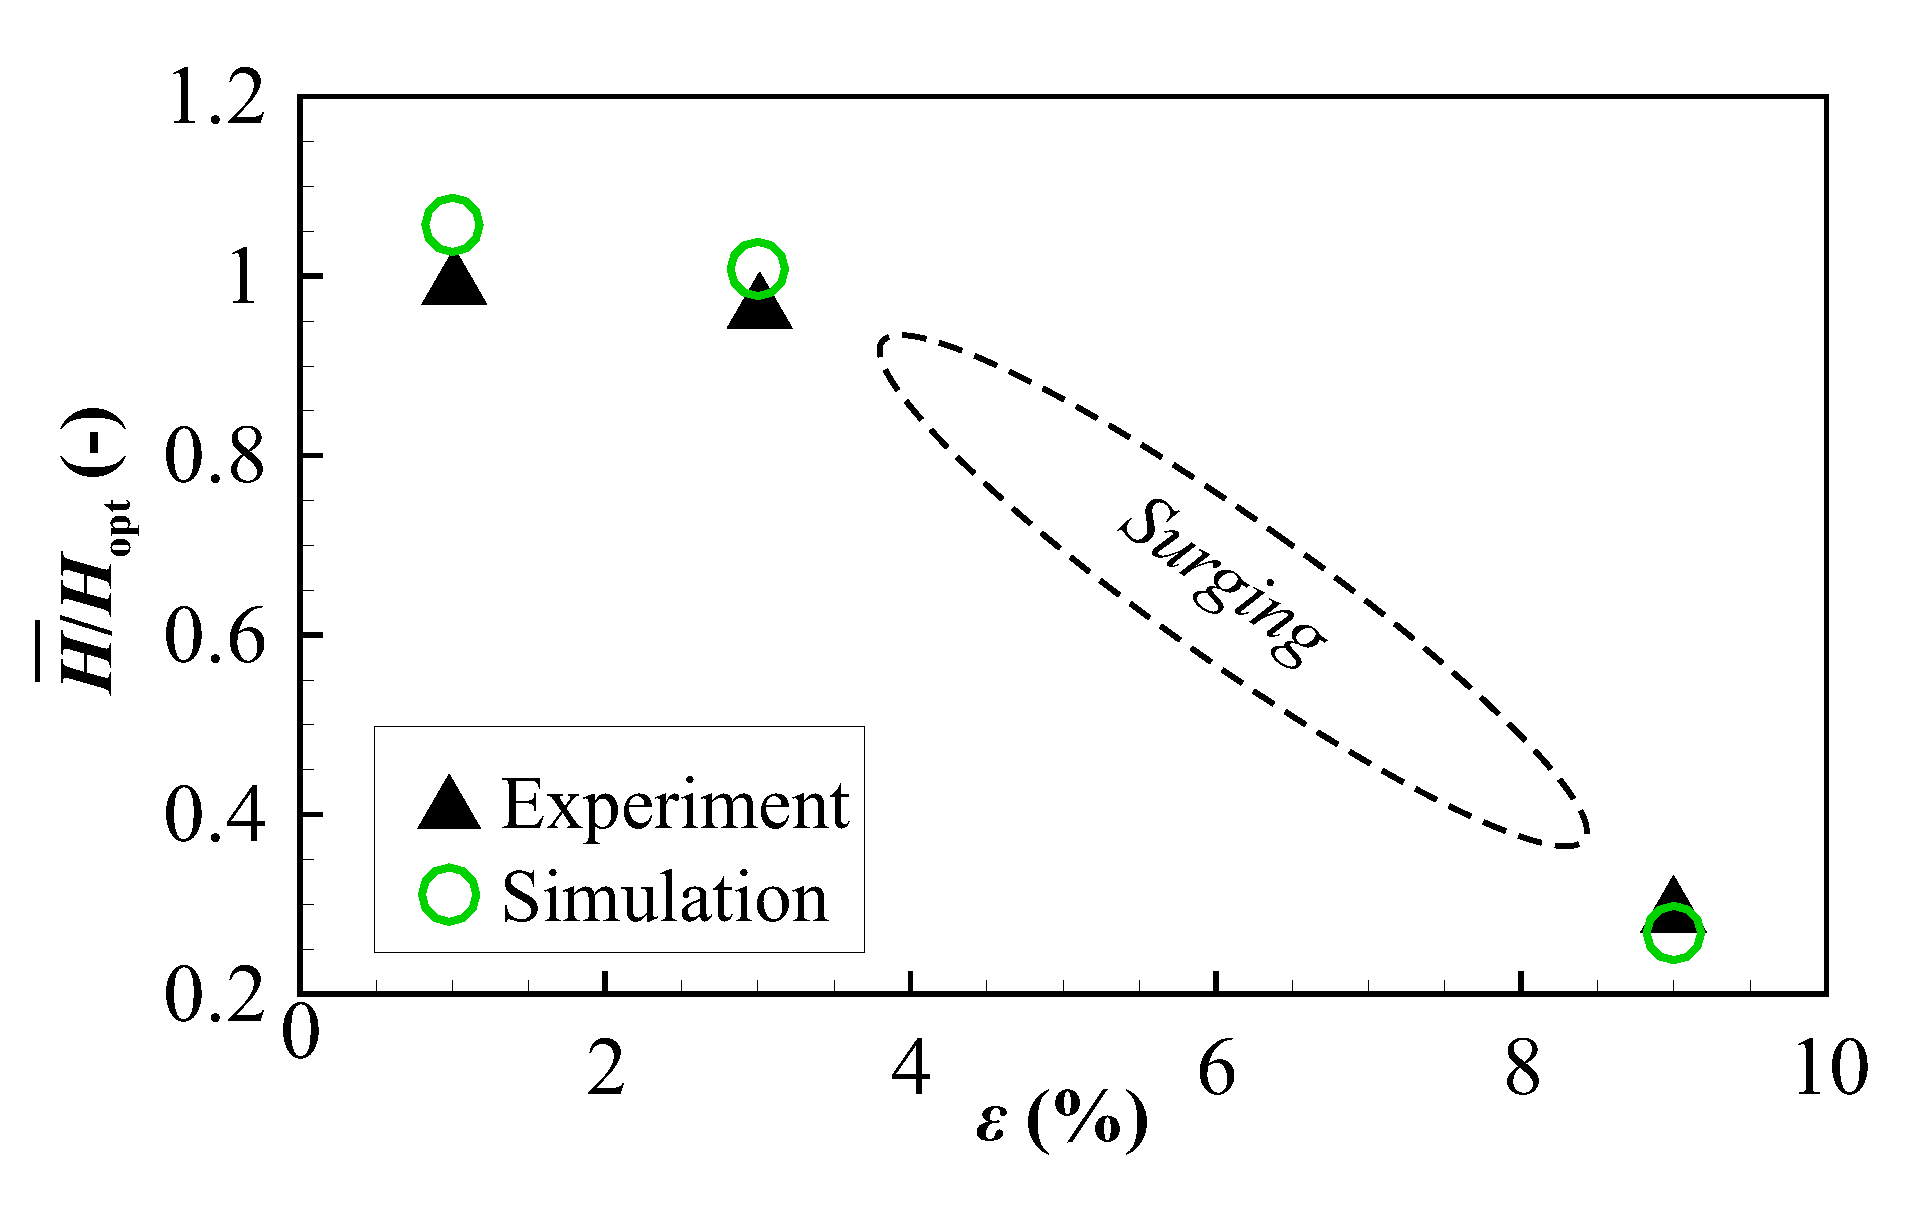
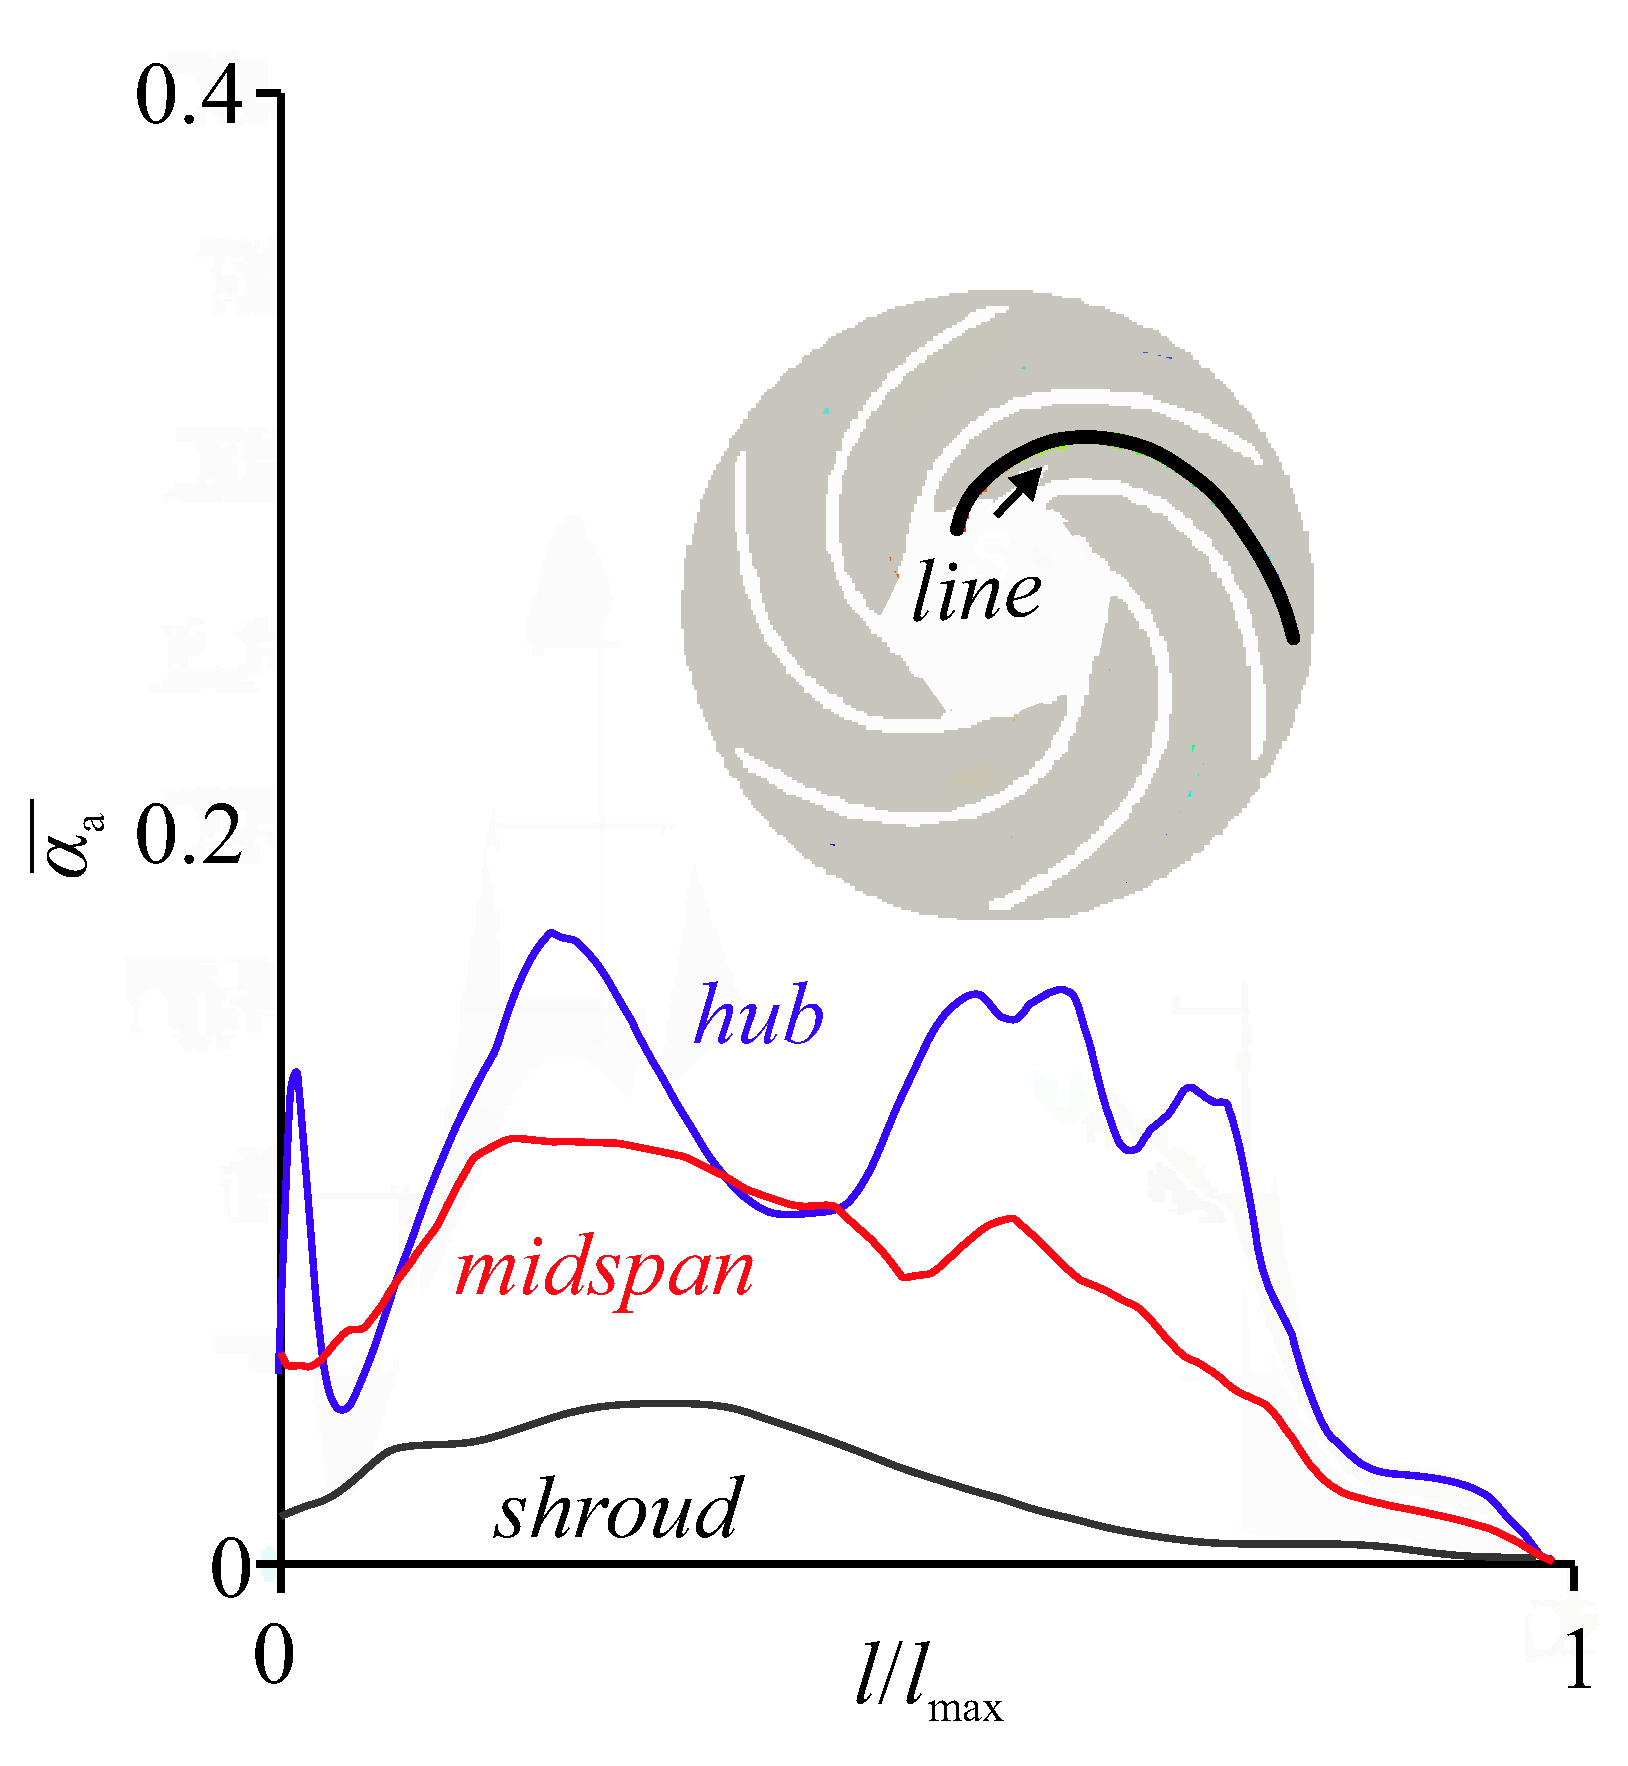
4. Results and Discussion

In the 2D bladed pump of our prior study [7], air accumulations extended over the entire blade height, which enabled a direct comparison between experimental results in the front view and contour plots of air volume fraction in the midspan of the impeller. This assumption does not hold any more for 3D-twisted blades. Figure 5 presents plots over lines located near the hub, midspan, and shroud in the middle of a blade-to-blade surface in an example blade channel. The aligned coordinate along the line is denoted by l, and l max is the line length. It can be seen that significantly less air is located near the shroud region than near the midspan or hub regions. Therefore, the α a distribution changes over the blade height, and a direct comparison of the air distribution from simulation results with experiments is facilitated by virtual Schlieren imaging. This visualization technique of the simulation results is based on spatial gradients of α a , and described elsewhere by Nguyen et al. [34]. Virtual Schlieren images are shown in Figure 6, together with the grey-scale images obtained by the experimental scattered-light technique. White areas in the virtual Schlieren images and the experimental results represent regions with high dispersed air loading. Dark regions indicate continuous phase regions of either water or air. Example snapshots of the flow field are shown, and coloured arrows are depicted to highlight similarities between simulation and measurement results derived from an intensive inspection of video sequences.
For ε = 1 % (Figure 6a), a maximum of dispersed air loading is visible near the suction side of the blade (red arrow), while a minimum is discernible on the pressure side (blue arrow). For ε = 3 % (Figure 6b), regions of dispersed air loading increase in size. Thus, the tendency of water and air to separate increases with a rising value of ε . For ε = 9 % (Figure 6c), a vast region with continuous air phase is discernible with maxima of dispersed loading downstream of this continuous region. Hence, the local air distribution obtained by the virtual Schlieren results from the simulations agrees well with the experimental results for the investigated operation range from ε = 1 % to ε = 9 % .
Contour plots of the time-averaged air volume fraction α ¯ a and its temporal standard deviation α a,RMS are shown in the impeller midspan in Figure 7a and b, respectively. Even for ε = 1 % , a slightly elevated level of α ¯ a is discernible near the suction side of each blade, which means that a slight tendency for phase separation is present. This tendency has already been observed in Figure 6, and is confirmed here. The highest values of α a,RMS correlate with the highest values of α ¯ a . These temporal and spatial characteristics of the air distribution indicate the presence of the agglomerated bubbles flow regime, according to Figure 3. For ε = 3 % , the peaks of both α ¯ a and α a,RMS increase significantly and span over a greater region within each blade channel. For ε = 9 % , the α a,RMS field shows minima in the region of the highest values of α ¯ a , which means that the correlation between α ¯ a and α a,RMS observed for low levels of ε completely reverses. Downstream of these stationary regions, highly unsteady wakes develop. Hence, a steady air pocket with an unsteady wake is observable. These characteristics can be assigned to the pocket flow regime, according to Figure 3. The analysis of transition between flow regimes has been extensively discussed by Hundshagen et al. [7] for a 2D bladed pump with reduced speed. From our brief discussion here, it is clear that, essentially, the same transition processes are present for the 3D bladed pump with elevated design speed, albeit on higher levels of ε . This transition is well captured by the H2P simulation approach.
The instantaneous distribution of the Sauter mean diameter d 32 at impeller midspan is presented in Figure 8. d 32 rises with rising ε , which indicates enhanced coalescence activity, according to the findings of Chen et al. [27]. A cross-check to Figure 7a reveals that this is most pronounced for ε = 9 % . The location of large bubble diameter correlate with the air accumulation zones, i.e., preferably, large bubbles accumulate, which is in agreement with similar findings by Zhang et al. [11]. Small bubbles are present downstream of the accumulation, indicating that the breakup mostly occurs in the wake of the accumulation zone. Due to these spatial characteristics, the d 32 distribution appears to be reasonable.
The time-averaged pump head versus inlet air volume fraction is shown in Figure 9. The experimental trend of decreasing head with increasing ε and the head drop between ε = 3 % and ε = 9 % are well reproduced. The transition of flow regimes, which is captured by the new H2P approach, is also reflected in a good reproduction of the measured pump head characteristics.

5. Conclusions

A hybrid two-phase (H2P) solver for the simulation of liquid/gas transport has been presented and assessed by experimental validation data of an industrial-scale centrifugal pump flow with 3D-twisted blades and increased impeller design speed. As a continuation of our previous study [7], it is the elevated speed that raises the pump resistance against air loading [15], probably due to its more substantial mixing effect, which shifts the pocket flow regime to higher values of inlet air volume fraction ε . It could be shown that the transition from bubbly flow to adherent pockets is also reproduced by the H2P method for a more industry-oriented pump design, i.e., twisted 3D blading and elevated design speed, which is a major novelty of this study.
A further novelty of the simulation method is the inclusion of a PBM to capture a variation of bubble sizes. It is interesting to note that the transition between flow regimes can also be captured by a monodisperse approach (not shown here), i.e., constant diameter, which, however, has to be prescribed and is, thus, not a result of the simulation. By the polydisperse approach employed here, a reasonable bubble size distribution is obtained. The hybrid approach, in combination with a scale-adaptive turbulence treatment and a PBM, enables the description of fluid dynamical processes of gas accumulation on a sound physical basis. This is a basic requirement for more predictive CFD tools and a knowledge-based design and optimization of centrifugal pumps for gas-laden liquid transport. Coalescence and breakup kernels have been, so far, adopted from entirely different applications, such as bubble columns or mixer vessels. For a sound validation of bubble spectra and the development of enhanced kernels, more in-depth experiments are indispensable and should be the focus of future studies.

Author Contributions

Conceptualization, M.H. and R.S.; methodology, M.H., K.R. and R.S.; software, M.H. and K.R.; investigation, M.H., M.M., D.T. and R.S.; writing—original draft preparation, M.H. and R.S.; writing—review and editing, M.H. and R.S.; supervision, D.T. and R.S.; funding acquisition, D.T. and R.S. All authors have read and agreed to the published version of the manuscript.

Funding

The research project was carried out in the framework of the industrial collective research program (IGF no. 20638 BG). It was supported by the Federal Ministry for Economic Affairs and Climate Action (BMWK) through the AiF (German Federation of Industrial Research Associations eV), based on a decision taken by the German Bundestag. Simulations were performed with computing resources granted by RWTH Aachen University under project bund0013.

Acknowledgments

The authors also thank our project partners Christian Hasse and Bich-Diep Nguyen (TU Darmstadt), for their valuable contribution to the OpenFOAM-9 implementations of the solver and for providing the post-processing tool for the virtual Schlieren images.

Conflicts of Interest

The authors declare no conflict of interest.

Abbreviations

The following nomenclature is used in this manuscript
a min , max , B Model constants for C α (-)
bBlade width(m)
c Velocity vector(m s 1 )
C α & C β Switching functions(-)
c c Compression velocity(m s 1 )
dDiameter(m)
d 32 Sauter mean diameter(m)
HPump head(m)
kTurbulence kinetic energy(m2 s 2 )
lLine length(m)
MMomentum transfer terms(kg m s 2 )
M s Surface tension force(kg m s 2 )
nRotational speed(s 1 )
n q Specific speeds 1 )
n B Number density function(-)
N s Nondimensional specific speed(-)
pPressure(Pa)
QVolume flow rate(m3 s 1 )
R e f f Effective stress tensor(kg m s 2 )
sTip gap height(m)
y w + Nondimensional wall distance(-)
α Volume fraction(-)
ε Inlet air volume fraction(-)
ω Specific dissipation(s 1 )
ρ Density(kg m 3 )
Divergence operator(-)
Subscripts
2Discharge area
aair
BBubble
maxMaximum
optBest efficiency operating point
tTotal
wWater
φ Phase
The following abbreviations are used in this manuscript
2Dtwo-dimensional
3Dthree-dimensional
CFDComputational fluid dynamics
EE2FEuler-Euler two-fluid
ExpExperimental result
G1 & G2Computational grids
H2PHybrid two-phase
PBMPopulation balance modeling
SASScale-adaptive simulation
URANSUnsteady Reynolds-averaged Navier-Stokes
VOFVolume-of-Fluid

References

  1. Mansour, M.; Wunderlich, B.; Thévenin, D. Effect of tip clearance gap and inducer on the transport of two-phase air-water flows by centrifugal pumps. Exp. Therm. Fluid Sci. 2018, 99, 487–509. [Google Scholar] [CrossRef]
  2. Murakami, M.; Minemura, K. Effects of Entrained Air on the Performance of a Centrifugal Pump: 1st Report, Performance and Flow Conditions. Bull. JSME 1974, 17, 1047–1055. [Google Scholar] [CrossRef]
  3. Poelma, C. Measurement in opaque flows: A review of measurement techniques for dispersed multiphase flows. Acta Mech. 2020, 231, 2089–2111. [Google Scholar] [CrossRef] [PubMed]
  4. Perissinotto, R.M.; Monte Verde, W.; Biazussi, J.L.; Bulgarelli, N.A.V.; Fonseca, W.D.P.; de Castro, M.S.; de Moraes Franklin, E.; Bannwart, A.C. Flow visualization in centrifugal pumps: A review of methods and experimental studies. J. Pet. Sci. Eng. 2021, 203, 108582. [Google Scholar] [CrossRef]
  5. Yin, J.; Zhang, T.; Krull, B.; Meller, R.; Schlegel, F.; Lucas, D.; Wang, D.; Liao, Y. A CFD approach for the flow regime transition in a vane-type gas-liquid separator. Int. J. Multiph. Flow 2023, 159, 104320. [Google Scholar] [CrossRef]
  6. de Santis, A.; Hanson, B.C.; Fairweather, M. Hydrodynamics of annular centrifugal contactors: A CFD analysis using a novel multiphase flow modelling approach. Chem. Eng. Sci. 2021, 242, 116729. [Google Scholar] [CrossRef]
  7. Hundshagen, M.; Rave, K.; Nguyen, B.D.; Popp, S.; Hasse, C.; Mansour, M.; Thévenin, D.; Skoda, R. Two-Phase Flow Simulations of Liquid/Gas Transport in Radial Centrifugal Pumps with Special Emphasis on the Transition From Bubbles to Adherent Gas Accumulations. ASME J. Fluids Eng. 2022, 144, 101202. [Google Scholar] [CrossRef]
  8. Stel, H.; Ofuchi, E.M.; Alves, R.F.; Chiva, S.; Morales, R.E.M. Experimental Analysis of Gas–Liquid Flows in a Centrifugal Rotor. ASME J. Fluids Eng. 2020, 142, 031101. [Google Scholar] [CrossRef]
  9. Stel, H.; Ofuchi, E.M.; Chiva, S.; Morales, R.E. Numerical simulation of gas-liquid flows in a centrifugal rotor. Chem. Eng. Sci. 2020, 221, 115692. [Google Scholar] [CrossRef]
  10. He, D.; Ge, Z.; Bai, B.; Guo, P.; Luo, X. Gas–Liquid Two-Phase Performance of Centrifugal Pump Under Bubble Inflow Based on Computational Fluid Dynamics–Population Balance Model Coupling Model. ASME J. Fluids Eng. 2020, 142, 081402. [Google Scholar] [CrossRef]
  11. Zhang, F.; Zhu, L.; Chen, K.; Yan, W.; Appiah, D.; Hu, B. Numerical Simulation of Gas–Liquid Two-Phase Flow Characteristics of Centrifugal Pump Based on the CFD–PBM. Mathematics 2020, 8, 769. [Google Scholar] [CrossRef]
  12. Parikh, T.; Mansour, M.; Thévenin, D. Investigations on the effect of tip clearance gap and inducer on the transport of air-water two-phase flow by centrifugal pumps. Chem. Eng. Sci. 2020, 218, 115554. [Google Scholar] [CrossRef]
  13. Mansour, M.; Wunderlich, B.; Thévenin, D. Experimental Study of Two-Phase Air/Water Flow in a Centrifugal Pump Working with a Closed or a Semi-Open Impeller. In Proceedings of the ASME Turbo Expo 2018: Turbine Technical Conference and Exposition, Oslo, Norway, 11–15 June 2018. [Google Scholar] [CrossRef]
  14. Mansour, M.; Parikh, T.; Thévenin, D. Influence of the shape of the impeller blade trailing edge on single and two-phase air water flows in a centrifugal pump. In Proceedings of the Turbomachinery & Pump Symposia, Housten, TX, USA, 13–16 December 2020. [Google Scholar]
  15. Mansour, M.; Kopparthy, S.; Thévenin, D. Investigations on the effect of rotational speed on the transport of air-water two-phase flows by centrifugal pumps. Int. J. Heat Fluid Flow 2022, 94, 108939. [Google Scholar] [CrossRef]
  16. Schäfer, T.; Bieberle, A.; Neumann, M.; Hampel, U. Application of gamma-ray computed tomography for the analysis of gas holdup distributions in centrifugal pumps. Flow Meas. Instrum. 2015, 46, 262–267. [Google Scholar] [CrossRef]
  17. Schäfer, T.; Neumann-Kipping, M.; Bieberle, A.; Bieberle, M.; Hampel, U. Ultrafast X-Ray Computed Tomography Imaging for Hydrodynamic Investigations of Gas–Liquid Two-Phase Flow in Centrifugal Pumps. ASME J. Fluids Eng. 2020, 142, 041502. [Google Scholar] [CrossRef]
  18. Neumann, M.; Schäfer, T.; Bieberle, A.; Hampel, U. An Experimental Study on the Gas Entrainment in Horizontally and Vertically Installed Centrifugal Pumps. ASME J. Fluids Eng. 2016, 138, 12–19. [Google Scholar] [CrossRef]
  19. Gambao, J.; Prado, M.G. Visualization study of performance breakdown in two-phase performance of an electrical submersible pump. In Twenty-Sixth International Pump User Symposium, Texas, USA; Springer: Berlin/Heidelberg, Germany, 2010. [Google Scholar] [CrossRef]
  20. Barrios, L.; Prado, M.G. Experimental Visualization of Two-Phase Flow Inside an Electrical Submersible Pump Stage. J. Energy Resour. Technol. 2011, 133, 042901. [Google Scholar] [CrossRef]
  21. Trevisan, F.E.; Prado, M. Experimental Investigation of the Viscous Effect on Two-Phase-Flow Patterns and Hydraulic Performance of Electrical Submersible Pumps. J. Can. Pet. Technol. 2011, 50, 45–52. [Google Scholar] [CrossRef]
  22. Monte Verde, W.; Biazussi, J.L.; Sassim, N.A.; Bannwart, A.C. Experimental study of gas-liquid two-phase flow patterns within centrifugal pumps impellers. Exp. Therm. Fluid Sci. 2017, 85, 37–51. [Google Scholar] [CrossRef]
  23. Shao, C.; Li, C.; Zhou, J. Experimental investigation of flow patterns and external performance of a centrifugal pump that transports gas-liquid two-phase mixtures. Int. J. Heat Fluid Flow 2018, 71, 460–469. [Google Scholar] [CrossRef]
  24. Zhao, L.; Chang, Z.; Zhang, Z.; Huang, R.; He, D. Visualization of gas-liquid flow pattern in a centrifugal pump impeller and its influence on the pump performance. Meas. Sens. 2021, 13, 100033. [Google Scholar] [CrossRef]
  25. Yan, S.; Sun, S.; Luo, X.; Chen, S.; Li, C.; Feng, J. Numerical Investigation on Bubble Distribution of a Multistage Centrifugal Pump Based on a Population Balance Model. Energies 2020, 13, 908. [Google Scholar] [CrossRef]
  26. Si, Q.; Asad, A.; Wang, B.; Wang, P.; Bois, G.; Jianping, Y.; Kubar, A.A. Numerical Study on Gas-Liquid Two Phase Flow Characteristic of Multistage Electrical Submersible Pump by Using a Novel Multiple-Size Group (MUSIG) Model. Phys. Fluids 2022, 34, 063311. [Google Scholar] [CrossRef]
  27. Chen, Y.; Patil, A.; Chen, Y.; Bai, C.; Wang, Y.; Morrison, G. Numerical Study on the First Stage Head Degradation in an Electrical Submersible Pump With Population Balance Model. J. Energy Resour. Technol. 2019, 141, 022003. [Google Scholar] [CrossRef]
  28. Simon, L. Application of the MUSIG model to bubbly flows. AEAT-1096 AEA Technol. 1996, 230, 826. [Google Scholar]
  29. Liao, M.; Si, Q.; Fan, M.; Wang, P.; Liu, Z.; Yuan, S.; Cui, Q.; Bois, G. Experimental Study on Flow Behavior of Unshrouded Impeller Centrifugal Pumps under Inlet Air Entrainment Condition. Int. J. Turbomach. Propuls. Power 2021, 6, 31. [Google Scholar] [CrossRef]
  30. Egorov, Y.; Menter, F. Development and Application of SST-SAS Turbulence Model in the DESIDER Project. In Advances in Hybrid RANS-LES Modelling; Peng, S.H., Haase, W., Eds.; Notes on Numerical Fluid Mechanics and Multidisciplinary Design; Springer: Berlin/Heidelberg, Germany, 2008; Volume 97, pp. 261–270. [Google Scholar] [CrossRef]
  31. Hundshagen, M.; Rave, K.; Mansour, M.; Thévenin, D.; Skoda, R. 3D flow simulation by a hybrid two-phase solver for the assessment of liquid/gas transport in a volute-type centrifugal pump with twisted blades. In Proceedings of the 15th European Conference on Turbomachinery Fluid Dynamics & Thermodynamics, Paper n. ETC2023-326. Budapest, Hungary, 24–28 April 2023; Available online: https://www.euroturbo.eu/publications/conference-proceedings-repository/ (accessed on 1 June 2023).
  32. Gülich, J.F. Centrifugal Pumps; Springer: Berlin/Heidelberg, Germany, 2010. [Google Scholar] [CrossRef]
  33. Mansour, M.; Parikh, T.; Thévenin, D. Influence of Blade Pitch and Number of Blades of a Pump Inducer on Single and Two-Phase Flow Performance. In Proceedings of the ASME Turbo Expo 2020, New York, NY, USA, 21–25 September 2020; Volume 9. [Google Scholar] [CrossRef]
  34. Nguyen, B.D.; Popp, S.; Hundshagen, M.; Skoda, R.; Mansour, M.; Thévenin, D.; Hasse, C. Large Eddy Simulations of Turbulent Gas-Liquid Flows in a Diverging Horizontal Channel Using a Hybrid Multiphase Approach. ASME J. Fluids Eng. 2023, 145, 031501. [Google Scholar] [CrossRef]
  35. Wardle, K.E.; Weller, H.G. Hybrid Multiphase CFD Solver for Coupled Dispersed/Segregated Flows in Liquid-Liquid Extraction. Int. J. Chem. Eng. 2013, 2013, 128936. [Google Scholar] [CrossRef]
  36. Müller, T.; Limbach, P.; Skoda, R. Numerical 3D RANS Simulation of Gas-Liquid Flow in a Centrifugal Pump with an Euler-Euler Two-Phase Model and a Dispersed Phase Distribution. In Proceedings of the 11th European Conference on Turbomachinery Fluid Dynamics & Thermodynamics, Madrid, Spain, 23–27 March 2015. [Google Scholar]
  37. Schiller, L.; Naumann, A. Über die grundlegenden Berechnungen bei Schwerkraftaufbereitung. Z. Vereines Dtsch. Ingenieure 1933, 77, 318–321. [Google Scholar]
  38. Rzehak, R.; Krepper, E.; Liao, Y.; Ziegenhein, T.; Kriebitzsch, S.; Lucas, D. Baseline Model for the Simulation of Bubbly Flows. Chem. Eng. Technol. 2015, 38, 1972–1978. [Google Scholar] [CrossRef]
  39. Brackbill, J.; Kothe, D.; Zemach, C. A continuum method for modeling surface tension. J. Comput. Phys. 1992, 100, 335–354. [Google Scholar] [CrossRef]
  40. Hänsch, S.; Lucas, D.; Krepper, E.; Höhne, T. A multi-field two-fluid concept for transitions between different scales of interfacial structures. Int. J. Multiph. Flow 2012, 47, 171–182. [Google Scholar] [CrossRef]
  41. Kumar, S.; Ramkrishna, D. On the solution of population balance equations by discretization—I. A fixed pivot technique. Chem. Eng. Sci. 1996, 51, 1311–1332. [Google Scholar] [CrossRef]
  42. Prince, M.J.; Blanch, H.W. Bubble coalescence and break-up in air-sparged bubble columns. AIChE J. 1990, 36, 1485–1499. [Google Scholar] [CrossRef]
  43. Luo, H.; Svendsen, H.F. Theoretical model for drop and bubble breakup in turbulent dispersions. AIChE J. 1996, 42, 1225–1233. [Google Scholar] [CrossRef]
  44. Liao, Y.; Rzehak, R.; Lucas, D.; Krepper, E. Baseline closure model for dispersed bubbly flow: Bubble coalescence and breakup. Chem. Eng. Sci. 2015, 122, 336–349. [Google Scholar] [CrossRef]
  45. Menter, F. Two-equation eddy-viscosity turbulence models for engineering applications. AIAA J. 1994, 32, 1598–1605. [Google Scholar] [CrossRef]
  46. Kalitzin, G.; Medic, G.; Iaccarino, G.; Durbin, P. Near-wall behavior of RANS turbulence models and implications for wall functions. J. Comput. Phys. 2005, 204, 265–291. [Google Scholar] [CrossRef]
  47. Jasak, H. Error Analysis and Estimation for the Finite Volume Method with Applications to Fluid Flows. Ph.D. Thesis, Imperial College of Science, Technology and Medicine, London, UK, 1996. [Google Scholar]
  48. Patankar, S.; Spalding, D. A calculation procedure for heat, mass and momentum transfer in three-dimensional parabolic flows. Int. J. Heat Mass Transfer 1972, 15, 1787–1806. [Google Scholar] [CrossRef]
  49. Travin, A.; Shur, M.; Strelets, M.; Spalart, P.R. Physical and Numerical Upgrades in the Detached-Eddy Simulation of Complex Turbulent Flows. In Advances in LES of Complex Flows; Moreau, R., Friedrich, R., Rodi, W., Eds.; Fluid Mechanics and Its Applications; Springer: Dordrecht, The Netherlands, 2002; Volume 65, pp. 239–254. [Google Scholar] [CrossRef]
  50. Weller, H. Controlling the Computational Modes of the Arbitrarily Structured C Grid. Mon. Weather. Rev. 2012, 140, 3220–3234. [Google Scholar] [CrossRef]
  51. Warming, R.F.; Beam, R.M. Upwind Second-Order Difference Schemes and Applications in Aerodynamic Flows. AIAA J. 1976, 14, 1241–1249. [Google Scholar] [CrossRef]
  52. Sweby, P.K. High Resolution Schemes Using Flux Limiters for Hyperbolic Conservation Laws. SIAM J. Numer. Anal. 1984, 21, 995–1011. [Google Scholar] [CrossRef]
  53. Casimir, N.; Zhu, X.; Hundshagen, M.; Ludwig, G.; Skoda, R. Numerical Study of Rotor–Stator Interaction of a Centrifugal Pump at Part Load With Special Emphasis on Unsteady Blade Load. ASME J. Fluids Eng. 2020, 142, 081203. [Google Scholar] [CrossRef]
  54. Hundshagen, M.; Casimir, N.; Pesch, A.; Falsafi, S.; Skoda, R. Assessment of scale-adaptive turbulence models for volute-type centrifugal pumps at part load operation. Int. J. Heat Fluid Flow 2020, 85, 108621. [Google Scholar] [CrossRef]
Figure 1. Test-rig (a) and photograph of the test-rig (b).
Ijtpp 08 00028 g001
Figure 2. Sketch of the meridional view of the semi-open impeller.
Ijtpp 08 00028 g002
Figure 3. Pump head performance map and flow regimes observed in the experiments. The operation points investigated in the simulations are marked with an “X”.
Ijtpp 08 00028 g003
Figure 4. Explosion view of the computational domain.
Ijtpp 08 00028 g004
Figure 5. Plots of time-averaged air volume fraction α a ¯ along arbitrarily chosen lines in the middle of a blade-to-blade surface near the hub, midspan, and shroud for the ε = 3 % operation point.
Ijtpp 08 00028 g005
Figure 6. Comparison between virtually-derived Schlieren images (left) and experimental results of a grey-scale analysis from the front view (middle) and isometric view (right) for ε = 1 % (a), ε = 3 % (b), and ε = 9 % (c). Similarities between simulation results and measurement data are marked by red and blue arrows.
Ijtpp 08 00028 g006
Figure 7. Contour plots at impeller’s midspan for time-averaged air volume fraction α ¯ a (a) and its temporal standard deviation α a,RMS (b) for ε = 1 % , ε = 3 % , and ε = 9 % simulation results.
Ijtpp 08 00028 g007
Figure 8. Contour plots of Sauter mean diameter at impeller’s midspan for ε = 1 % (a), ε = 3 % (b), and ε = 9 % (c) simulation results.
Ijtpp 08 00028 g008
Figure 9. Time-averaged two-phase pump head H ¯ versus inlet air volume fraction ε .
Ijtpp 08 00028 g009
Table 1. Discretization schemes of the simulations.
TermScheme
Time discretizationFirst-order implicit Euler
Discretization of convective terms (momentum eqns.)Second-order hybrid scheme [49]: LUST scheme of Weller [50] (Scale-resolving region) or Second-Order upwind of Warming & Beam [51] (URANS region)
Discretization of convective terms (phase fraction eqns.)Second-order TVD with limiter of Sweby [52] (phase interface) or first-order upwind (disperse flow region)
Discretzsation of convective terms (size fraction eqns.)Second-order TVD with limiter of Sweby [52]
Discretization of convective terms (k and ω eqns.)First-order upwind
Table 2. Computational grid data.
Name# of Cells ( 10 6 )# of Tip Gap Cells y w,Blade + y w,Volute + Non-Orthogonality
G13.57276<70
G232.21493<70
Disclaimer/Publisher’s Note: The statements, opinions and data contained in all publications are solely those of the individual author(s) and contributor(s) and not of MDPI and/or the editor(s). MDPI and/or the editor(s) disclaim responsibility for any injury to people or property resulting from any ideas, methods, instructions or products referred to in the content.

