1. Introduction
The pursuit of performance and efficiency in aero-engines has led to short, compressed engine architectures, with outlet guide vanes (OGVs) placed closer to the fan and downstream obstructions within the low-pressure system. This has necessitated OGVs being arranged in non-axisymmetric assemblies with individually staggered and cambered blades. Under certain off-design conditions, the aerodynamic instability, known as OGV buffet, can occur on individual blades. This results in buffeting: the structural response to the aerodynamic excitations [
1]. This work was originally presented in the conference proceedings of the 14th European Conference on Turbomachinery Fluid dynamics and Thermodynamics [
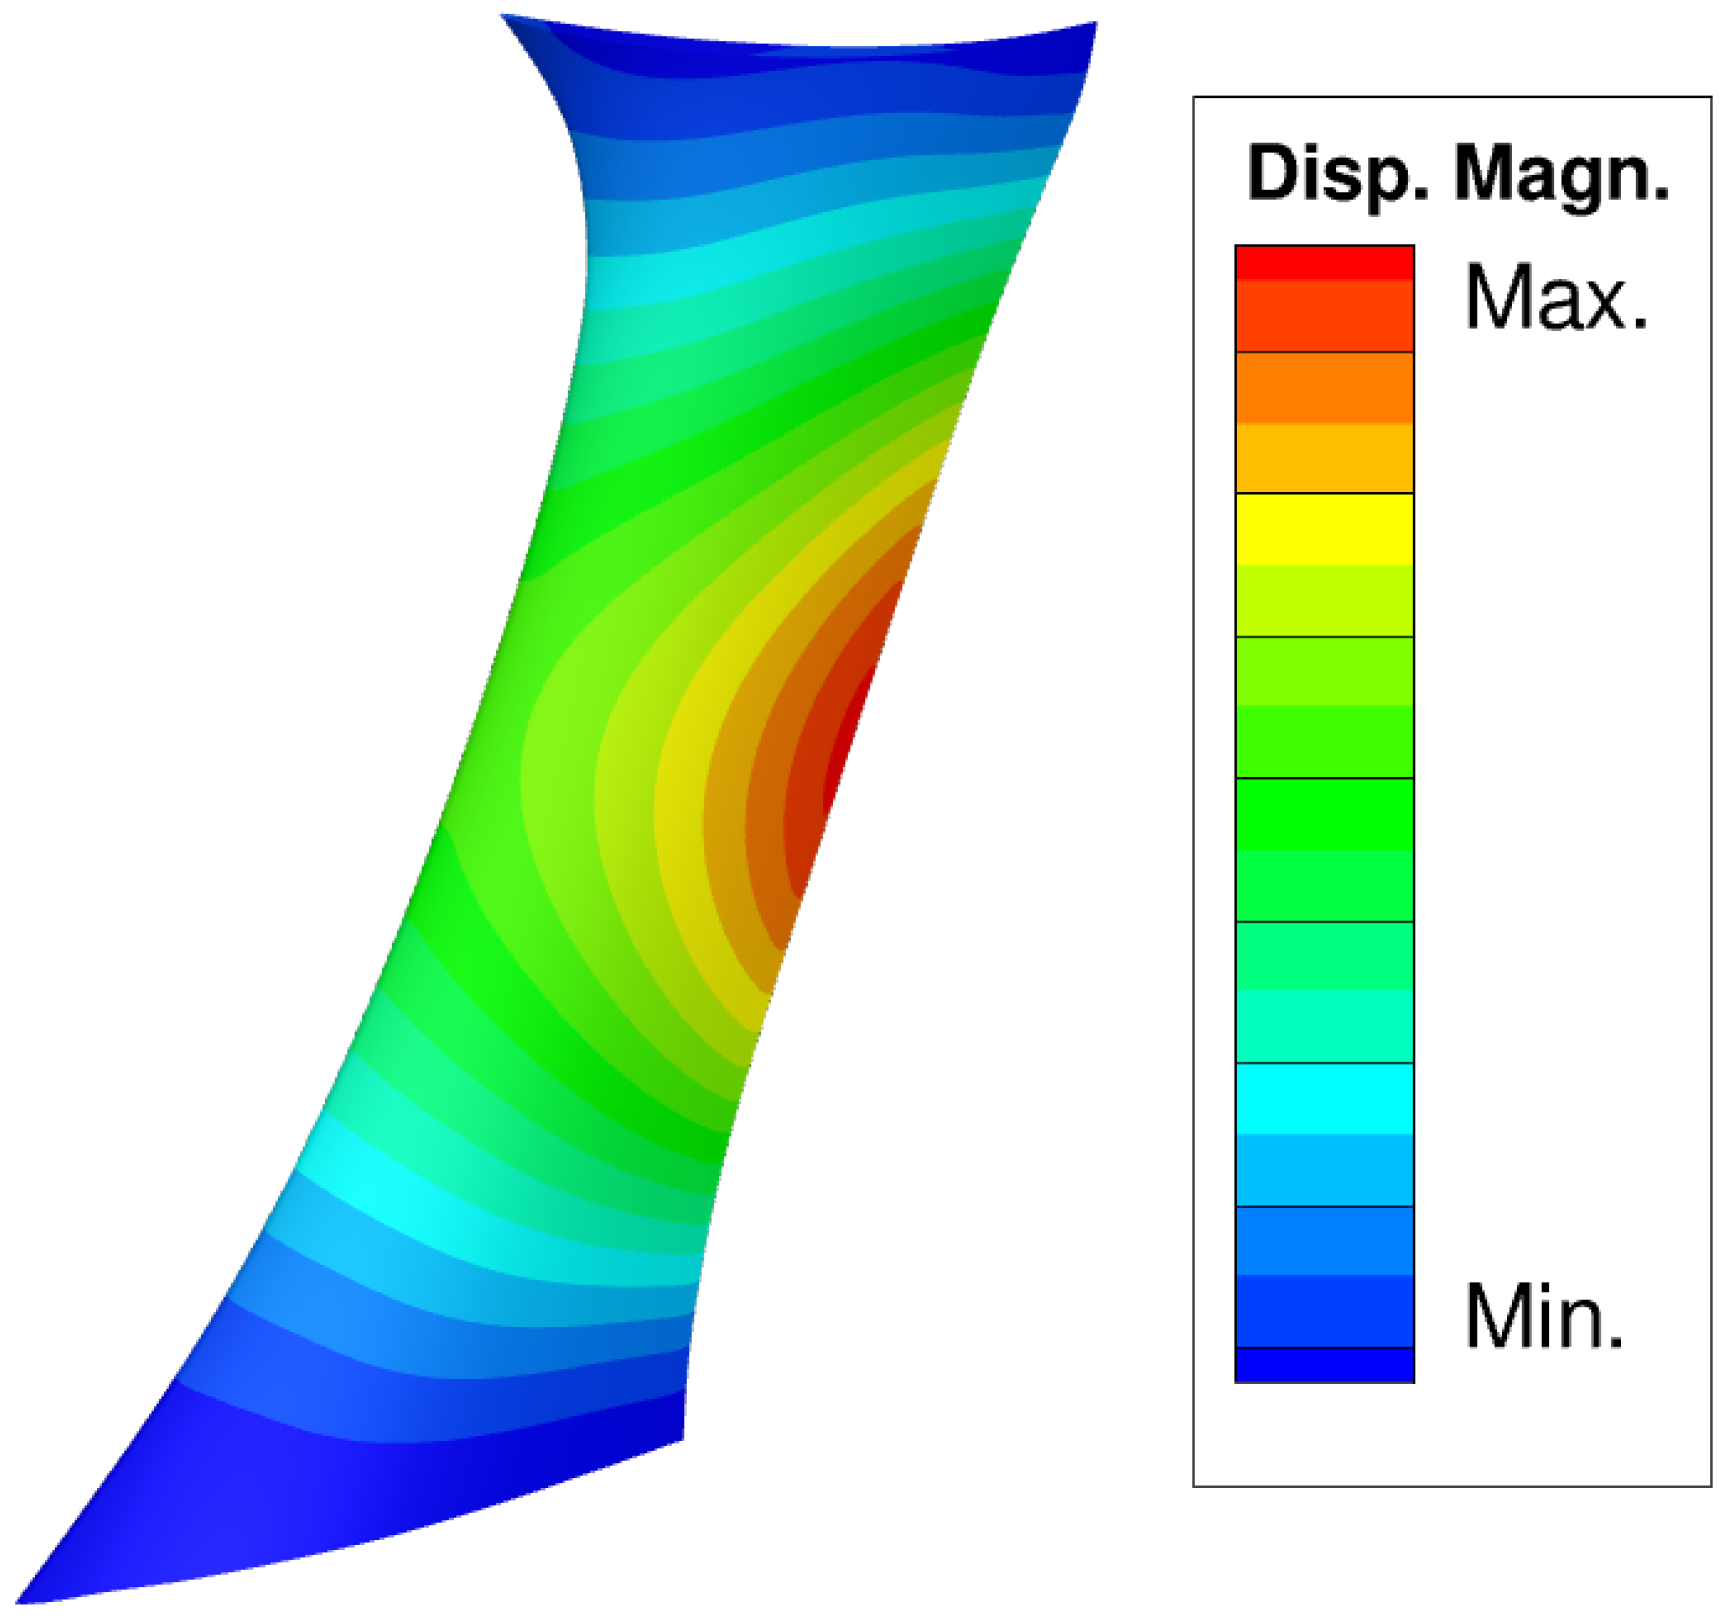
2]. Buffeting is suspected to be the cause of high levels of asynchronous (non-integer multiples of rotational frequency) vibrations detected in off-design tests of a large civil turbofan. The vibration occurred in the first bow mode and high amplitudes were limited to a single vane. The modal displacements in
Figure 1 show that the bow mode is most susceptible to excitation at midspan, toward the trailing edge. The vibrations occurred at a high mass flow condition, where the fan was running at a fan-tip Mach number (
) of
= 1.14, which we will refer to as the “datum engine speed”. The simulated fan constant speed characteristic of the datum engine speed is show in green in
Figure 2, with the experimental buffeting region highlighted in pink. The vibrations had a reduced frequency of approximately 0.34. The reduced frequency (
k) was calculated in line with Equation (
1) using angular frequency (
), OGV semi-chord (
b) and mass-averaged inlet velocity (
U).
Previous work used unsteady simulations of a single passage OGV to understand the cause of OGV buffeting. ‘Buffeting’ refers to the structural response and is distinct to the term ‘buffet’, which pertains to the responsible aerodynamic excitations due to instabilities [
1]. The unsteady pressure fluctuations of buffet cause these dangerous buffeting structural vibrations, which can lead to the destruction of turbomachinery blades [
3].
The previous study indicated that the specific instability responsible for the phenomenon in OGVs is transonic buffet [
4]. Typically associated with external aerodynamics, transonic buffet is a flow instability characterised by large-scale, periodic shock motion and a fluctuating shock-induced separation, growing in phase as the shock moves forward and shrinking as it retreats [
5]. Transonic buffet occurs when a strong shock-wave–boundary-layer interaction (SBLI) causes the boundary layer to thicken and separate [
6]. The shock-induced separation increases in size and spreads to the trailing edge and is followed by unstable self-sustaining shock motion [
1].
Figure 3 shows an example flow field from a steady solution of a buffeting operating point. The previous study revealed a highly 3D phenomenon, incorporating shock movement with chordwise and radial components, a linked fluctuating separation region and substantial hub separation. Unsteady simulations produced relatively noisy forcing signals, with a dominant frequency very close to that recorded during engine testing. Importantly, the simulations showed that forcing was highest at the experimental engine speed. The simulated operating map and buffet boundary are shown in
Figure 2, with buffet occurring on the choke side of the marked buffet boundary. The datum engine speed exhibited the highest amplitude forcing of the bow mode, increasing toward the buffet boundary. Despite being purely aerodynamic and without structural motion, the frequencies of the vibrations were very close to the bow mode frequency.
Similar to the 2D supercritical airfoil experiments of Lee, our 3D simulations found that operating points closest to the buffet boundary provided the highest forcing [
7]. In their paper, Lee found that fluctuating normal forces were greatest near the buffet onset and decreased moving further into the buffeting conditions. This paper sets out to achieve a more fundamental understanding of OGV buffeting by moving to a quasi-2D domain and conducting parametric studies of the inlet Mach number and incidence angle.
2. Materials and Methods
The simulations presented here were completed using the steady and unsteady Reynolds-averaged Navier–Stokes (RANS and URANS) solver AU3D. This is the in-house solver of the Imperial Vibration University Technology Centre (VUTC) created and validated for use in turbomachinery settings with aeroelastic capability developed over the last 25 years [
8,
9,
10]. For this study, the RANS and URANS equations were solved using an implicit scheme that is second-order accurate in space and first-order accurate in time. Turbulence modelling was provided by a modified Spalart–Allmaras (SA) one-equation model, and all simulations were run using wall functions to treat the boundary layer. Iovnovich and Raveh show that the SA model provides a good level of accuracy in buffet simulations, with Thiery and Coustols proving it to be suitable for 2D buffet simulations [
11,
12]. Thiery and Coustols say that, in the case of transonic buffet, the time-scales of the wall-bounded turbulence and shock oscillations are so different that the turbulence can be left to modelling. Aerodynamic modal forcing was computed using unsteady pressure histories from the flow solver, as detailed in [
13].
Figure 4 summarises the structure of the 2D domain and its origins in the low pressure system. To construct the 2D domain, the OGV airfoil section at midspan was extracted and meshed in a Cartesian domain using the Altair program HyperMesh. The circumferential width of this slice, presented in the profile view of
Figure 4, was based on the OGV pitch at midspan, terminating in y-periodic surfaces. The spanwise extent of the quasi-2D domain is 4% chord resolved with 11 mesh layers connected by structured mesh and terminating in z-periodic boundaries, as shown in
Figure 4. The central 2D layer was used to extract all simulation data. The resolution and distribution of nodes in a radial slice were based on previous best practice and produced a Cartesian 2D OGV slice with approximately 20,000 nodes, down from 21,300 used in the layers of the annular 3D domain. The close-up in
Figure 4 shows the construction of the unstructured airfoil mesh. Having constructed the OGV domain, a straight coarsening duct was attached approximating the length of the low pressure system. Riemann invariant inlet and outlet boundary conditions and the coarsening duct were used to eliminate numerical reflections. As marked on
Figure 4, the OGV inlet surface provides total pressure, total temperature and flow angle boundary conditions, with the outlet surface of the coarsening duct setting a static pressure boundary condition. The periodic set-up meant that all unsteadiness was axisymmetric and not propagating circumferentially, but this was considered satisfactory, as engine testing data indicate that OGV buffet is a local phenomenon. An example simulation with wall functions confirmed that over 80% of node non-dimensional wall distance (
) values were between 12 and 100, with a mean of 48.
The quasi-2D domain grid was used for all steady RANS and URANS simulations. The datum boundary conditions were derived from area-averaged values for the mixing plane data from the 3D case that provided the highest amplitude forcing. This occurred at the buffet boundary of the datum engine speed. The URANS simulations of the parametric studies were started from a converged steady state RANS solution that was second order accurate in space. The URANS time-step, previously subjected to a convergence study for our 3D work, was carried over and provides a temporal resolution of 390 steps per period of experimental buffeting. Total simulation time was set to provide approximately 25 flow-throughs of the 2D domain and produced consistent results. Time histories were individually trimmed to exclude any initial transients in the following analysis.
Airfoil incidence and Mach number are known to influence transonic buffet onset and strength [
7]. Therefore, the core of this paper is based on two parametric studies, varying inlet Mach number (
) with airfoil incidence (
) held constant and vice versa. Incidence was calculated as the difference between the inlet flow angle and metal angle, as shown in
Figure 5. Negative incidences are common in this study due to the high axial velocities.
and
were varied by modifying the specified velocity components of the datum inlet boundary conditions by increasing their resultant magnitude, or their relative magnitude with the resultant held constant, respectively.
For each parametric study, a range of inlet conditions were selected, with increased resolution around the datum values. These operating conditions and the initial 3D-derived datum conditions are summarised in
Table 1. Not all of the parametric study operating points produced unsteady forcing, and were therefore deemed to be buffet-free; these are indicated in
Table 1 but excluded from the following analysis. Two results have been totally excluded for exhibiting the “carbuncle effect”, a numerical instability responsible for the appearance of a small blister-like structure in high Mach number flows [
14].
Figure 5 shows two example full-pitch circumferential cuts of the 2D URANS flow fields of buffeting and non-buffeting (or benign) operating points. The benign flow field has a well-defined shock and minimal TE separation, whereas the buffeting operating point shows many of the characteristics of transonic buffet, including a shock that has shifted in position and a large separation stemming from the base of the shock. The size of this separation also has an effect on the free-stream by decreasing the effective passage area.


