4.1. Stable Operation
A comparison was performed between the signals measured ahead of the rotor for the nondistorted and 60°-screen-distortion cases. The comparison was made using the Dynamic Mode Decomposition (DMD). The DMD was first proposed by [
10], and it is a data-driven method that provides a way to decompose spatio–temporal measurements into a set of dynamic spatio–temporal modes derived from a local linearization of the system dynamics. The modes were limited to the postprocessing of the time-dependent pressure measurements as we did not combine multiple probes to include the spatial information in our DMD analysis.
The measurements of pressure in time were rearranged in a matrix H (Hankel matrix) by shifting them in time according to the number of modes we employed for reproducing each signal. Hence, the number of columns of H was equal to the number of modes that were used to approximate the signal (500 in the study); the number of rows corresponded to the number of time measurements considered in the postprocessed time window (5 s × 100 kS/s).
From the H matrix, two matrices
X1 and
X2 were created,
X2 being the time shifted matrix, and
X1 the matrix of the individual snapshots. The DMD computed the leading eigenmodes of the linear operator A that best advanced the data
X1 to
X2, i.e.,
X2N ≈ A
X1N−1, where N denotes the time of the current snapshot. For N→∞, hence marching continuously in time, the corresponding linear system reads
When subjected to initial condition
, the equation has the solution:
where
and
are the eigenvectors and eigenvalues of the matrix
, while
are the coordinates of
x(0) in the eigenvector basis. Getting back to the analogous time-discrete system with time step
, it yields
with
. Since the
A matrix has generally a very large dimension, instead of computing directly the eigenvalues of
A, we employed a rank-reduced representation of
A. This rank-reduced representation of
A was obtained using Singular Value Decomposition (SVD). The full algorithm employed in our study is explained in more details in [
11].
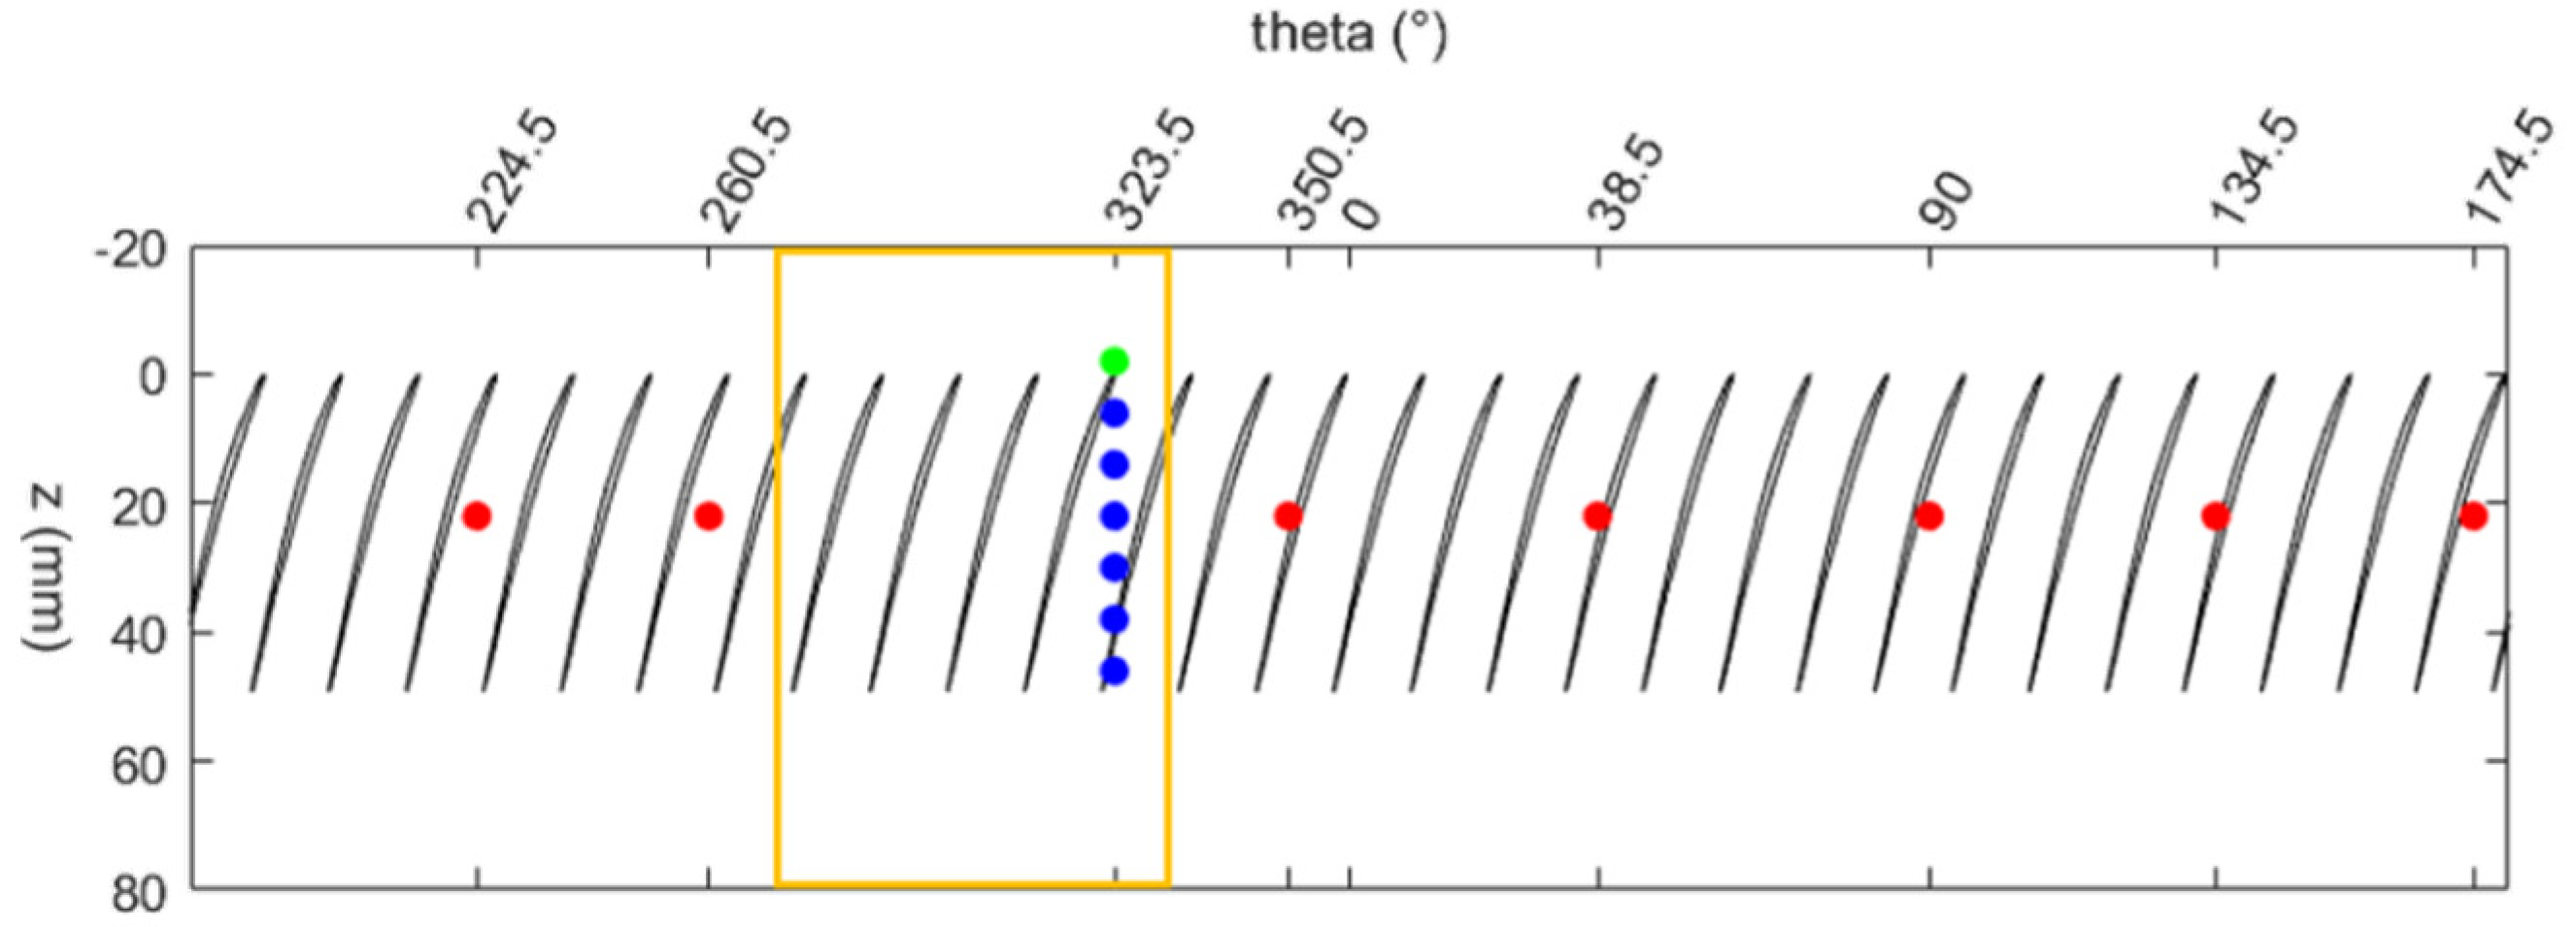
First, DMD was applied to the experimental signals. In the present experiments, two different mass flow rates were chosen and casing static pressure from the sensors placed at
mm (green in
Figure 2) was recorded for 5 s, which was approximatively 265 rotor revolutions. The first mass flow rate was 5 kg/s and it corresponded to a flow coefficient
of 0.506 close to design point.
The second mass flow rate we investigated was 4.2 kg/s and it corresponded to a
of 0.425, i.e., the last stable configuration before the onset of rotating stall in CME2.
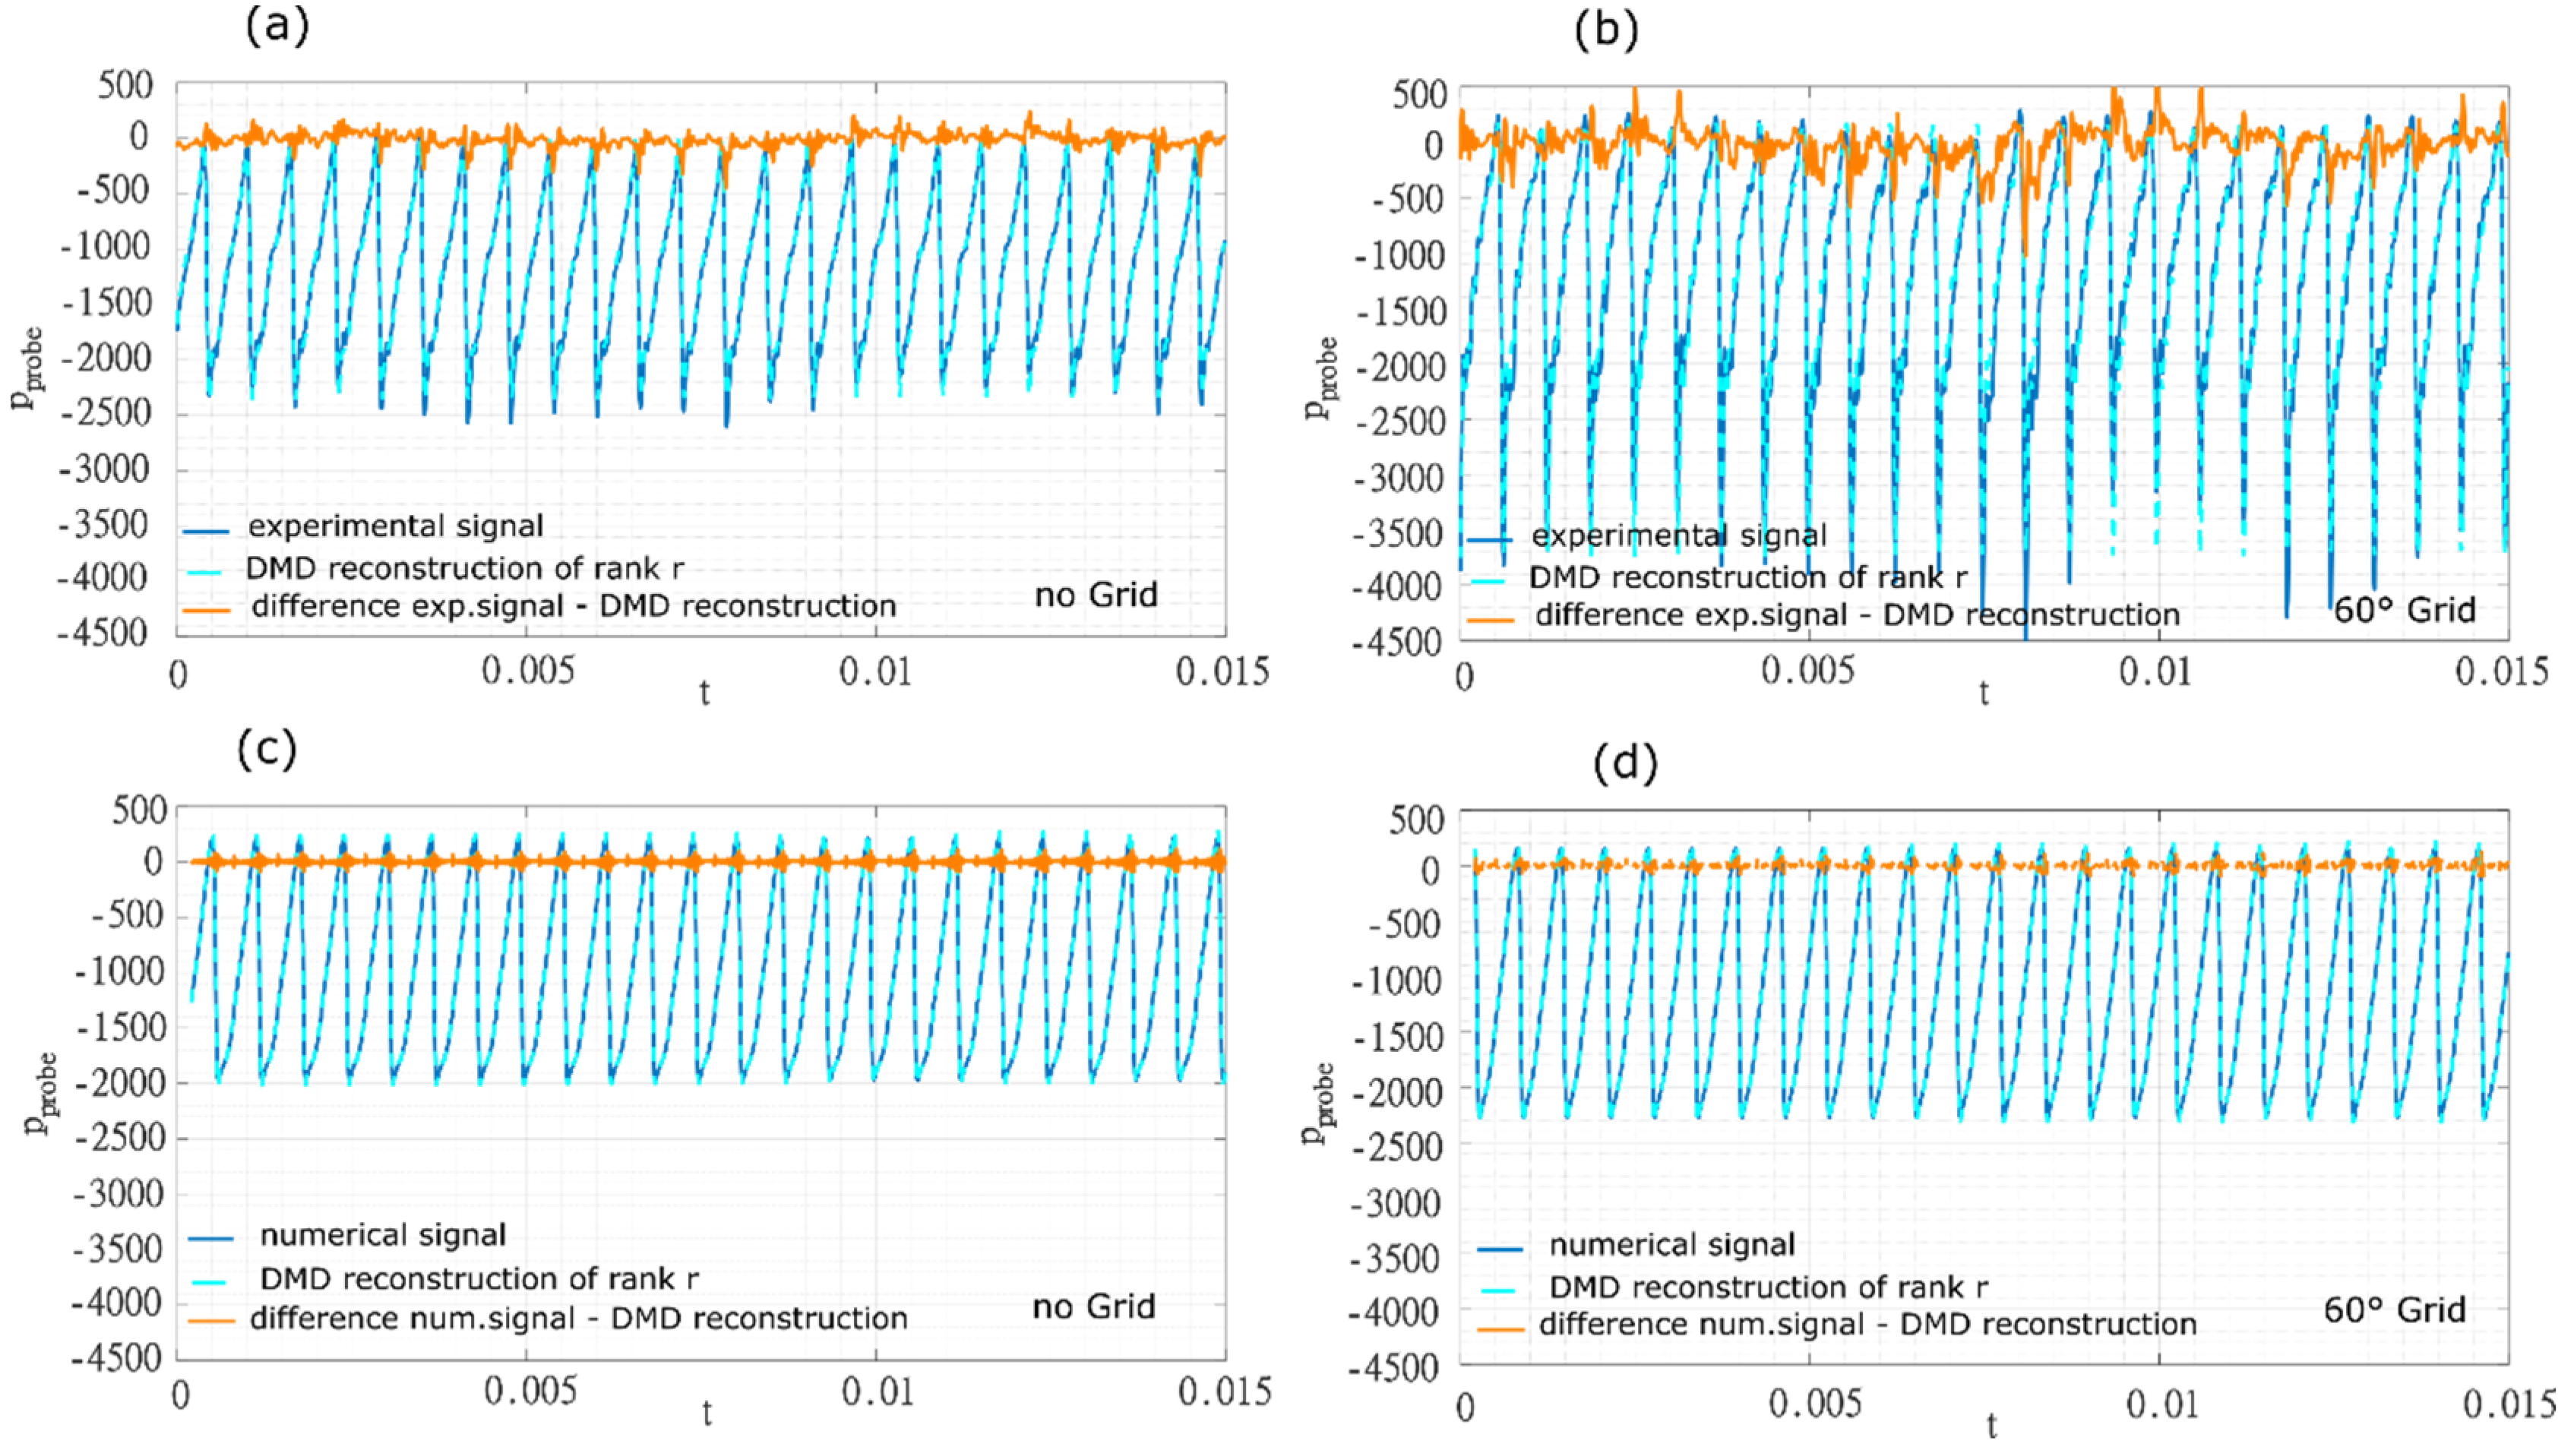
Figure 4a,b depicts the comparison between the DMD reconstruction and the raw signals experimentally obtained. On the same Figure, the error of the DMD reconstruction is plotted in orange. The DMD reconstruction is good, but it loses some accuracy when some nonperiodic peaks occur in the experimental signal at 5 kg/s, and it does not provide an accurate approximation of the grid distorted signal at a mass flow rate of 4.2 kg/s (not represented in
Figure 4) because the signal was strongly nonperiodic.
A partial DMD reconstruction is shown in
Figure 5a,b, where p
DMD indicates the reconstruction with 21 modes, p
1 the first mode reconstruction (the linear least-squares fit of the signal), p
2 the reconstruction up to the second order (linear least-squares fit plus the second mode with its complex conjugate), and so on. In
Figure 5a,b, p
5 and p
9 respectively represent the DMD reconstruction with the minimum number of modes that have an error less or equal to 5% with respect to the DMD with 21 modes.
According to this criterion, the minimum number of DMD modes required to well reproduce the experimental signal was 11 for the nondistorted case at a mass flow rate of 5 kg/s. The required minimum number of modes grew to 19 when the grid was introduced. These additional modes can be partly explained by the presence of a low pressure peak in the signal, a trace of increased blade loading due to the locally reduced mass flow rate behind the grid. But we anticipate that this is not the only effect of the presence of the grid.
The DMD was then applied to numerical signals. The reconstruction (
Figure 4c,d) was very good. For the numerical signals, the required number of DMD modes to well reproduce the signal was 13 no matter the presence of the grid (
Figure 6a,b). Numerical simulations are thus losing some information compared to experiments.
The first qualitative difference between the experimental and numerical signals was the presence of a sharp pressure drop in the experimental signal. Such a feature was not captured by the numerical simulation. A second difference was the presence of high-frequency oscillations in the experimental signal (
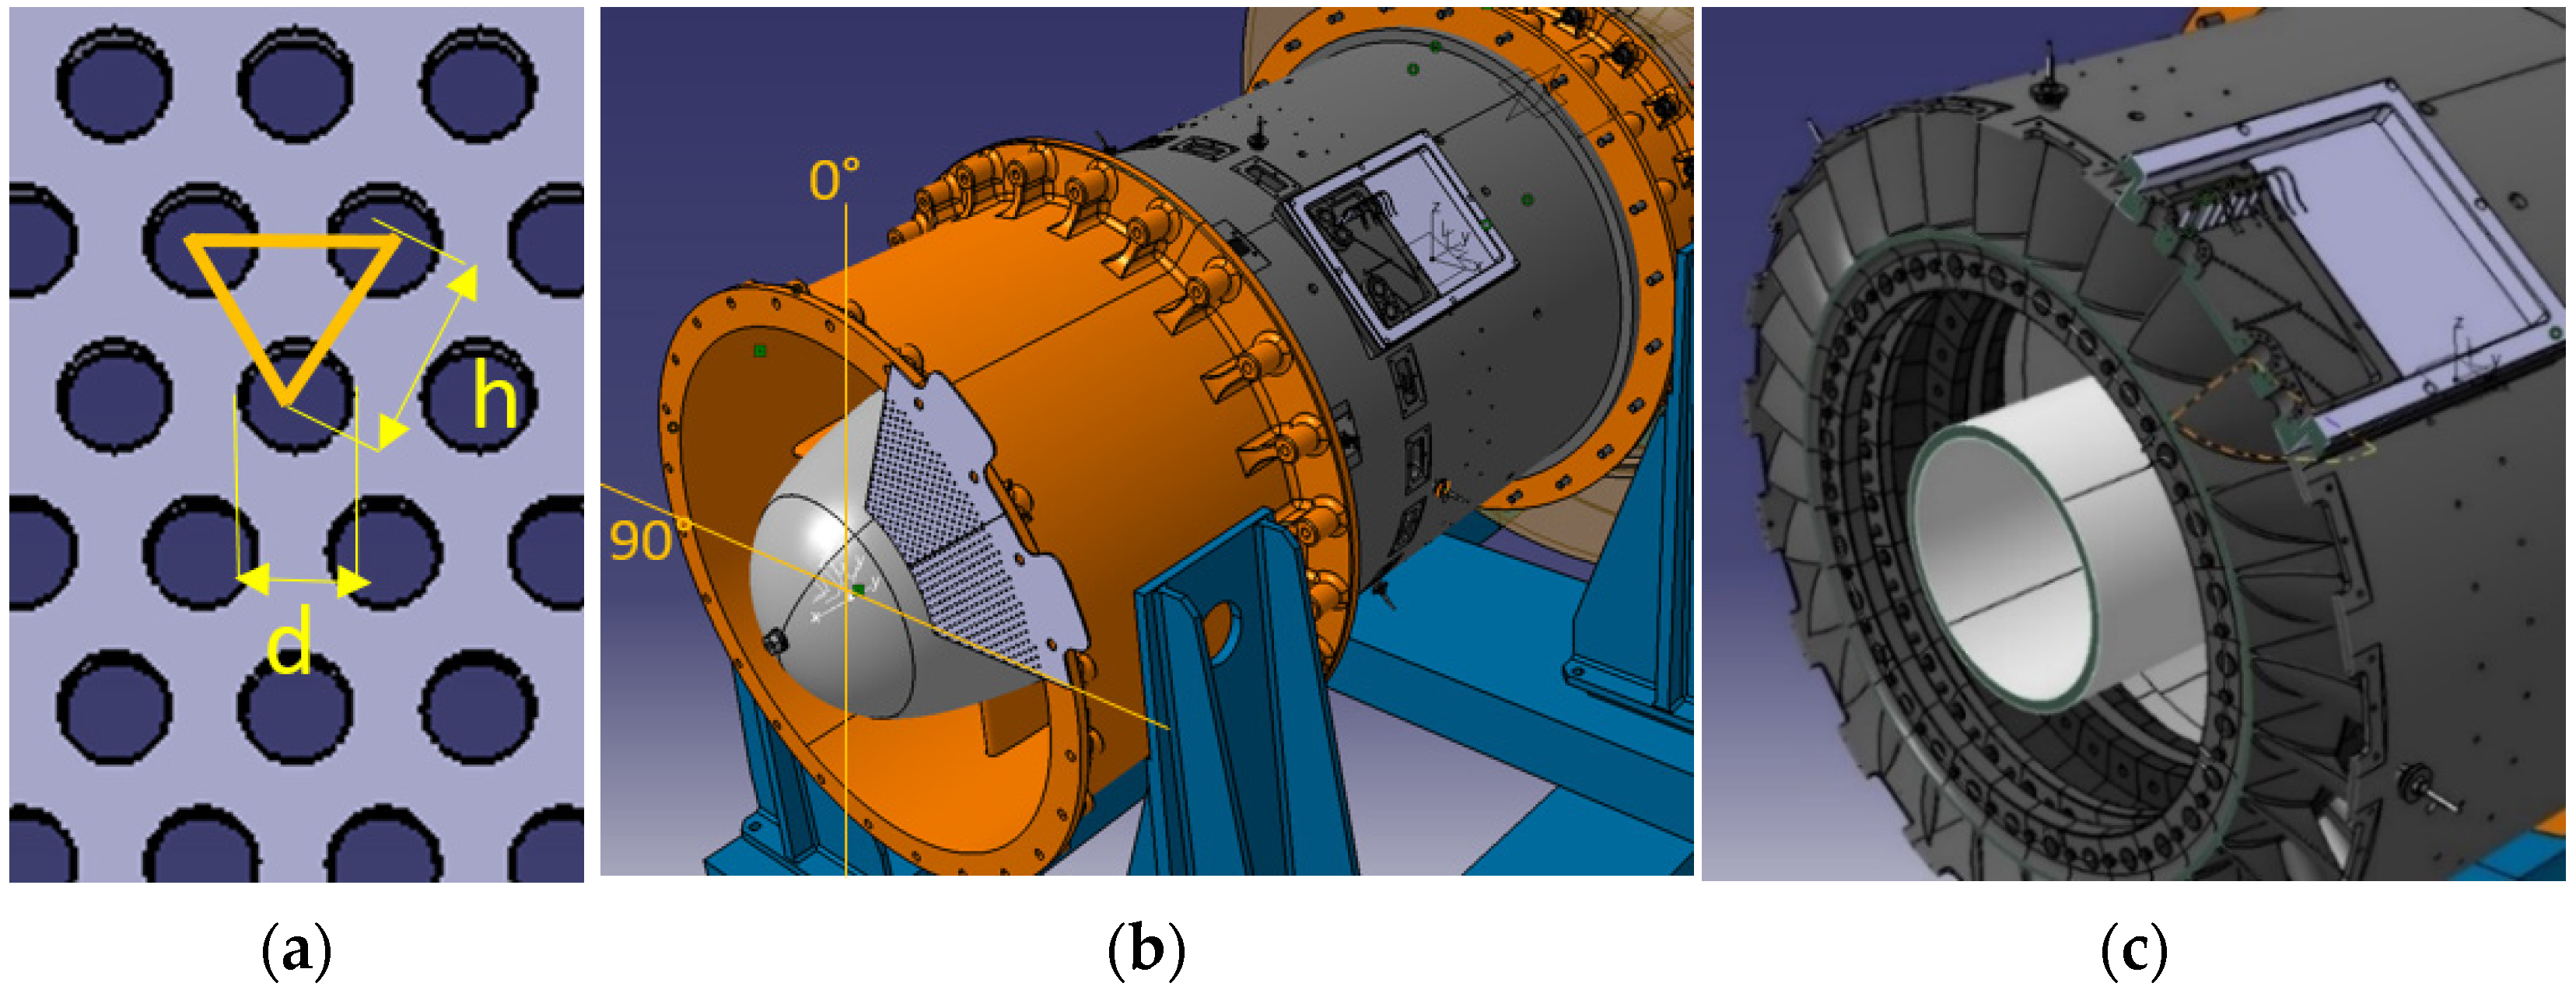
Figure 5b). Modes with 5 and 10 oscillations per blade channel emerged. Their amplitudes were respectively the 25% and 7.5% of the amplitude of the main harmonic. Such modes can be related to the jets created by the holes of the grid. The blade channel measures 57 mm and the distance between the holes is 5 mm so that there are 11 holes per blade channel. This feature already highlights the limitation of using a grid to reproduce a generic distortion since the grid geometry introduces in the flow some characteristic scales that are not existing in other types of distortion. Consistently, the comparison between
Figure 5 and
Figure 6 shows that an inlet total pressure drop is too simplistic for modeling a screen-generated distortion.
In
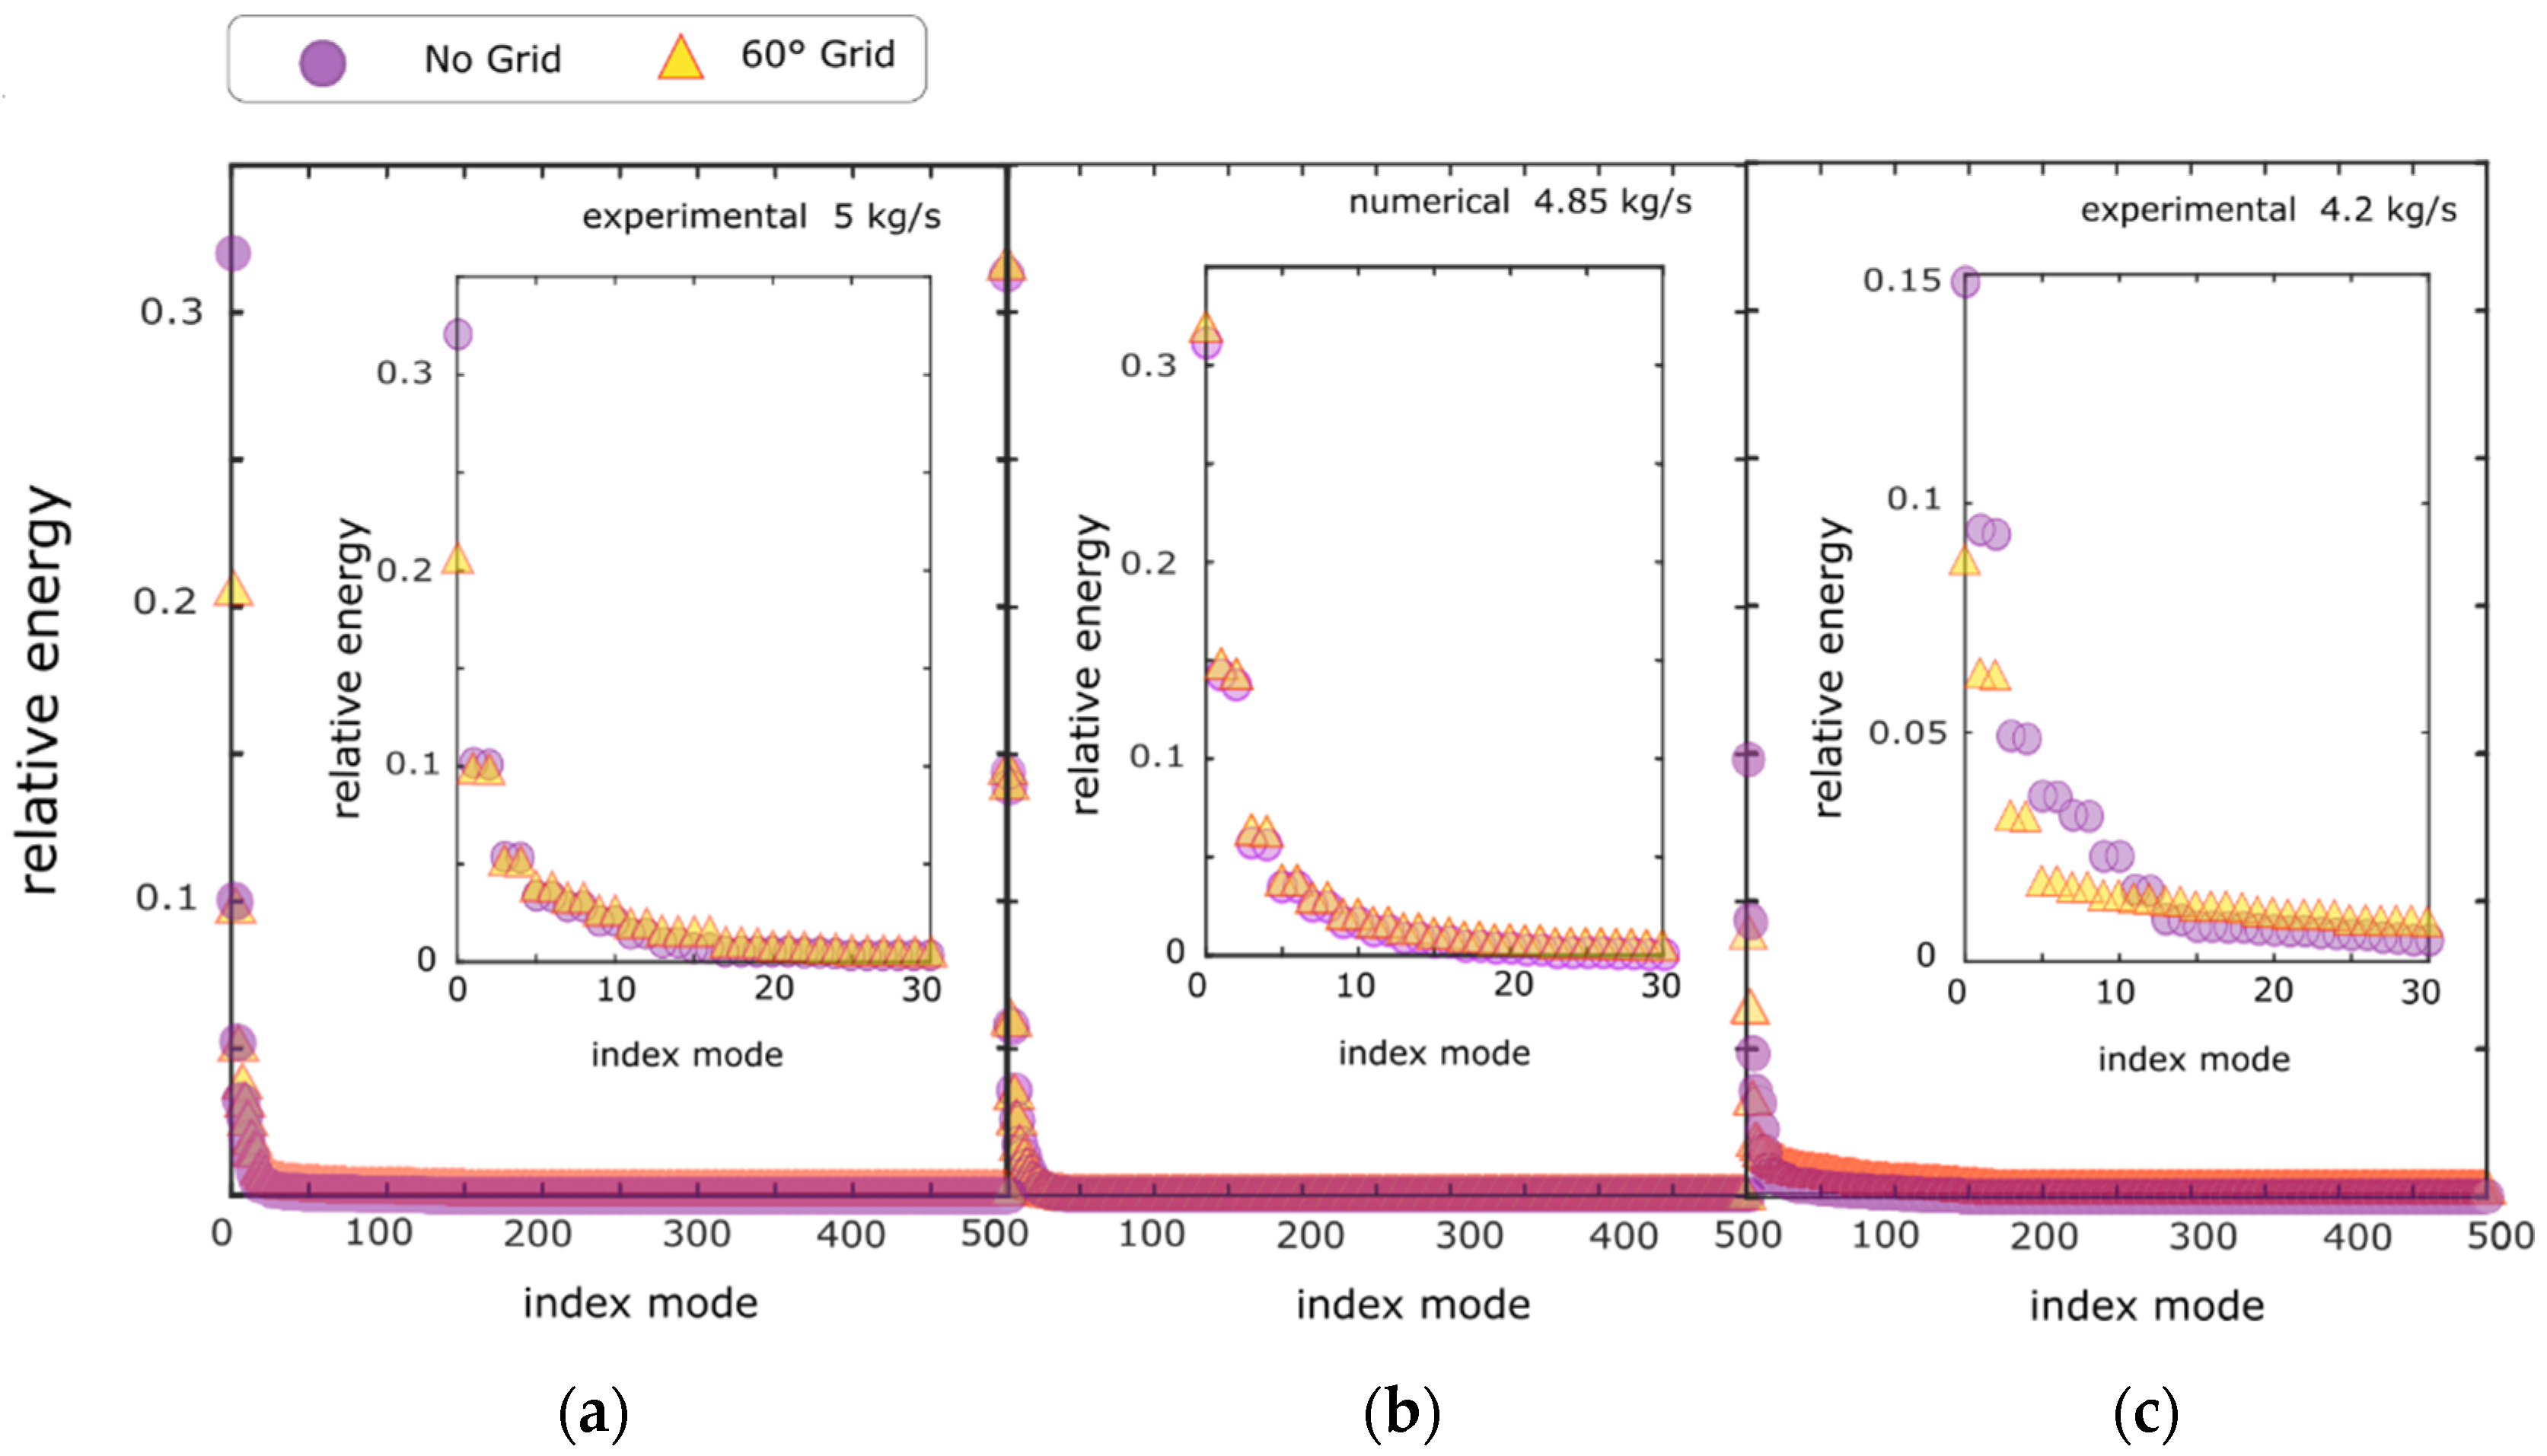
Figure 7, the eigenvalues obtained from applying SVD to the experimental signals are represented for the two mass flow rates investigated experimentally, with and without the presence of the 60° grid. The SVD eigenvalues are also represented for the numerical signals with and without the grid. The eigenvalues are normalized on the value of their total sum such that they represent the relative energy content of the various SVD modes. In the numerical signals (
Figure 7b), the presence of the grid did not change the relative energy content of the modes. Moreover, in the experimental signals (
Figure 7a,c) there were significant differences. We stress that the distribution of energy was different depending on the mass flow rate, even for nondistorted experimental flow. The first mode of the SVD (violet in
Figure 7) had a relative energy of 32% at 5 kg/s, that decreased to 15% at 4.2 kg/s.
Thus, as the stall limit is approached, signals were less periodic and the energy was redistributed from low frequencies to higher frequencies corresponding to higher index eigenvalues. The presence of the 60° screen had a similar effect on the redistribution of the energy of the SVD modes, i.e., part of the low-modes energy of the configuration without the grid was transferred to higher modes for the system with the grid. In fact, with the grid (orange in
Figure 7), the relative energy of low index modes was lower than without the grid (violet in
Figure 7), while the relative energy of high index modes with the grid was higher than without the grid.
The tendency was reproduced for both 5 kg/s and 4.2 kg/s. We speculate that a part of the energy redistribution was caused by the additional presence of the modes introduced by the local geometry of the grid.
4.2. Stall Inception
As shown in the previous section, the numerical simulations well captured the leading-order effect measured in the experimental signals for distorted configurations. We anticipate, however, that the grid-geometry-induced features observed in the experimental pressure measurements play a major role in the onset and decay of rotating instabilities. Since the numerical perturbation was modeled as a pressure drop, such a physical phenomenon cannot be studied with our computational simulations. Hence, in the following, only experimental measurements are presented.
As far as the stall inception process is concerned, the case without distortion screen and the case with the 60° distortion screen upstream of the instrumented window were compared. The throttling valve was closed progressively, starting from the last stable point to induce rotating stall. It has been observed, in previous works [
12,
13] that the perturbation arising in CME2 is always of spike type. A typical transition to stall is represented in
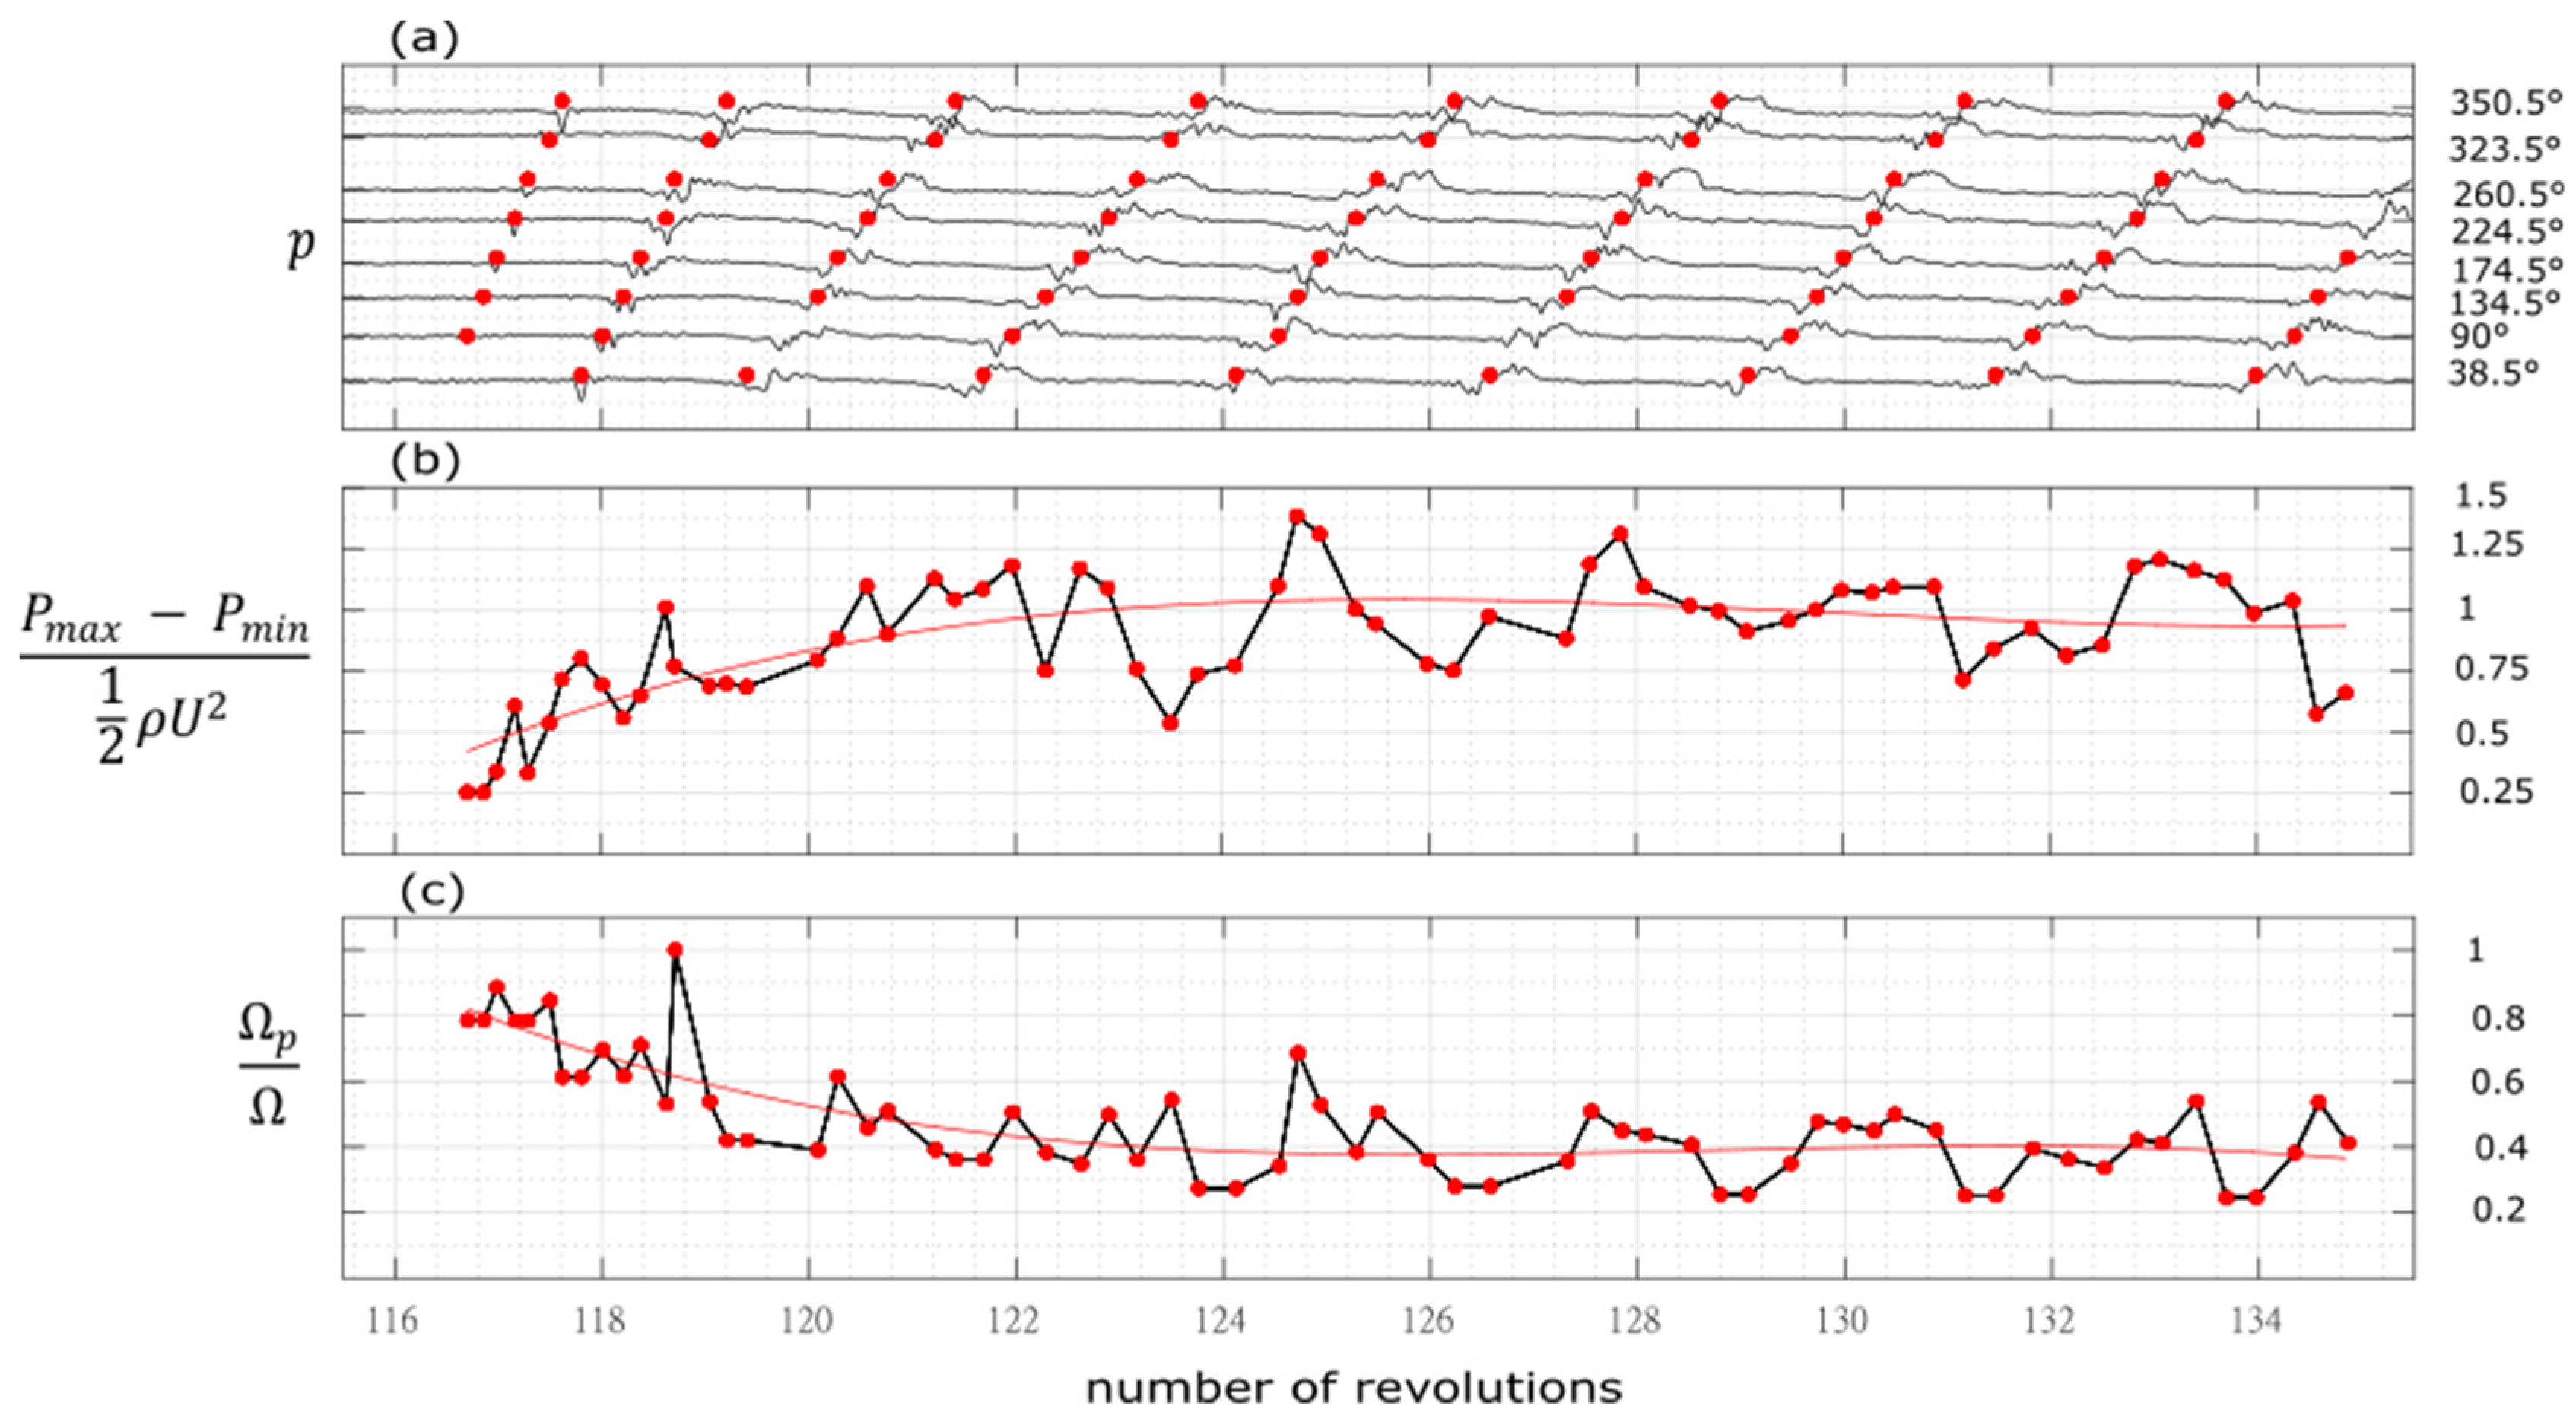
Figure 8. The signals were filtered (cut frequency 800 Hz) to eliminate the blade passing frequency (1600 Hz). The tracking of the perturbation development was done by using cross correlation between each signal and a reference piece-wise signal composed of a typical spike, a stall cell and a transition between the two. The peaks of the correlation represent the time position of the perturbation for each sensors (red dots in
Figure 8).
They were then used to derive the perturbation speed (
Figure 8c). The peak-to-peak amplitude of the perturbation is also reported (
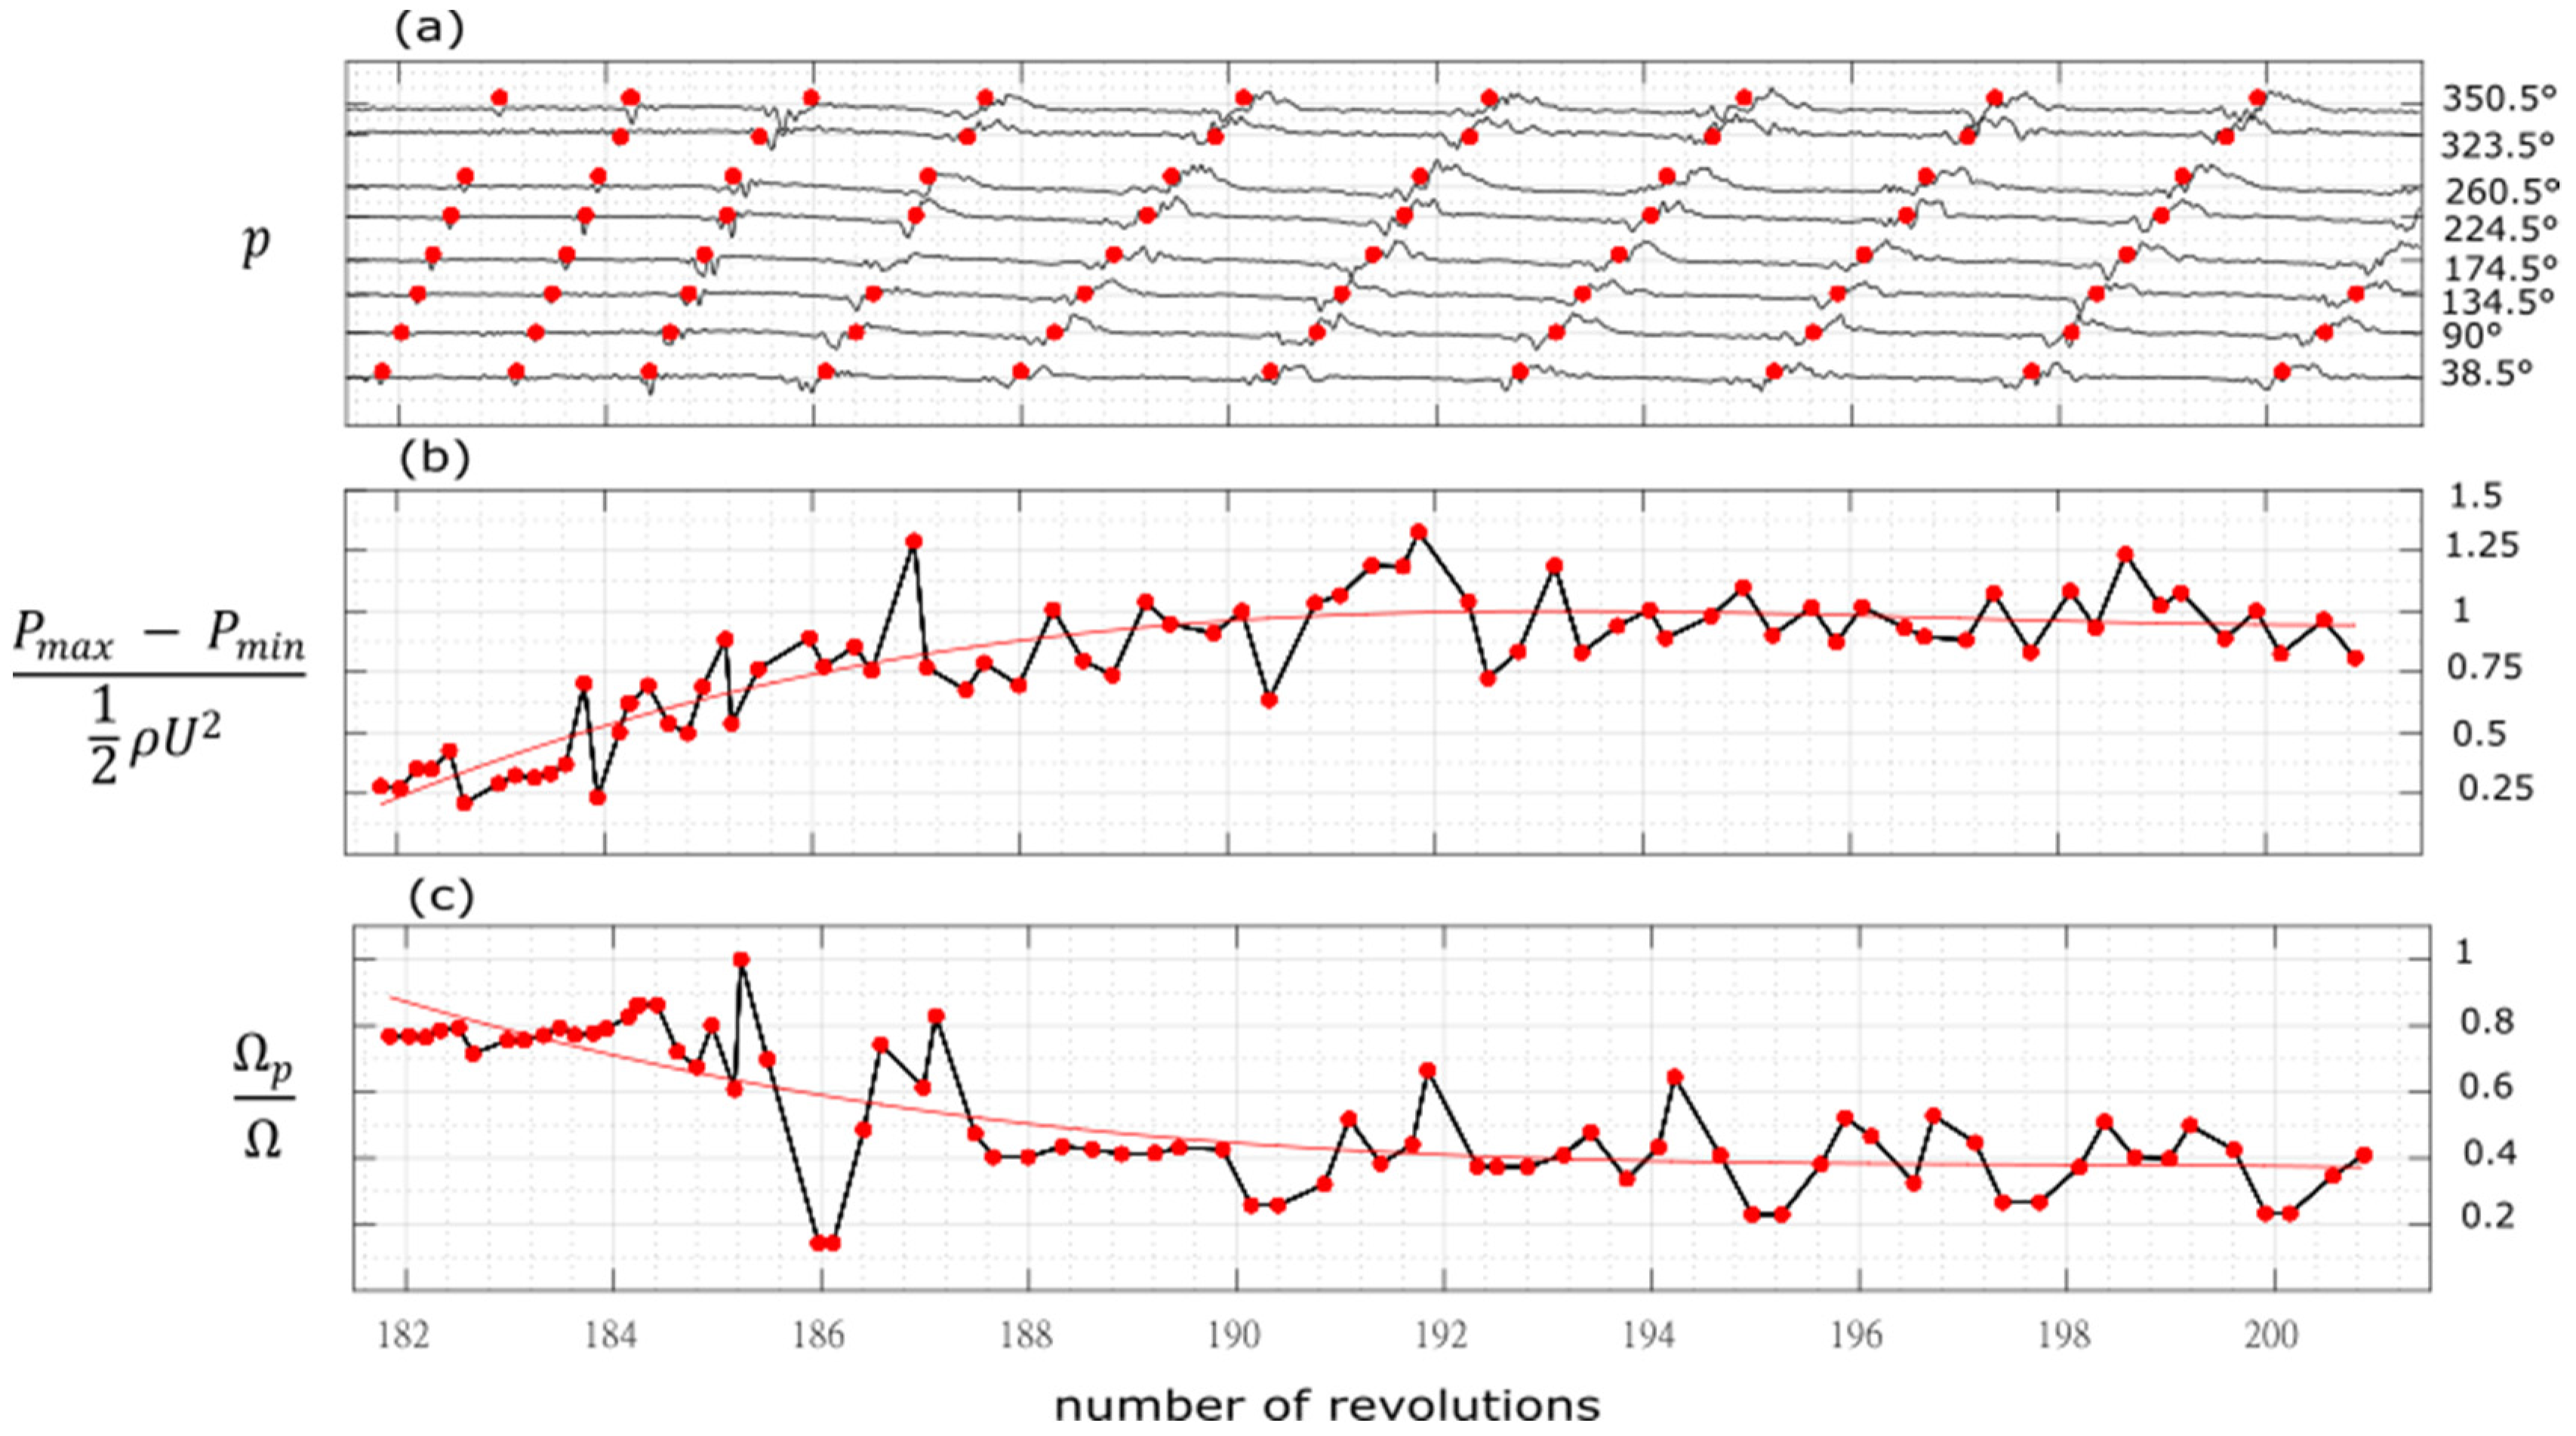
Figure 8b). The main differences concern the starting point of the perturbation and the development of the perturbation during the first revolutions. The first difference is the stalling mass flow rate observed experimentally: 4.15 kg/s without grid and 4.23 kg/s with the 60° grid.
In the undistorted case, the spike usually starts in the region between 90° and 135°.
Such a feature has a very high reproducibility, most likely because the tip clearance in that region decreases and reaches the minimum value due to the imperfect circularity of the casing as already observed [
13]. The perturbation then develops rapidly (in about 5 rotor revolutions) in amplitude, while its speed decreases from about 90% to 40% of the rotor speed.
In the distorted case, however (
Figure 9), the perturbation arises just after the grid (around 30°). The explanation can be attributed to the fact that the region of highest incidence was located at the exit of the distorted region (in the direction of rotation) [
14]. This is due to the pressure gradients created by the interaction of the low-pressure distorted stream and the undistorted one: these gradients created an upstream flow redistribution, so that the incidence at the entrance of the distorted region was reduced and the incidence at the exit was increased. In
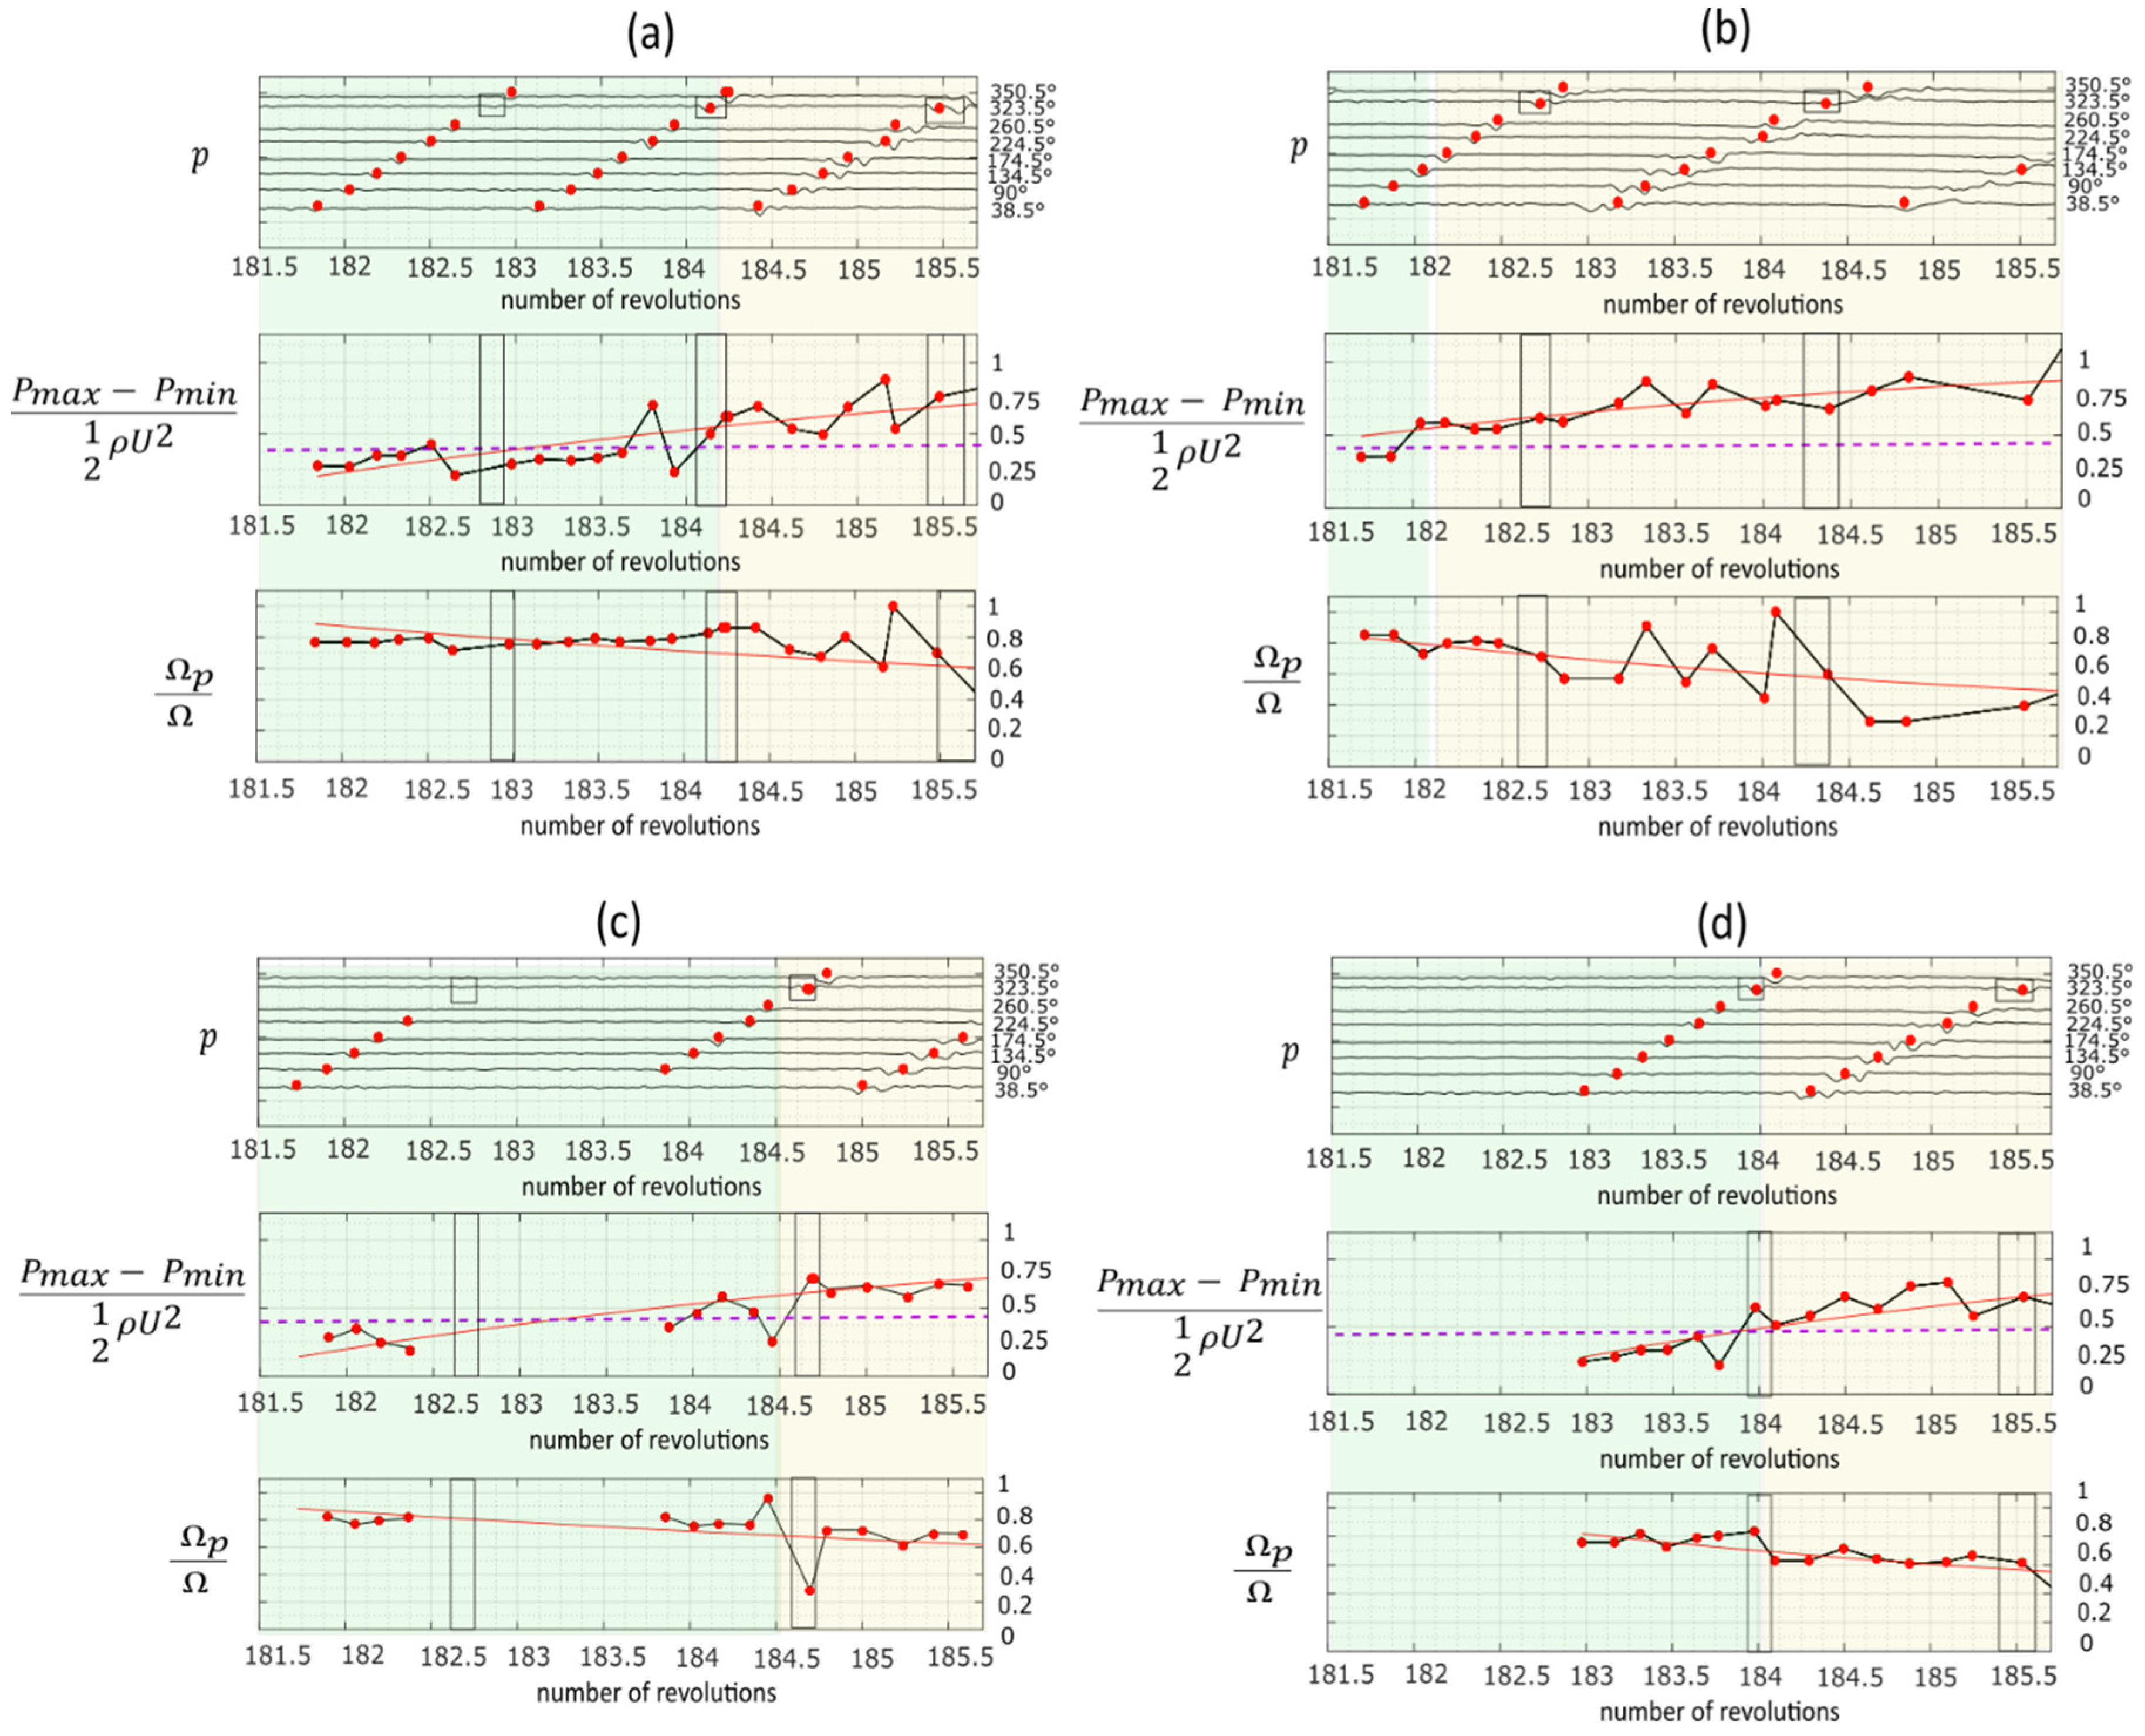
Figure 10, four repetitions of stall transient with the 60° grid are reported. The four transients were obtained throttling the compressor at a constant throttle speed, starting from the same mass flow rate corresponding to the last stable point of its characteristic curve. In the two cases in
Figure 10a,c, after a period of growth, the perturbation vanished just before entering in the distorted region (represented with a black rectangle), which is exactly in the region of reduced incidence argument just discussed. The disappearance of the spike, however, was not always reproducible. It can occur multiple times before rotating stall, or it can also never occur (two cases in
Figure 10b,d). The results reported in
Figure 10 suggest that a threshold value in the perturbation amplitude at the beginning of the distorted region exists, above which the perturbation continues to grow. This threshold value is about 0.425 of the dynamic pressure based on the blade tip speed. There is thus a clear competition between the stabilizing effects of the low-incidence region existing at the distortion inlet and the proper dynamic of the instability.
Moreover, this threshold value also marks two different stages of the development of instability (
Figure 10): a first stage characterized by amplitudes lower than the threshold and constant rotational speed of the perturbation, and a second stage characterized by amplitudes higher than the threshold and decreasing speed of the perturbation.
This reflects the fact that when the perturbation started, nonlinear effects were weak, and were responsible for the saturation that limited the intensification of the perturbation, but the process of intensification of the perturbation did not affect the speed of the perturbation. Instead, as soon as the perturbation reached a high enough amplitude, nonlinear effects became significant and led to a saturation of the intensification process, as well as to a remarkable slowdown of the convective velocity due to the enhanced inertia of the established perturbation.
Apart from the initial stages of the perturbation, the experiments showed that the development into rotating stall is very similar, independently of the presence of the grid. The developed rotating stall cell has a speed corresponding to 40% of the rotational speed of the rotor, while its pressure amplitude is equal to the dynamic pressure based on the blade speed.
