1. Introduction
The High-Speed Cascade Wind Tunnel (HGK) of the Bundeswehr University Munich is a well-established test facility in the turbomachinery community. Due to its ability to change two similarity parameters, namely, Mach and Reynolds number, independently from each other at jet engine relevant flow conditions, it is a unique test facility worldwide, whose performance map is very well suited for research on airfoil aero-thermodynamics. The facility’s large test section dimensions of up to (height × width) enabled very detailed experimental performance characterizations on numerous compressor and turbine airfoil generations which finally made it into service.
Initially, based on a design proposal by Scholz, the facility was erected in 1956 at DFL Braunschweig by one of Germany’s pioneers on experimental fluid mechanics, see Schlichting [
1]. A first comprehensive documentation of its performance was published by Scholz and Hopkes [
2]. In 1984, the entire test facility was moved to the Bundeswehr University Munich, where it got operational in 1985 after an overhaul of the main components as documented in Sturm and Fottner [
3]. As a major change, the original pressure tank (2.4 m in diameter and 9.0 m in length) was replaced by one of significantly bigger volume (4.0 m in diameter and 11.8 m in length) allowing the realization of a longer settling chamber providing much better flow homogeneity and, moreover, a much better access to the wind tunnel components.
Nowadays, there is still a high demand on cascade testing under engine relevant test conditions from industry, which, more than ever, seeks for highly efficient airfoils, especially to fulfill the goals of “Flight Path 2050” published by the European Commission [
4].
Beside this, there is also a particular and long-lasting request for fundamental research on aero-thermodynamic flow phenomena in turbomachinery bladings in order to gain better physical understanding and to provide sound data to validate and further mature numerical methods. In order to stay fully operational and to upgrade the facility for future research requirements, it was decided to carry out a major revision of the test facility, more than 60 years after its first run and tens of thousands hours of intensive testing. In particular, the main components, i.e., drive train, compressor, and oil system, date back to when the test facility first got into service in 1956. Some of these components exhibited already some pre-damages, cracks, and wear. Due to their age spare parts were not available off the shelf in most cases. Therefore, a spontaneous fatal damage to one of these components would result in enormous downtime of the test facility, high costs, and severe delays of running and planned research projects performed at this tightly booked and heavily used research environment. In order to avoid this, a major revision was performed in 2017/2018 and critical hardware components were replaced by new ones of the latest technology. Thanks to a careful and detailed project planning the entire revision could successfully be realized within a very short time frame of four months only. The new components now feature a higher power level providing a significantly extended operating range of the test facility. Parallel to the hardware, a high level of automation was introduced into the facility. Together with a state-of-the-art real-time data acquisition system, the wind tunnel finally satisfies raised demands on automated long-term operating stability. Relevant features and the raised potential of the revised test facility are described in this paper. The picture of the new HGK is rounded by presenting the available portfolio of measurement techniques, both classical probe-based and non-intrusive techniques.
2. The New High-Speed Cascade Wind Tunnel
2.1. Working Principle and Main Components
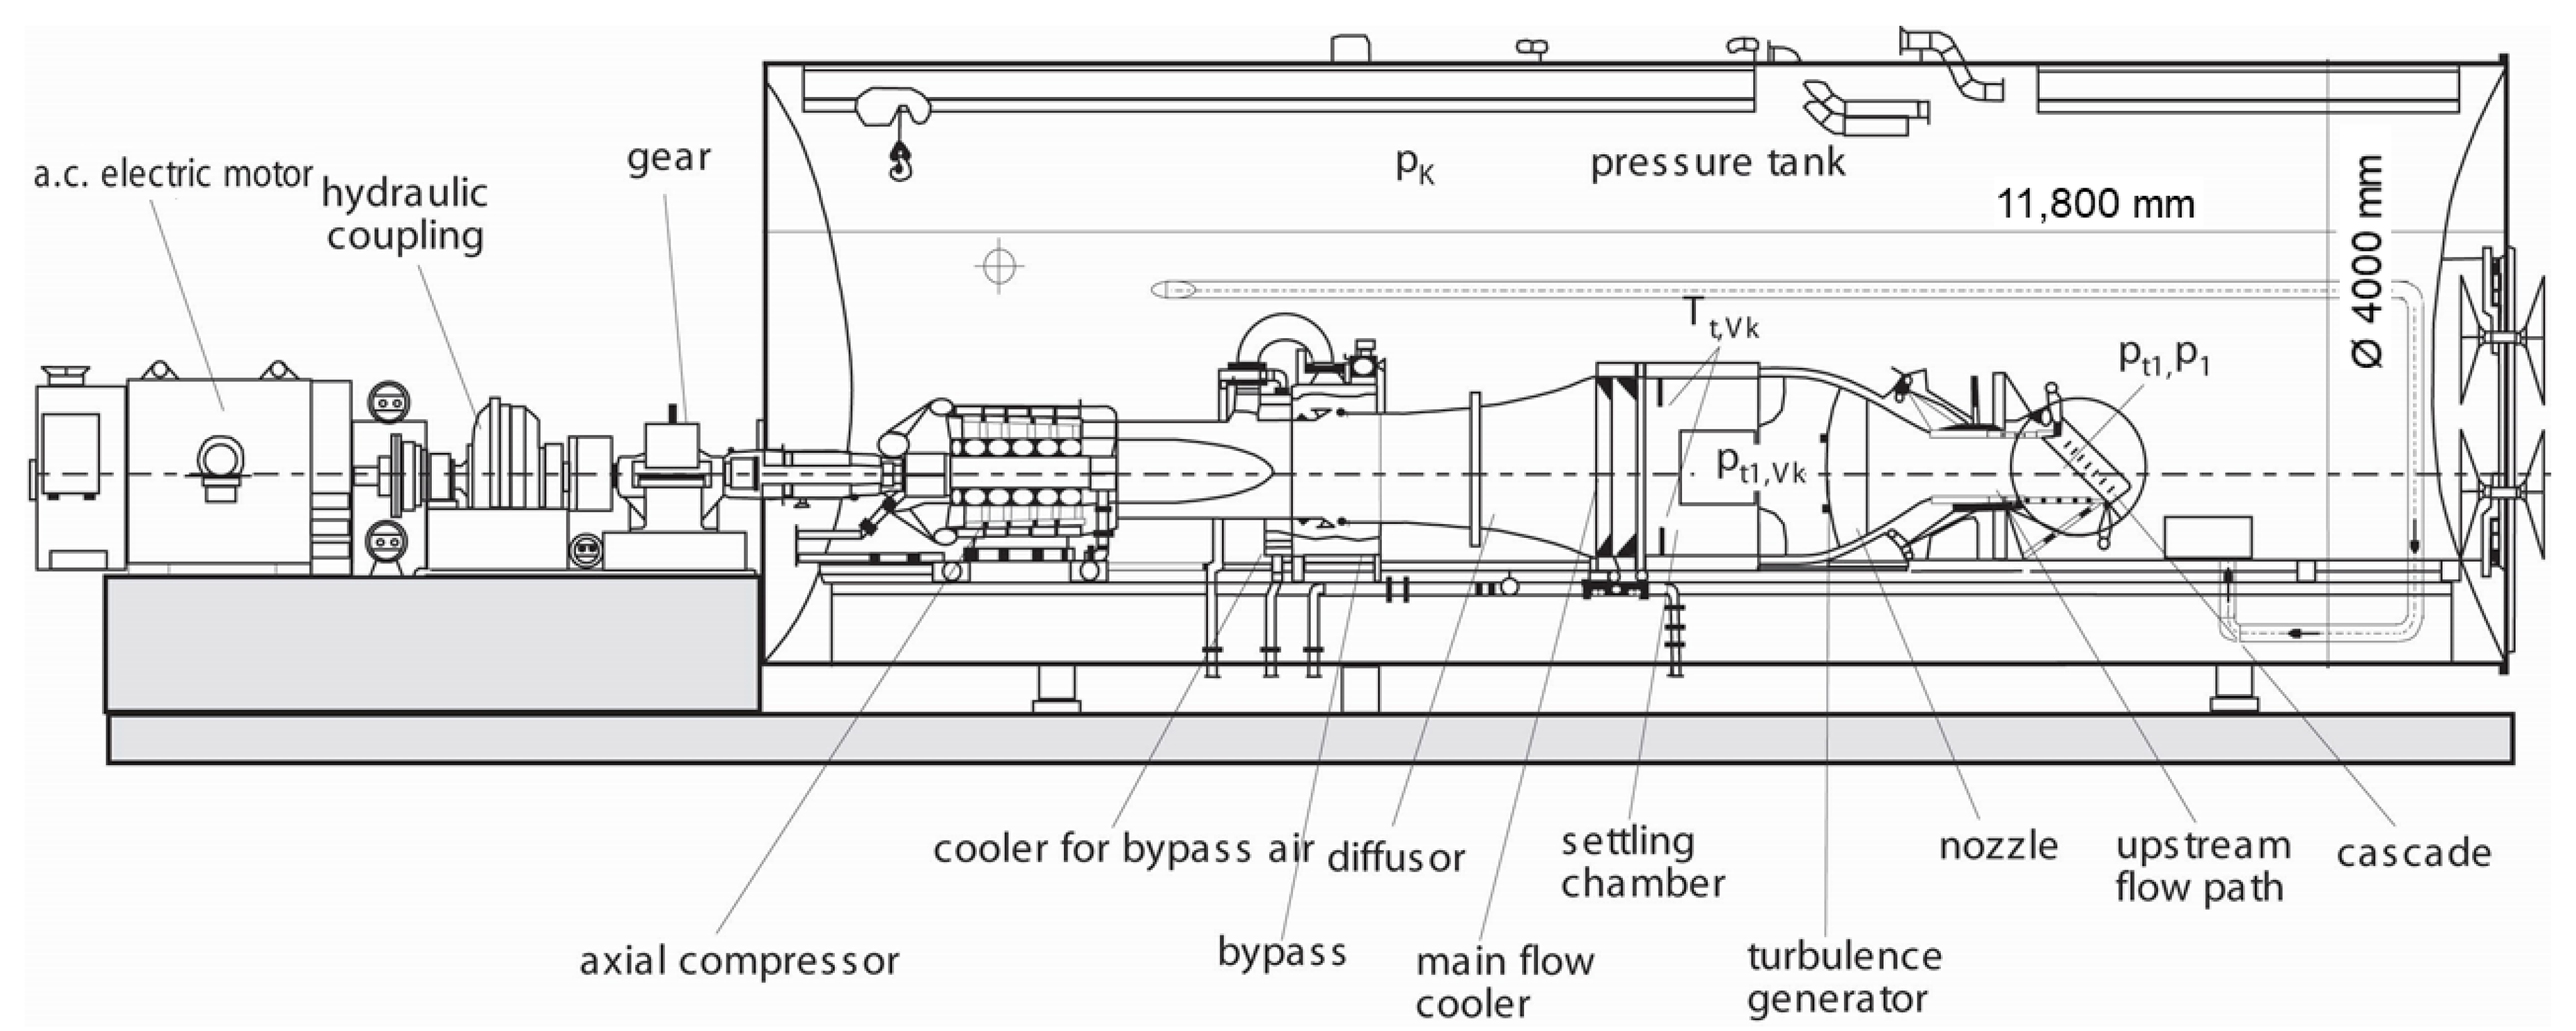
The HGK is a continuous operation, open-loop test facility with an open test section located inside a big pressure tank, as shown in
Figure 1. The static pressure of the air inside the tank can be lowered down to slightly less than 40 hPa and pressurized up to 1200 hPa. By controlling the fluid’s stagnation pressure, static chamber pressure, and the total temperature, an independent variation of two major flow similarity parameters—Reynolds and Mach number—can be achieved, which allows experiments to be conducted under turbomachinery-relevant flow conditions. For a detailed description of the performance and the components of the HGK before the major revision in 2017, the reader is referred to the publications mentioned above.
The air flow was formerly generated by an axial compressor driven by a 1300 kW AC electric motor placed outside the tank. The electric motor and the axial compressor were connected via shaft, hydraulic coupling, and gear box. After leaving the axial compressor, the air passes through a twin-bypass device. By the larger butterfly bypass the compressor can instantly be un-throttled in situations it gets prone to exceed the surge limit. A second annular slide bypass is used for fine adjustment of the dynamic pressure in the range of few Pascal providing higher precision than an adjustment via the shaft speed. Further downstream, the bypass is followed by a diffuser and a main cooler before entering the settling chamber. The water-cooled heat exchanger of the main cooler extracts the fluid energy introduced by the compressor to maintain the air’s total temperature constant within a range of
60
C. After leaving the settling chamber, the flow is accelerated in the convergent nozzle to the requested Mach number (max. up to
) before entering the test section and its outlet (i.e., a plane 40 mm downstream of the measurement positions for
and
), where the test specimen (typically linear cascades) can be installed. Different turbulence grid types allow the adjustment of the turbulence level to realistic turbomachinery-relevant levels. Upon request, periodic unsteady inflow conditions, typically caused in turbomachines by the relative motion between rotor and stator, can be simulated by installing a wake generator in the test section, see Acton and Fottner [
5].
The majority of the wind tunnel components, except for the pressure tank, the heat exchanger, and the settling chamber, originate from the test facility’s early years in 1956 as it was erected in Braunschweig. Therefore, both the Bundeswehr University as well as the Institute of Jet Propulsion felt the urgency to replace all major components of the test facility, namely, the drive train, the compressor, the oil system, and the main cooler, in order to assure full availability and fail-safe testing for prospective research purposes and to extend the operating range significantly for future needs.
2.2. Performed Revisions and Modifications
The existing six-stage axial compressor of the “old HGK” was a drive unit specifically designed by the Voith company to operate this facility. During project planning for the “new HGK”, an extensive exploration of the market was performed by an external recognized engineering office. It turned out that the replacement of this component will be the most challenging issue, as no commercial compressor off the shelf was available matching all major requirements in terms of size, volume flow, pressure ratio, power, and the operability at very low pressures in the HGK environment. Finally, and once again, the new compressor as a centerpiece of the “new HGK” had to be tailored for the specific demands of this wind tunnel, as it had been already done for the old one.
At the end, an excellent customized solution was realized in close collaboration with MAN Energy Solutions (formerly MAN Diesel and Turbo SE). The propulsor for the new HGK is based on MAN’s latest design of the industrial compressor MAX-1, compare Ziegler et al. and Anding et al. [
6,
7]. During its development phase a configuration consisting of the first seven stages of the novel axial compressor design was tested in a test bed at MTU Aero Engines, scaled down by a factor of 3. It turned out that the first three stages of that scaled version perfectly match all requirements for the requested operation range of the new HGK, in case that all three stages would be equipped with variable guide vanes. For this purpose, however, a new casing including inlet and outlet, a new rotor, as well as a new bearing system were needed. The outcome was a rather compact and powerful compressor unit which was installed and commissioned successfully in December 2017, as depicted in
Figure 2. The compressor is designed at a nominal speed of 11,550 rpm. At maximum speed of 12,705 rpm, it can deliver a maximum pressure ratio of 2.4 and a maximum volume flow of
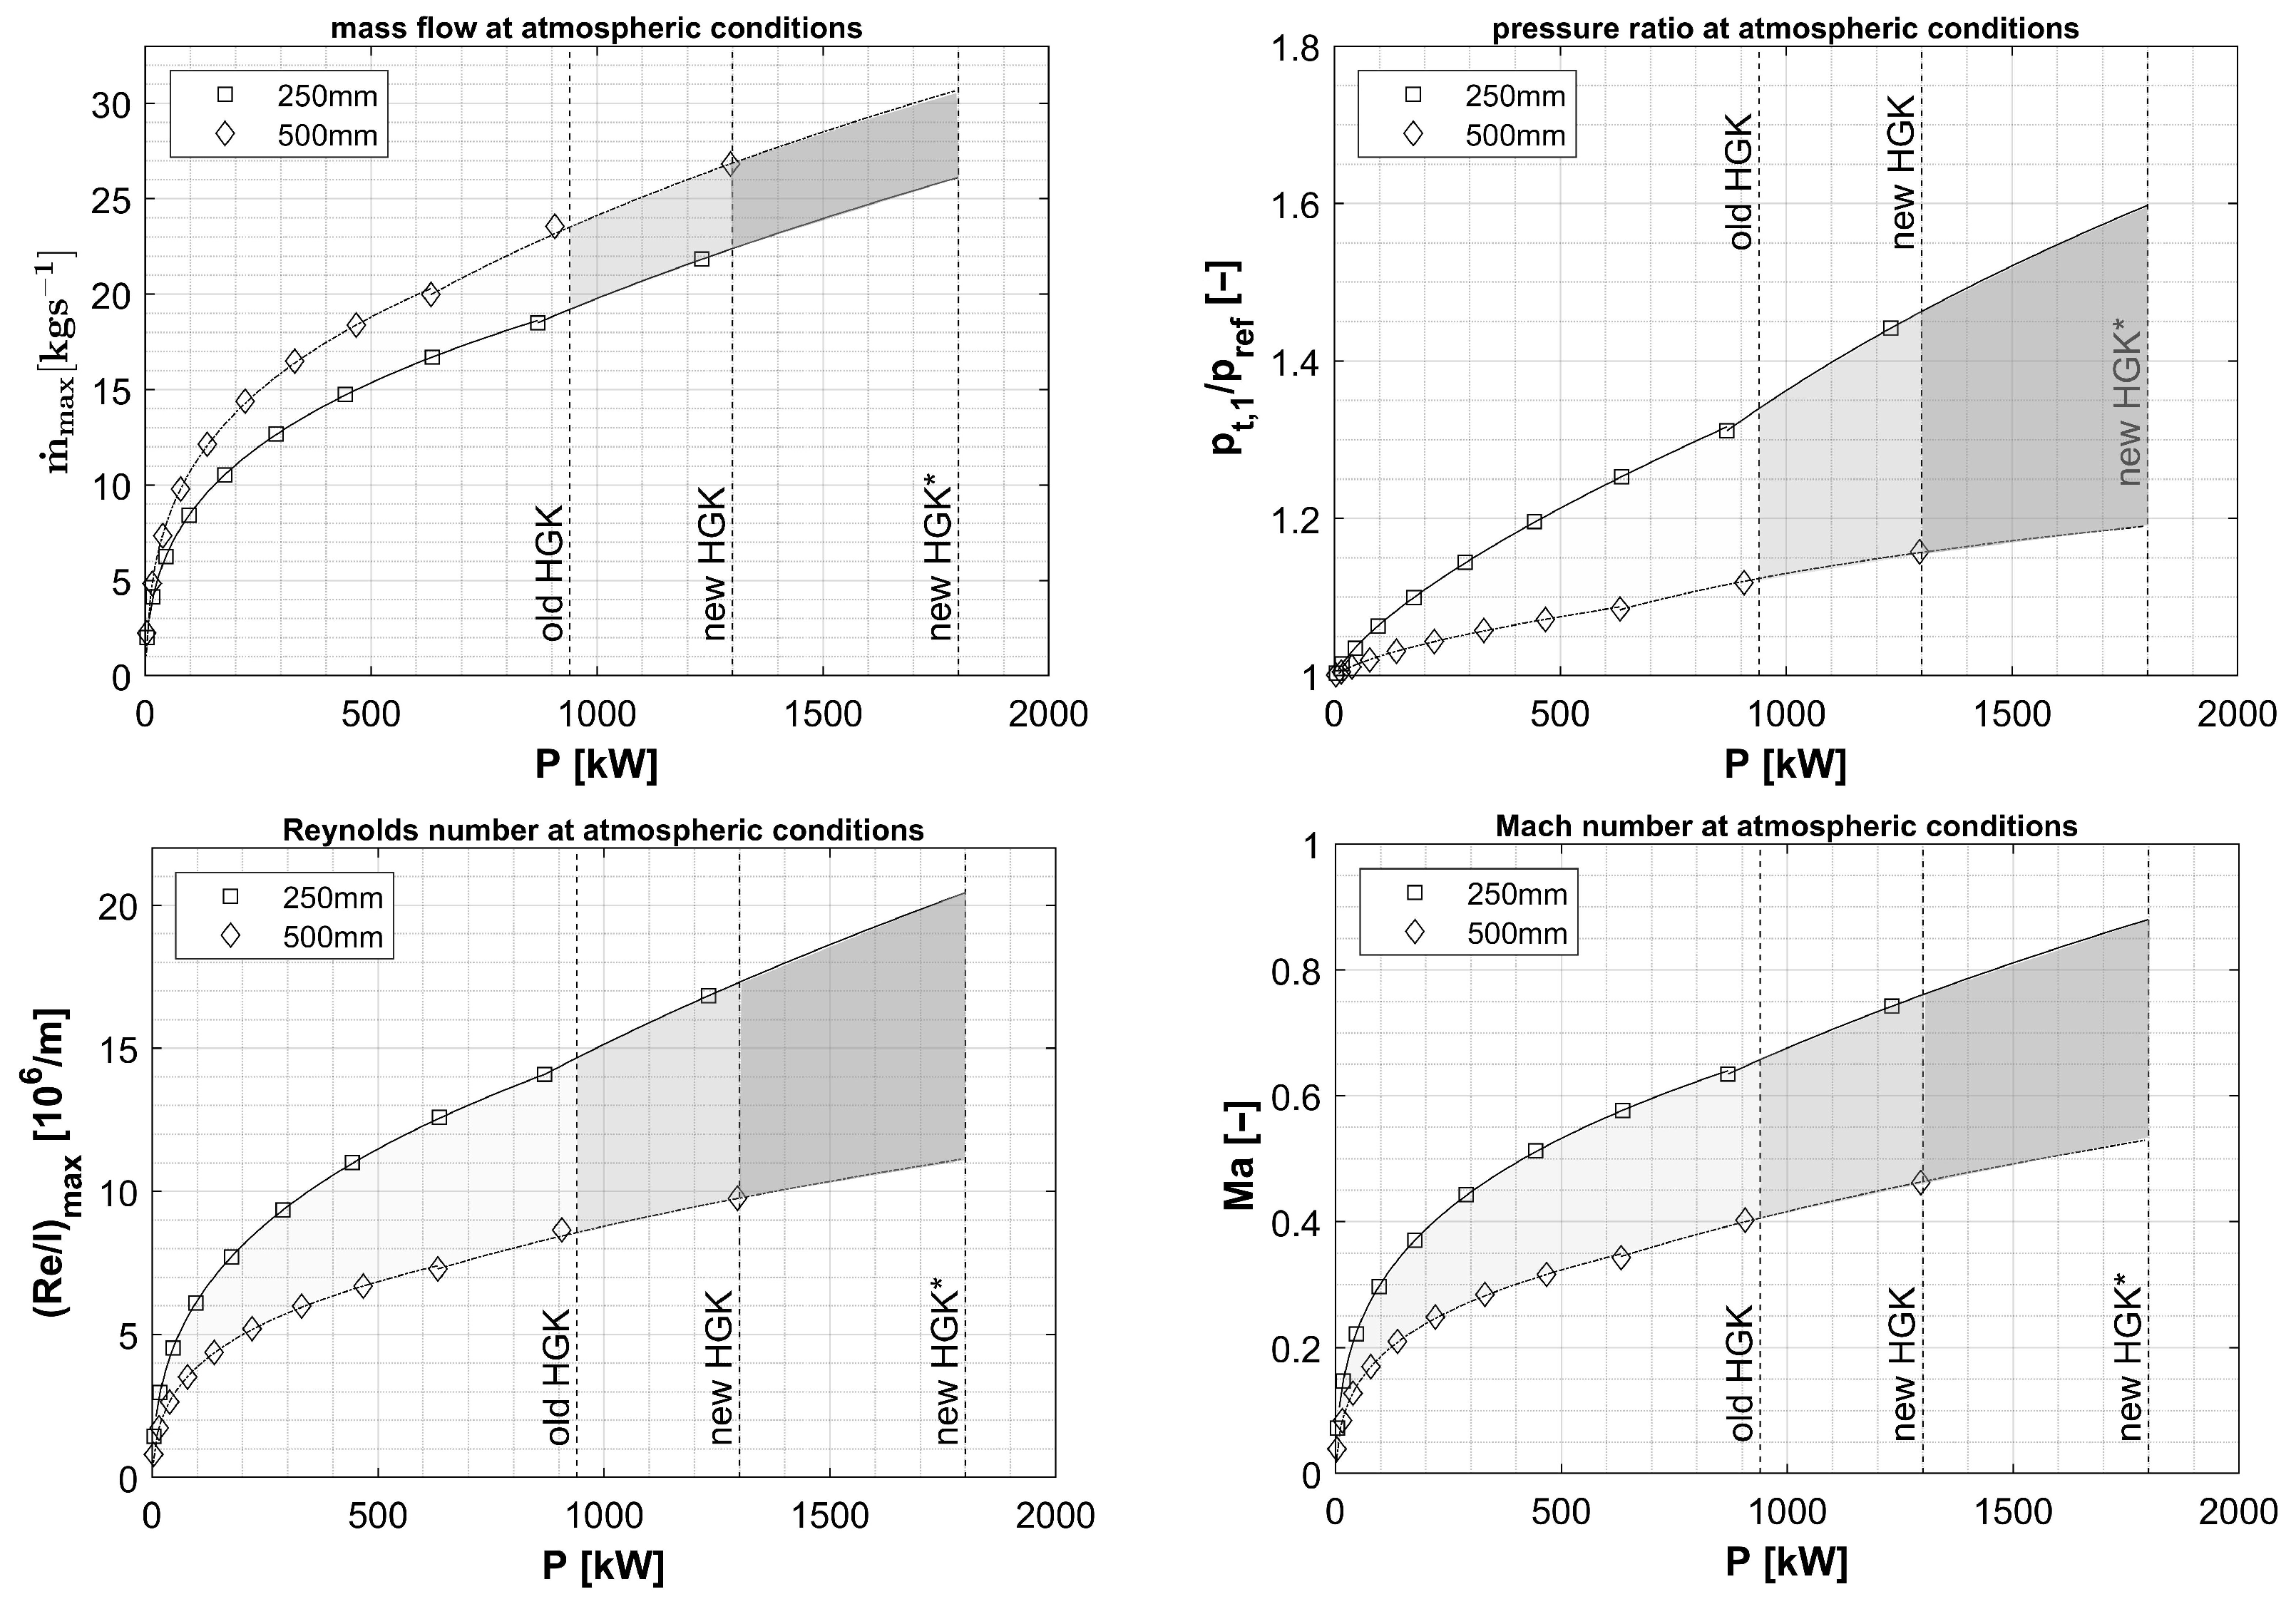
/s. Regarding the remaining components of the drive train, the replacement was rather straight forward with state-of-the-art components off the shelf, i.e., an 1800 kW Siemens asynchronous electric motor (type 1RQ65004JT60-Z) in combination with a Sinamics Perfect Harmony GH180 medium voltage driver for frequency conversion. The 38% power increase compared to the old motor (1300 kW) is the prerequisite for a significant extension of new HGK’s operating range, as it is explained below. As the new electric motor can be controlled to individual rotational speeds by means of the frequency converter, the hydraulic turbo coupling, which took over this job in the old HGK by energy dissipation, was not longer needed. One of the main advantages of getting rid of the turbo coupling is a stable and continuous operation of the wind tunnel across the entire chamber pressure range in particular at static chamber pressures around atmospheric conditions or higher (i.e., at high Reynolds numbers). In order to match the rotational speed between the new compressor (
12,700
) and the new electric motor (
), a Renk gear box TS-450 with a gear ratio of 7.7 was installed outside the pressure tank connecting the high- and the low-speed shafts. The new configuration required a completely new oil circuit for supplying the compressor and the gear box, too. This system had to overcome the challenge to deal with different relative oil feeding pressures for the individual components inside and outside the pressure tank whose required oil pressure ratio is far below or even 1.8 times above atmosphere, respectively. An active pressure control and level balancing system was finally installed to get the system operating safely.
As a consequence of the increased electrical power, a new main cooler had to be installed in order to allow testing at constant total temperature even at the new performance limits. Accordingly, the new heat exchanger was designed to extract energy from the flow which is roughly in the same order as the maximum power of the electric motor (1800 kW). The cooler was delivered by the Güntner company, Germany. It is a special construction of their GCO type heat exchanger, which is particularly designed in order to match the operation requirements of the HGK and to provide excellent flow homogeneity in terms of velocity and temperature distribution as well as low pressure losses. In contrast to the old main cooler, which consisted out of six single elements, the new cooler is a single heat exchanger block consisting of aluminum fins and stainless steel tubes which leads to a compact design and ensures utmost uniform flow quality. The cooling water header outlet is carried out in four sections, in which the volume flow can individually be controlled by valves in order to achieve best temperature uniformity in the flow field. The flow quality behind the main cooler is further raised by a single stage flow straightener integrated directly upstream the settling chamber.
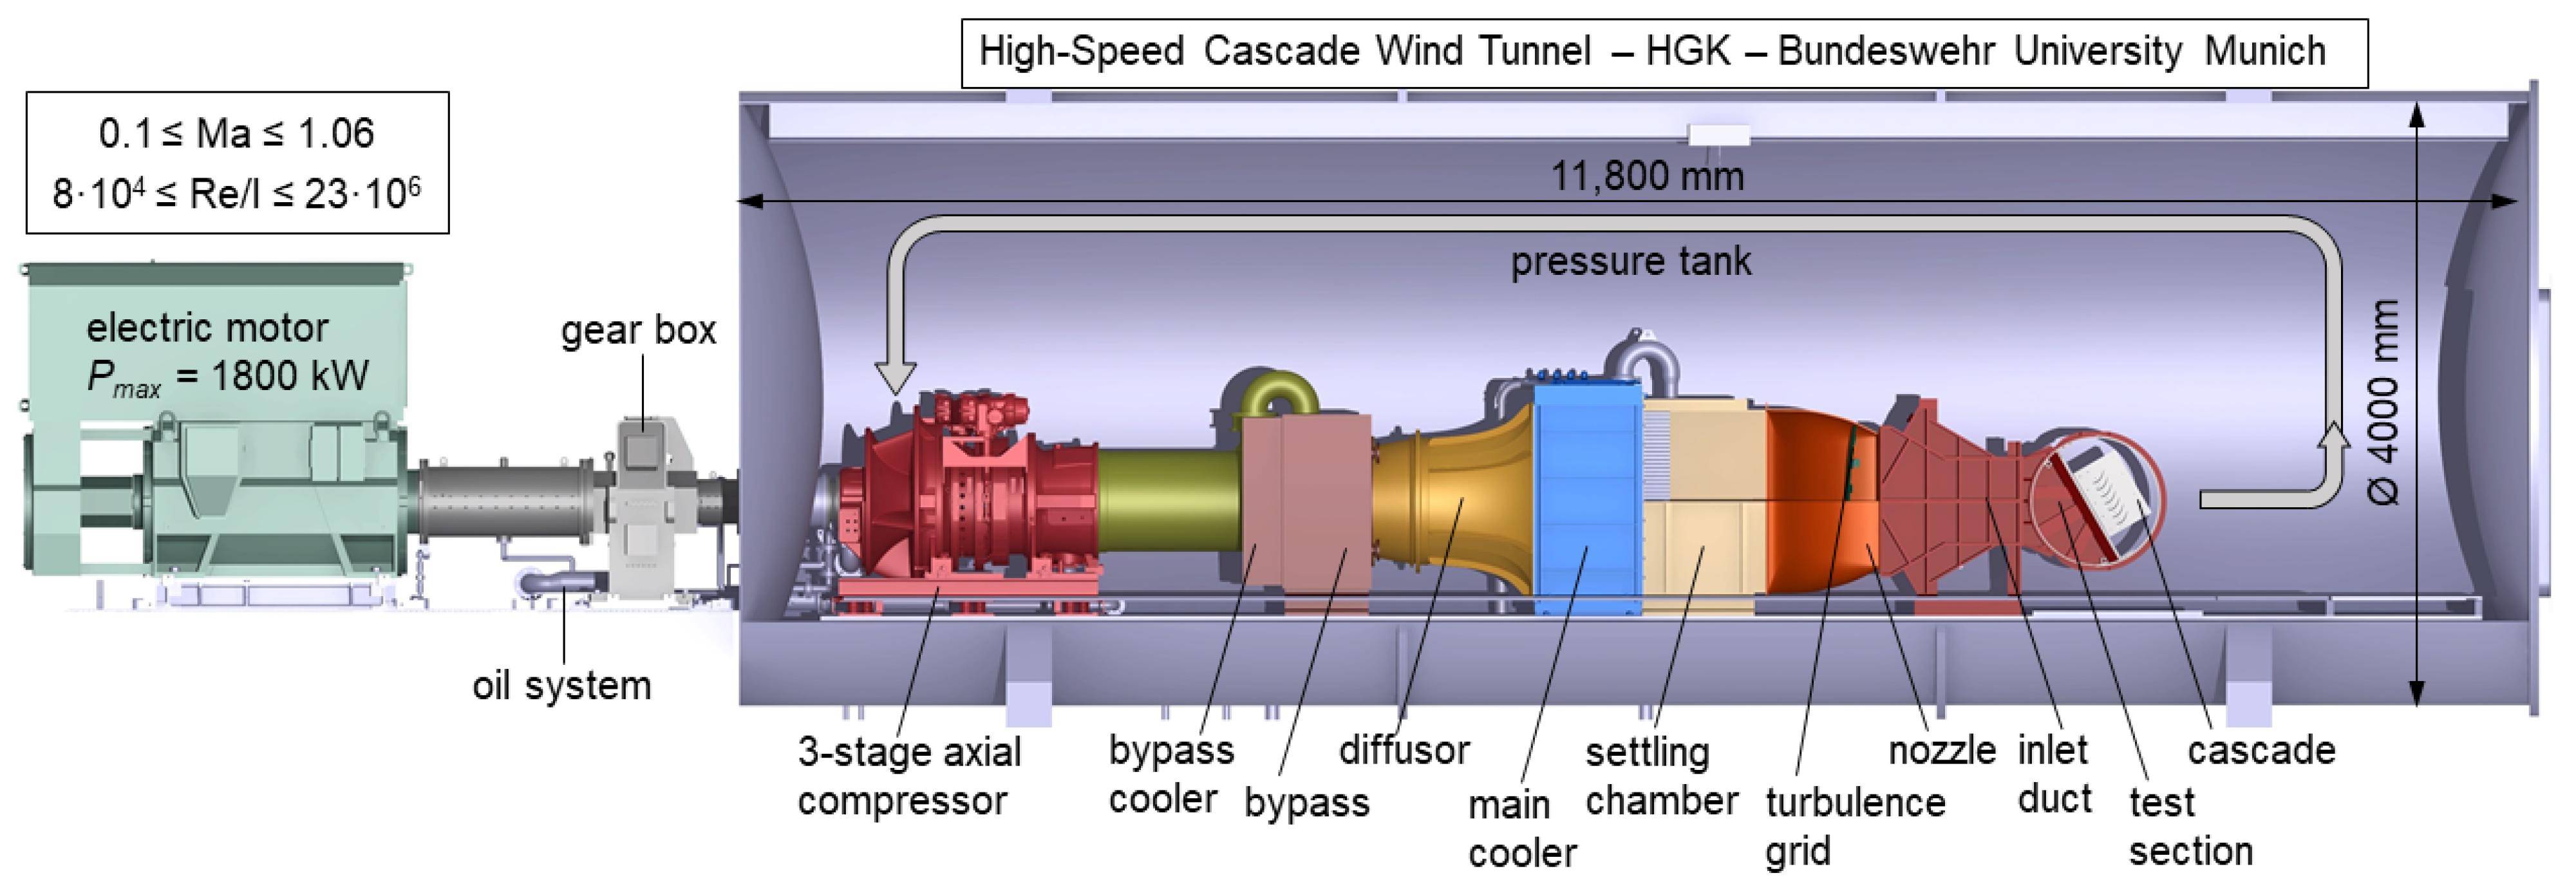
At the end, the testing downtime for dismantling the old test facility and assembly of all components of the “new HGK” was 4 months only, thanks to a very careful project planning. The new test facility, as depicted in
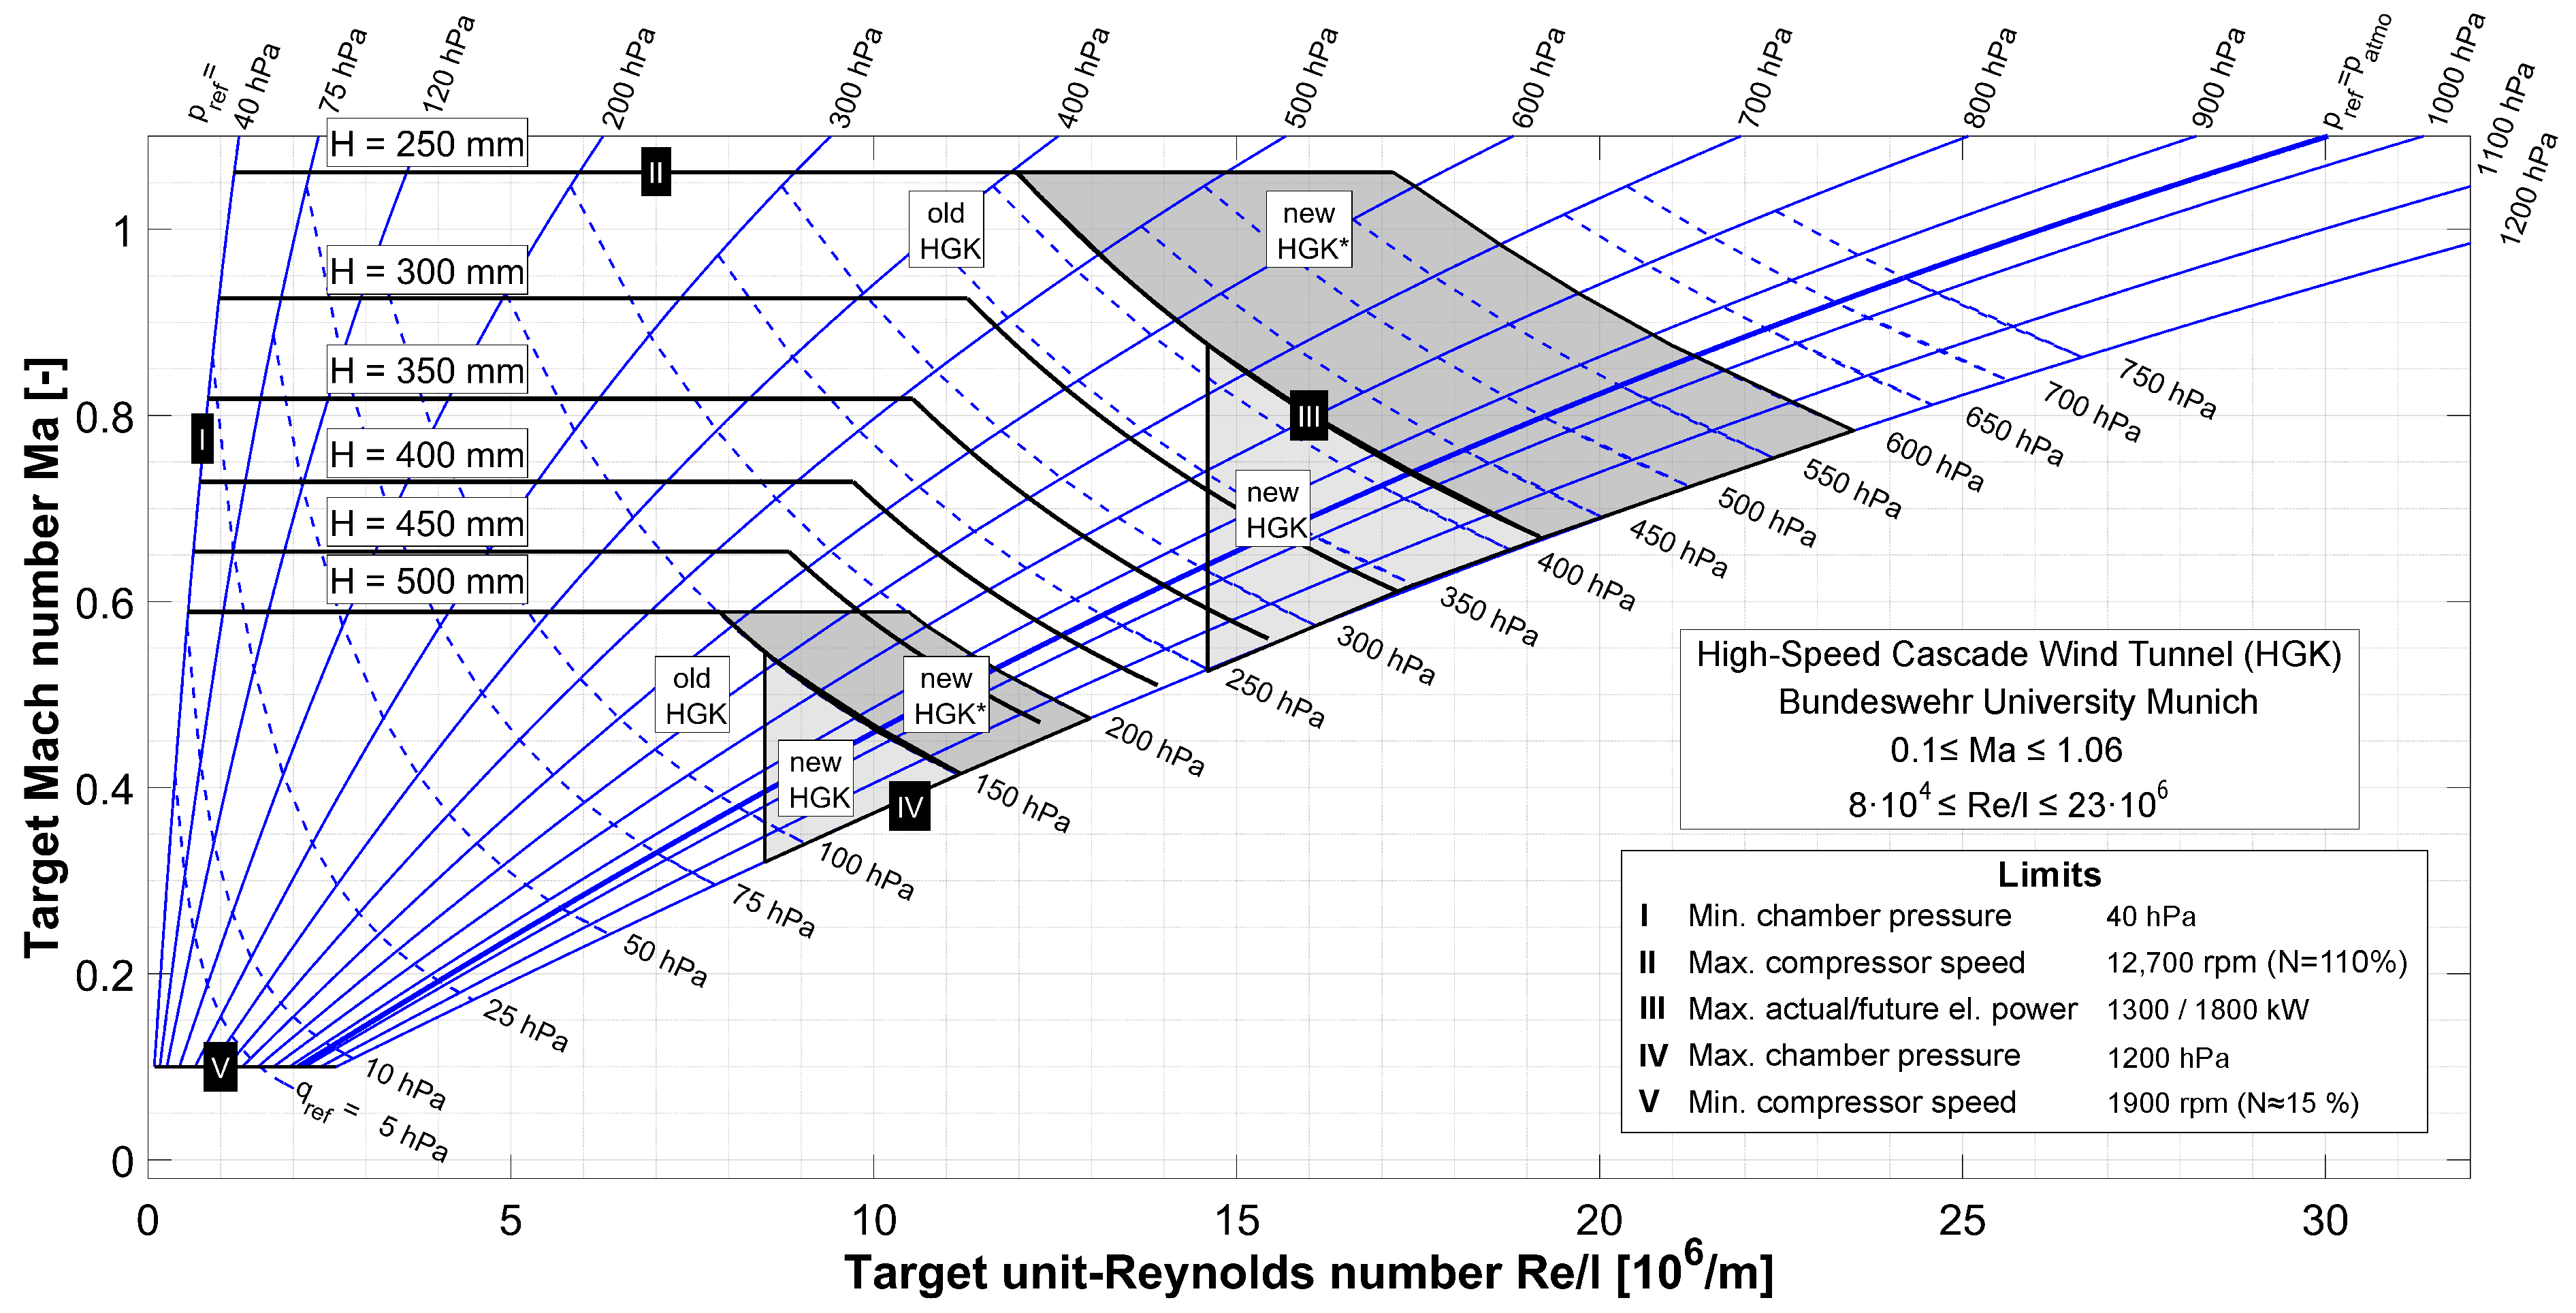
Figure 3, got operational on 26 January 2018. However, the full electric power is not yet available as electricity is still provided by the old existing transformer, which cannot convert the maximum power for the new motor. The replacement of the old with a more powerful transformer has already been started and the finalization is envisaged in the year 2022. After its accomplishment, the full operating range of the new HGK test facility will finally become available.
3. Operating Point and Compressor Health Monitoring
The HGK is typically operated at constant Mach and Reynolds number conditions over several hours depending on the test matrix. Since the new electric motor is frequency controlled, the setting and stability of the stagnation pressure is way more precise compared to the old drive train with the hydraulic coupling. The revolutions of the high-speed shaft driving the compressor is stable by better than 0.1%.
The planning of an experimental campaign necessitates the definition of target Mach and Reynolds numbers. These test conditions are usually specified far prior before testing. Targeted
and
conditions are controlled by measuring and monitoring just three flow properties: the stagnation pressure
, the reference pressure
and the total temperature
, which define the operating conditions for a given blade chord length
l according to Equations (
1) and (
2):
R,
, and
represent the specific gas constant as well as the Sutherland’s constant values for air and
is measured at the cascade’s inlet plane for compressor tests and at the outlet plane in case of a turbine test specimen. A Mensor CPG 2500 precision pressure scanner was installed, allowing to measure the static reference pressure
and the dynamic pressure
(
) referenced to the atmospheric pressure within 0.008% full scale accuracy (i.e., 7.5 Pa and 10 Pa, respectively).
In the course of the revision, the wind tunnel control system was migrated to a state-of-the-art PLC (Programmable Logic Controller) control system which continuously monitors and controls all relevant status values for operating point or system health monitoring and exports a 10-Hertz data log. All measures as well as the dedicated limits for experimental safety are provided and controlled by the SPS. The surveillance data comprises the wind tunnel environment (e.g., all operating pressures and temperatures) as well as the drive train and compressor status (e.g., actual power ratings, motor and compressor speed, vibrations sensors, temperatures in inlet, outlet, and bearings and compressor pressure ratio) and all secondary systems (e.g., cooling power, oil pressures, or actuator positions). In particular, the compressor stability limit (i.e., surge limit) was determined experimentally during commissioning runs in the HGK test facility by MAN prior to any measurement campaigns. Since that time, all relevant values to prevent compressor surge are continuously monitored. In case the surge limit is critically approached during operation, a two-stage warning system forces the operator (and in future the fully integrated bypass actuator, see above) to intervene and unload the critical operating point setting. In case the limits are still exceeded, the system trips and shuts down in a controlled manner. Anyhow, as the change of an operational set point usually happens slowly within several seconds there is no need for unsteady surveillance or instantaneous actuators.
Due to the full online data availability, a software controller was implemented recently, which will enable fully automated operation on a longer term. At the moment, this control algorithm is intensively tested and trained under various operating point combinations also including safety limit approach and recovery. First fully automated tests without user input were successfully carried out in summer 2021 but need further tuning.
The evaluation of the main three flow properties which define the target Mach and Reynolds number conditions from the continuous data log allows an assessment of the operating point stability as outlined in
Figure 6.
The data were extracted from the last testing hours (>330 h) throughout the wind tunnel’s entire operating field. The statistical quantities and result from fitting all data by a normal distribution, whereas is the mean deviation and gives the standard deviation and hence a quantitative measure (e.g., 1-, 2-, or 3-sigma) for the deviation of the actual and values from their target points. Therefore, the long-term operating point stability for the target Mach and Reynolds number are determined to be % and %, respectively. As an example, for a low-pressure turbine cascade being tested at and = 100,000 this results in and . It is expected that the fully automated testing can reduce the standard deviation even further, in particular to control the static chamber pressure and hence the Reynolds number.
The repeatability and temporal stability of both, and , are mainly dominated by the precision and leakage rate of the butterfly valve which controls the HGK’s reference pressure in the tank. It is situated in the peripherical infrastructure of the wind tunnel in between the pressure tank and the vacuum pumps. Considering the fairly large volume of the vessel of 150 m, the operating pressure can be stabilized over the long term within absolute reference pressure better than Pa and dynamic pressure better than Pa. As a consequence of the big vacuum chamber, a huge amount of thermal energy leads to a tardy temperature settlement and a continuous heat radiation from the vessel to the lab building, which is unfortunately not temperature controlled. Therefore, the flow temperature can typically be stabilized and measured better than 0.3 K during several hours of testing.
4. Data Acquisition
Beside the continuous log for operation, the main architecture for test data acquisition (DAQ) was migrated to the National Instruments real-time platform PXI-8880 combined with a state-of-the-art LabView user interface developed in-house. The new platform enables the direct application of a large number of onboard measurement equipment, or the linked control of third-party test equipment. A brief overview of the available portfolio at the HGK is presented in the last chapter of this paper.
The DAQ allows for the recording of real-time streaming data and control of hardware in the loop (HIL) processes at high-frequency (HF) up to 250 kHz and at ultra-HF up to 1.25 MSamples/s at various digital channels (recently 96 HF and 12 ultra-HF channels). A local data streaming network allows the integration of the RJ-45 based communication with more than 384 pressure channels (Pressure Systems NetScanner type 98-RK1 and type 9116) and a five axes traversing unit. The measurement data including all meta data from the facility status is stored in a TMDS binary format which allows high streaming rates, important especially for long-term unsteady data recordings. Typical DAQ sampling rates of 10 to 20 Hz over several seconds during steady state measurements allow the calculation of uncertainty and standard deviations for all data channels, whereas the long-term stability over a test day is recorded within the continuous data log as outlined above.
5. Qualification of the Flow Field in the Cascade Inlet Plane
The flow quality of the old HGK facility was excellent. Anyhow, the old facility was operated and monitored in a widely analogue manner. There was no major need to improve the flow quality but to replace the old components and to extend the limits in the operating range. One overall constraint was that the new components shall provide comparably good or even better inflow quality to the test specimen in order to allow a comparison between data form the old and new test facility. Therefore, the flow quality in the test section was carefully checked with detailed flow measurements after re-commissioning. The goal of these experiments was the qualification of the flow homogeneity in the wind tunnel outlet plane where the test specimen is typically installed. For the sake of ease, the wind tunnel outlet was set vertically for these experiments providing the outflow vector co-aligned with the wind tunnel coordinate system. The horizontal duct width was kept constant at mm, whereas three different duct heights mm were characterized starting 15 mm downstream of the test section outlet plane. To create a holistic view on the flow field across the entire operating range, traverses with a spherical-head five-hole pressure probe (5HP) and total temperature probe in tandem configuration were performed covering the full duct channel cross section normal to the main flow component by up to 315 data points each. Both probes enabled the assessment of the homogeneity of the flow properties , p and , which usually define cascade inlet conditions.
The thermodynamic data were complemented by 3-component flow velocity fields measured with far higher spatial resolution by means of stereoscopic Particle Image Velocimetry (2D-3C PIV) at the same operating points and duct heights as above. These PIV measurements were performed in a vertical plane downstream of the test section outlet originating from the plane of the probe traverses and being aligned in parallel to the main flow direction at half duct width. Similar to the work presented in Chemnitz and Niehuis [
8], up to 10,000 PIV images were recorded for statistical relevance of a converged turbulence intensity. The PIV images were analyzed for each operating point using a state-of-the-art commercial PIV image processing toolbox based on interrogation-window cross-correlation. For the sake of brevity and to focus on the general evidence, a detailed discussion of the experimental setup is skipped here, and the reader is referred to the corresponding literature discussed in the last chapter of this paper.
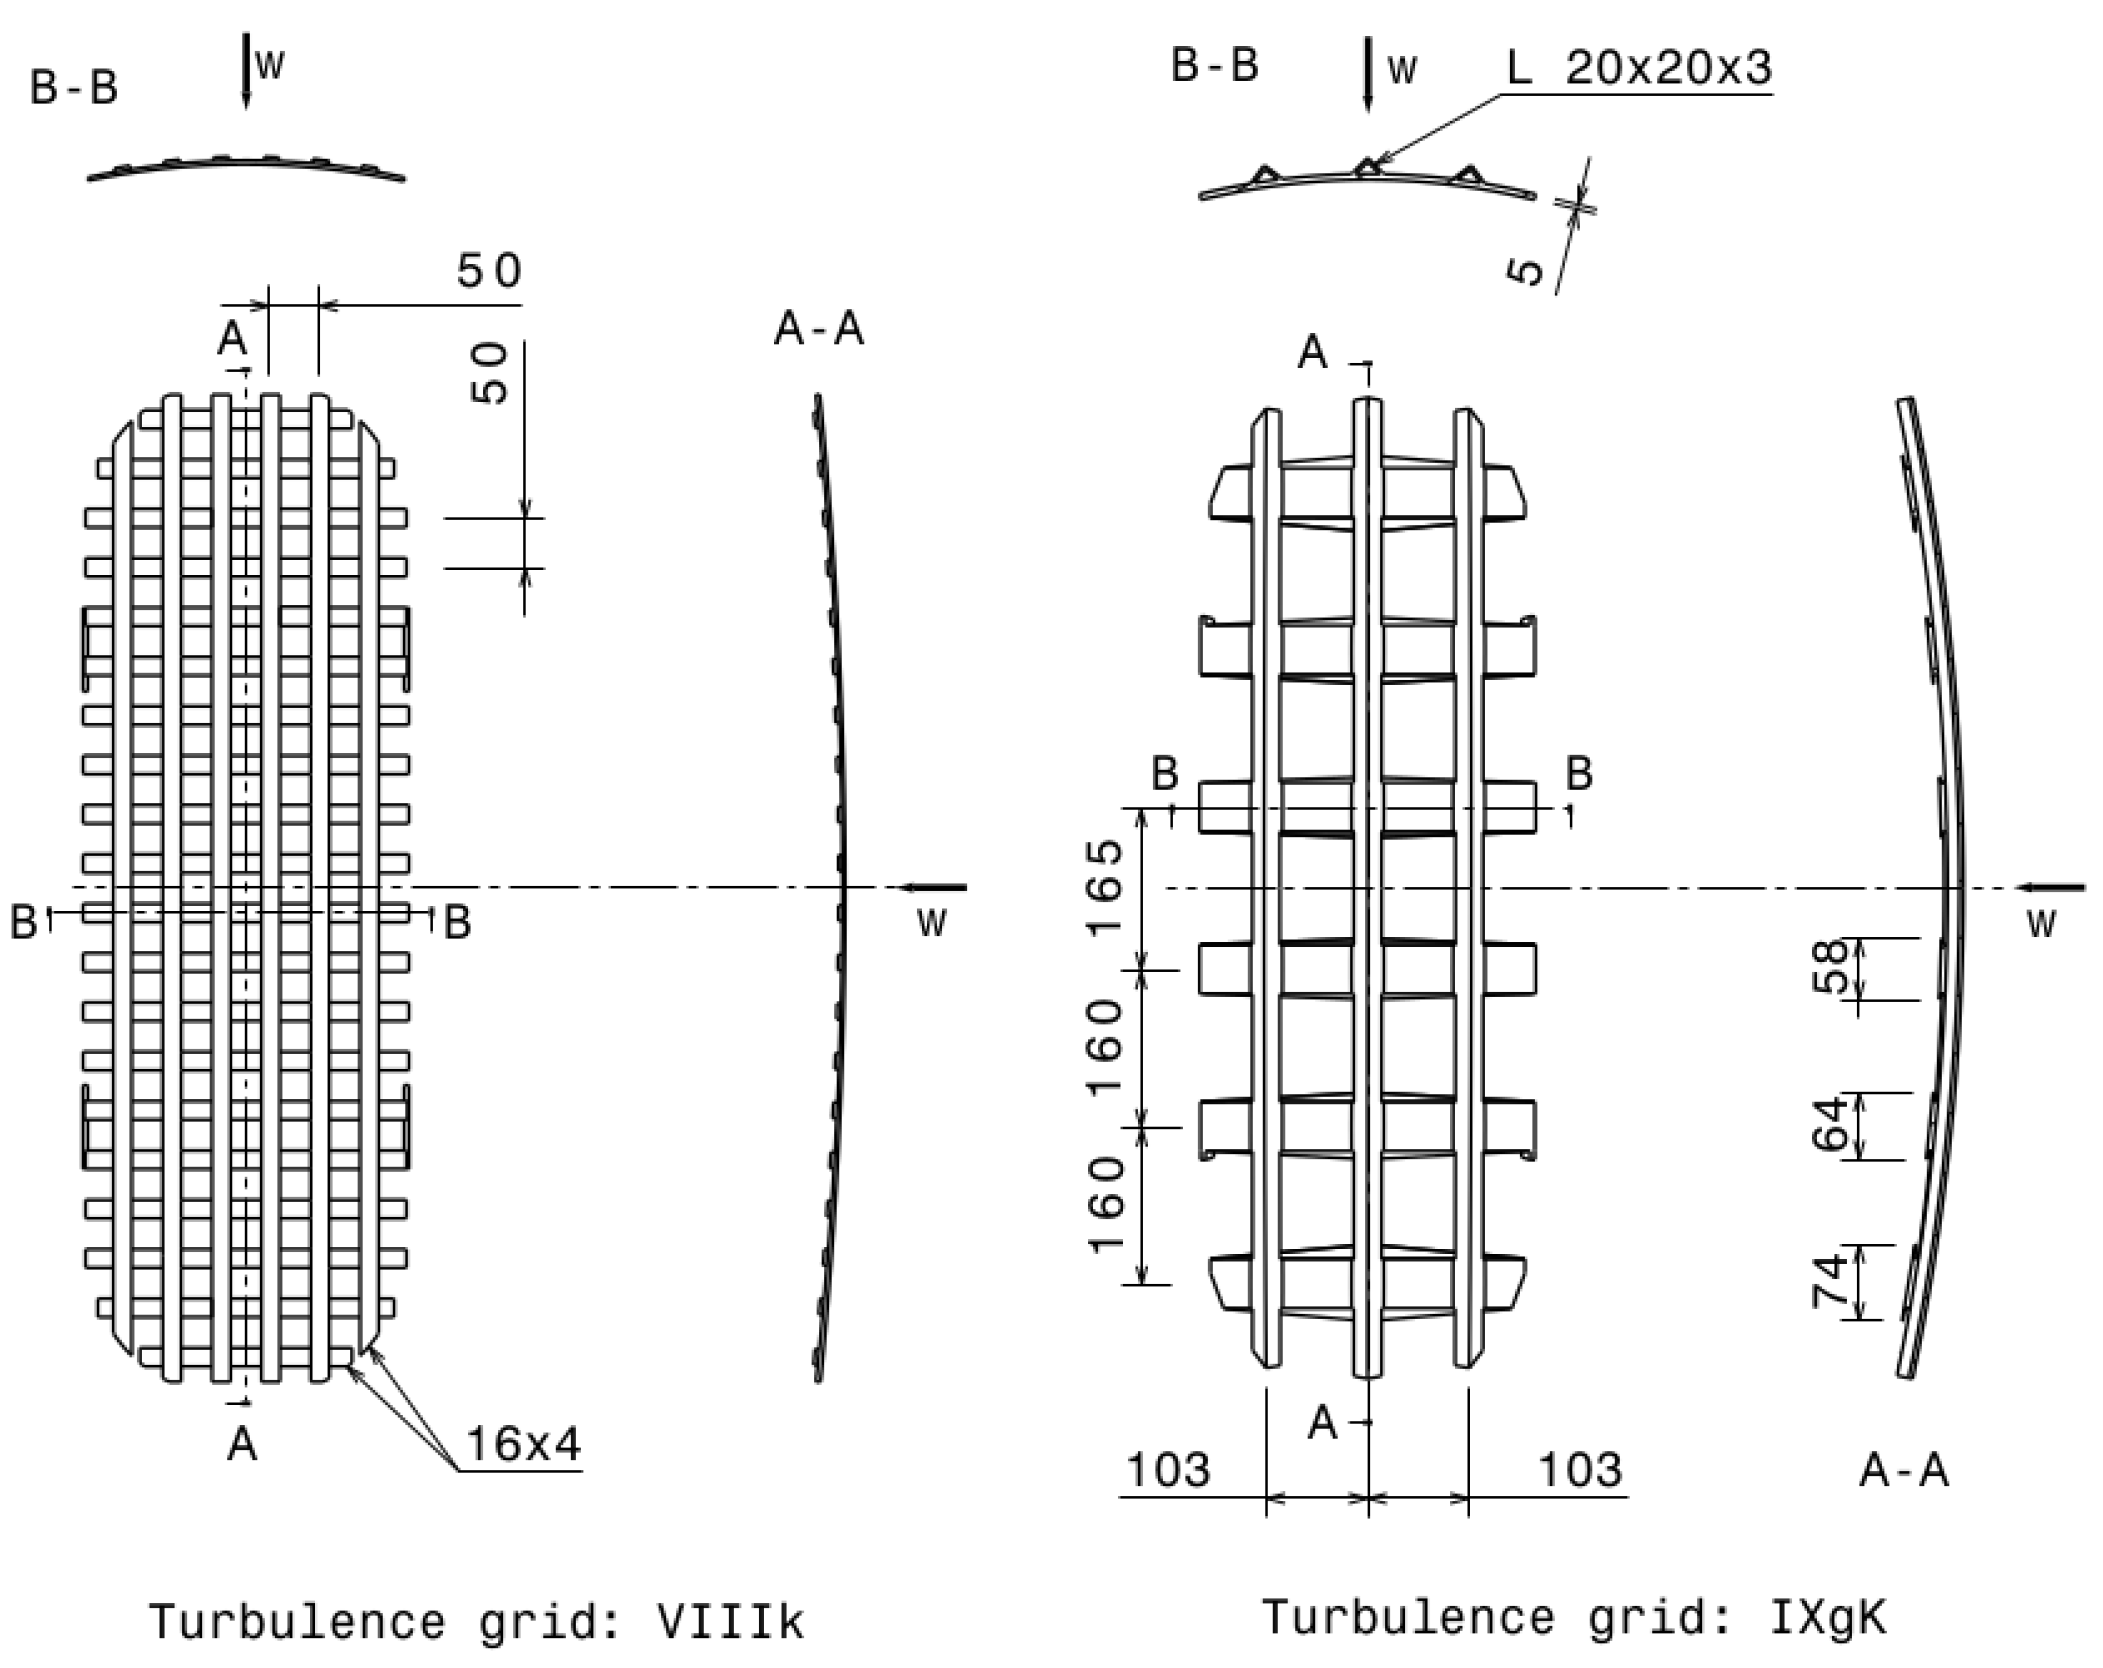
This campaign comprises the outlet plane characterization at a clean test section duct (i.e., no turbulence grid installed) featuring wind tunnel ground turbulence level as well as at elevated turbulence levels generated by two separately installed grids, named VIIIk and IXgK. These grids are typically used during cascade testing to simulate turbomachinery relevant turbulence intensities, see
Figure 7 or Kiock et al. [
9].
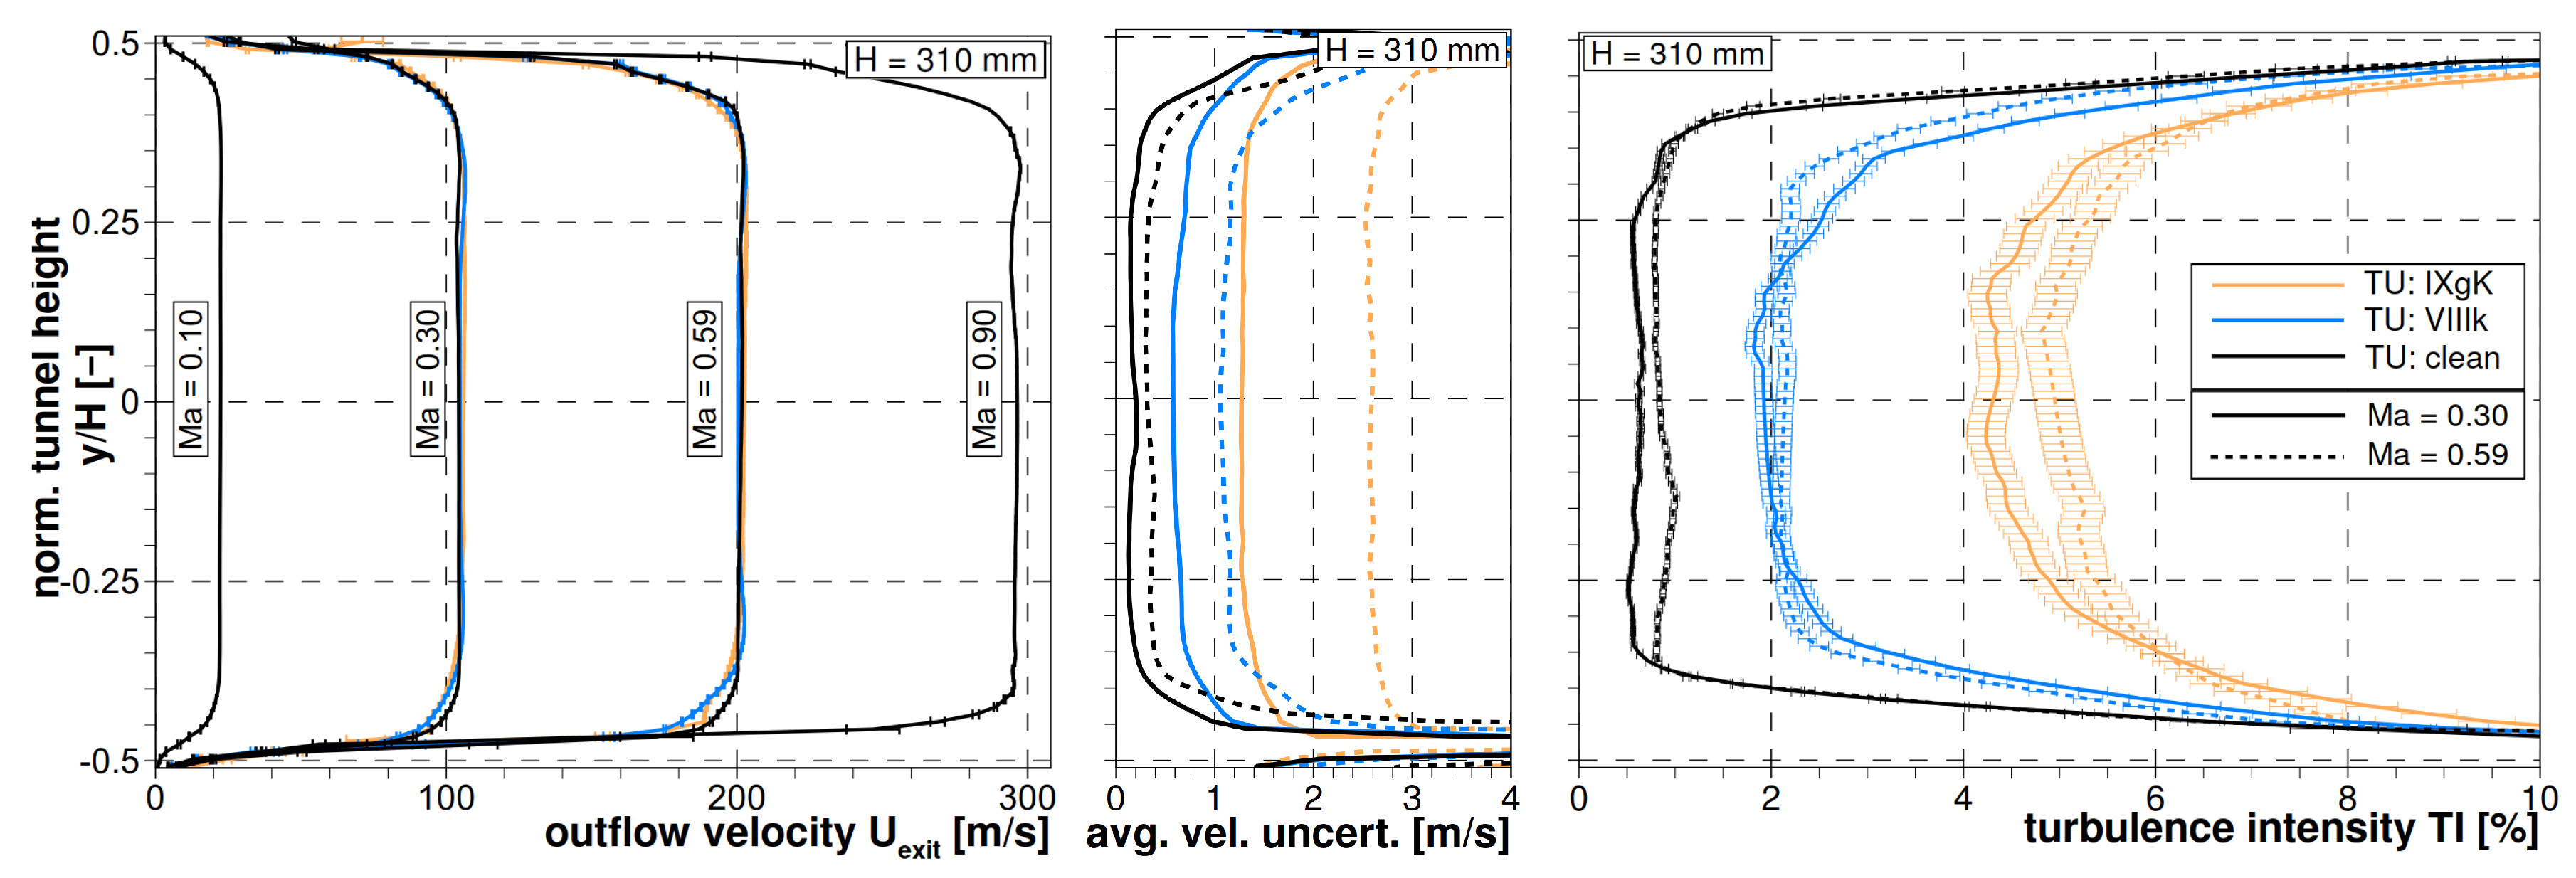
At first, outflow profiles for various outlet Mach numbers ranging from 0.1 to 0.9 are shown on the left in
Figure 8. These profiles were extracted from the PIV fields at 310 mm duct height along the intersection line between the PIV and the 5HP plane. The central and right hand side plots of
Figure 8 show profiles of the local PIV measurement uncertainty as well as the turbulence intensity
derived from the PIV data at the same positions for the clean test section (black) and individually equipped with the two turbulence grids (blue and orange) for two typical turbine and compressor cascade inlet Mach number levels
. All profiles are widely homogeneous over ~75% of the normalized tunnel height, except for the boundary layer regions in the proximity of the lower and upper duct walls. As loss characterization in case of cascade testing is typically performed for the central blade(s) placed around mid-duct height, the flow homogeneity is very good and the deficit in the boundary layer regimes is of less relevance.
Apparently, the distribution exhibits a specific profile, which is a consequence of the installed turbulence grids. Anyway, the results prove that the profiles of the velocity fluctuations in the clean test section are widely homogeneous over a large duct area and that the homogeneity is widely perfect for reliable loss characterization of airfoils in the core flow region. Note that cascade testing typically is not performed without any use of a turbulence grid. As the flow in turbomachinery is featuring higher turbulence levels, usually either grid VIIIk or IXgK is selected.
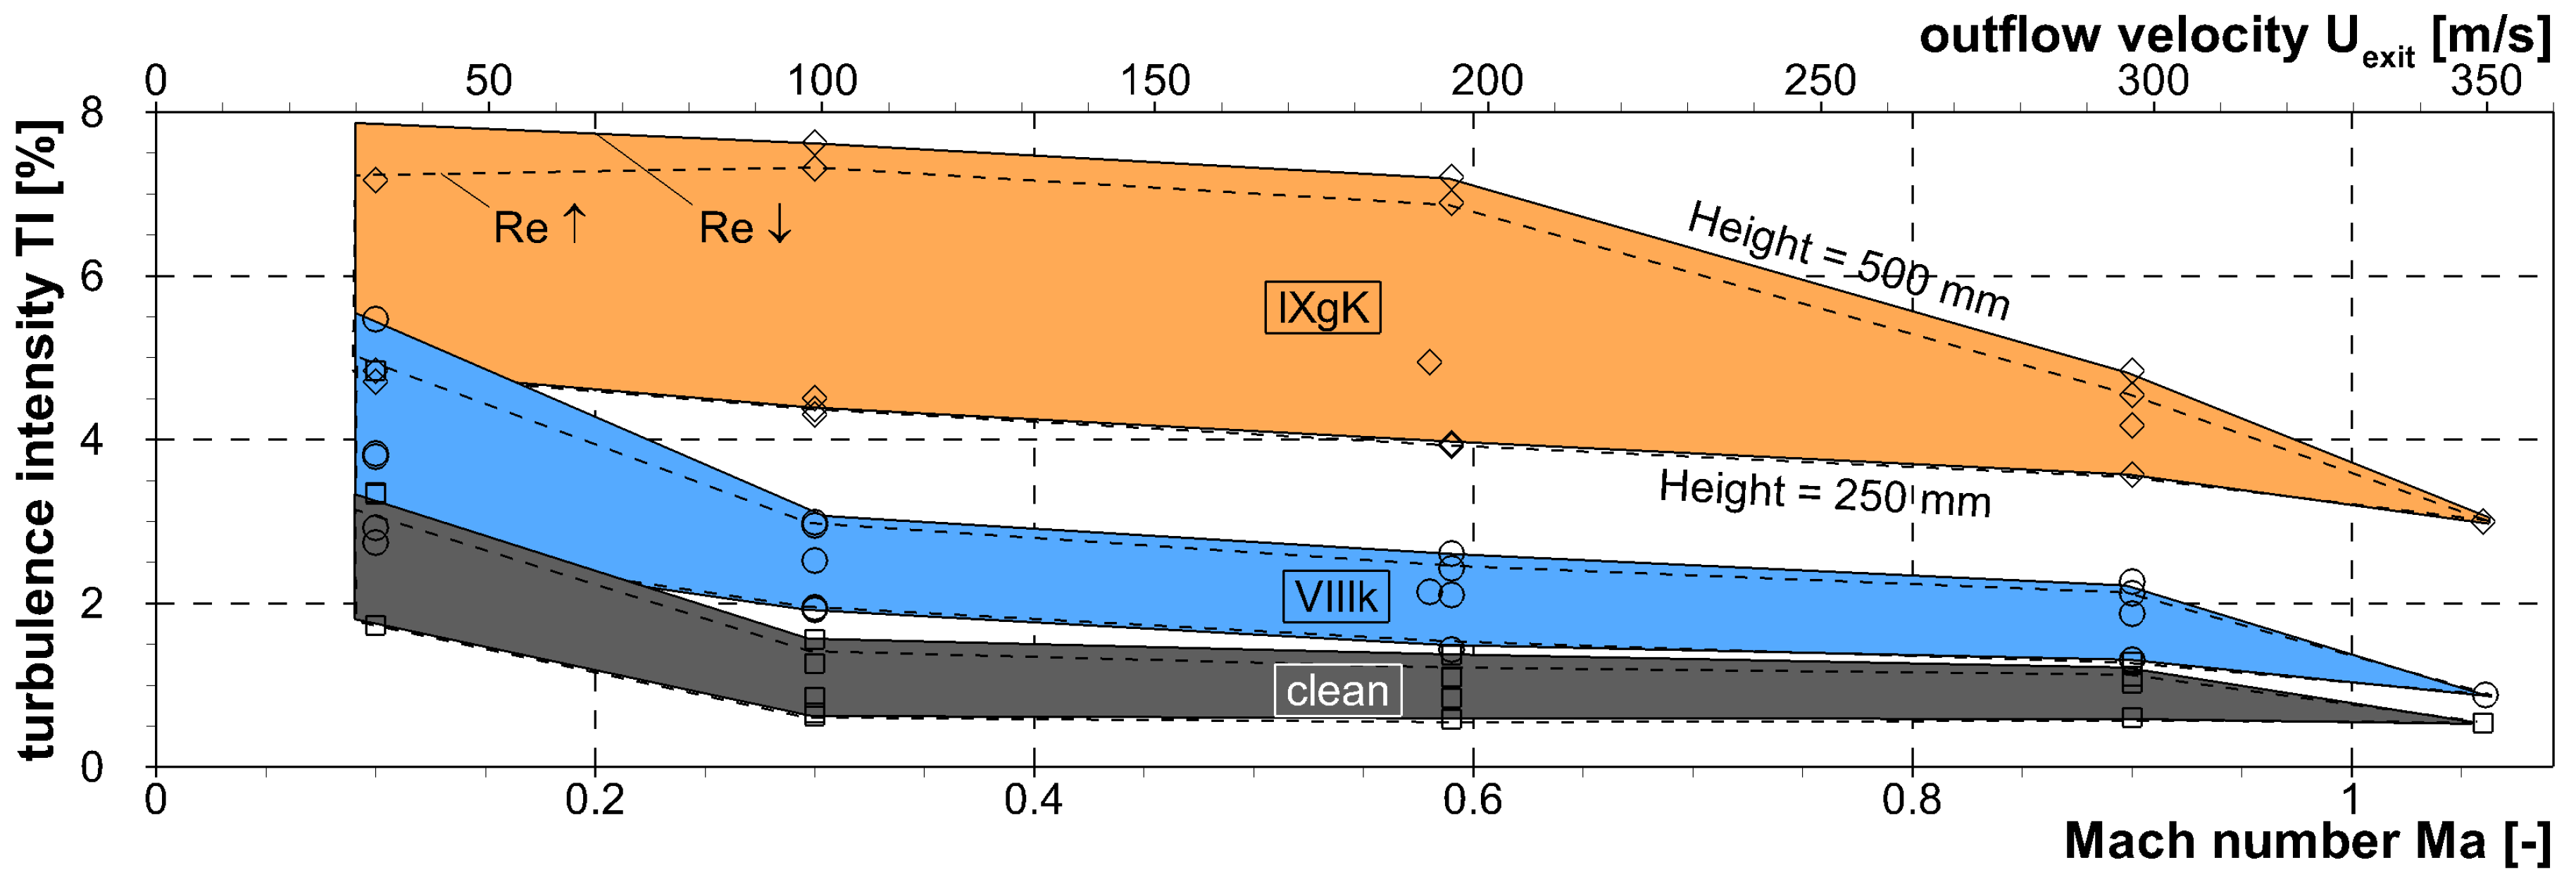
For the representation in
Figure 9, each individual
profile was averaged over
duct height around the centerline for all available PIV results across the HGK’s entire performance map. The symbols in the figure represent all measured operating points. The colored regions indicate the
range for a specific turbulence setting in between the smallest and largest duct heights and over the tested operating range. The line style distinguishes between high (dashed) and low (solid) Reynolds numbers, i.e.,
and
, respectively. In case of the largest duct height, a small influence of Reynolds number is observed. In combination with the performance map discussed above, this chart allows the assessment of expected turbulence intensity at the cascade inlet plane during test campaign planning.
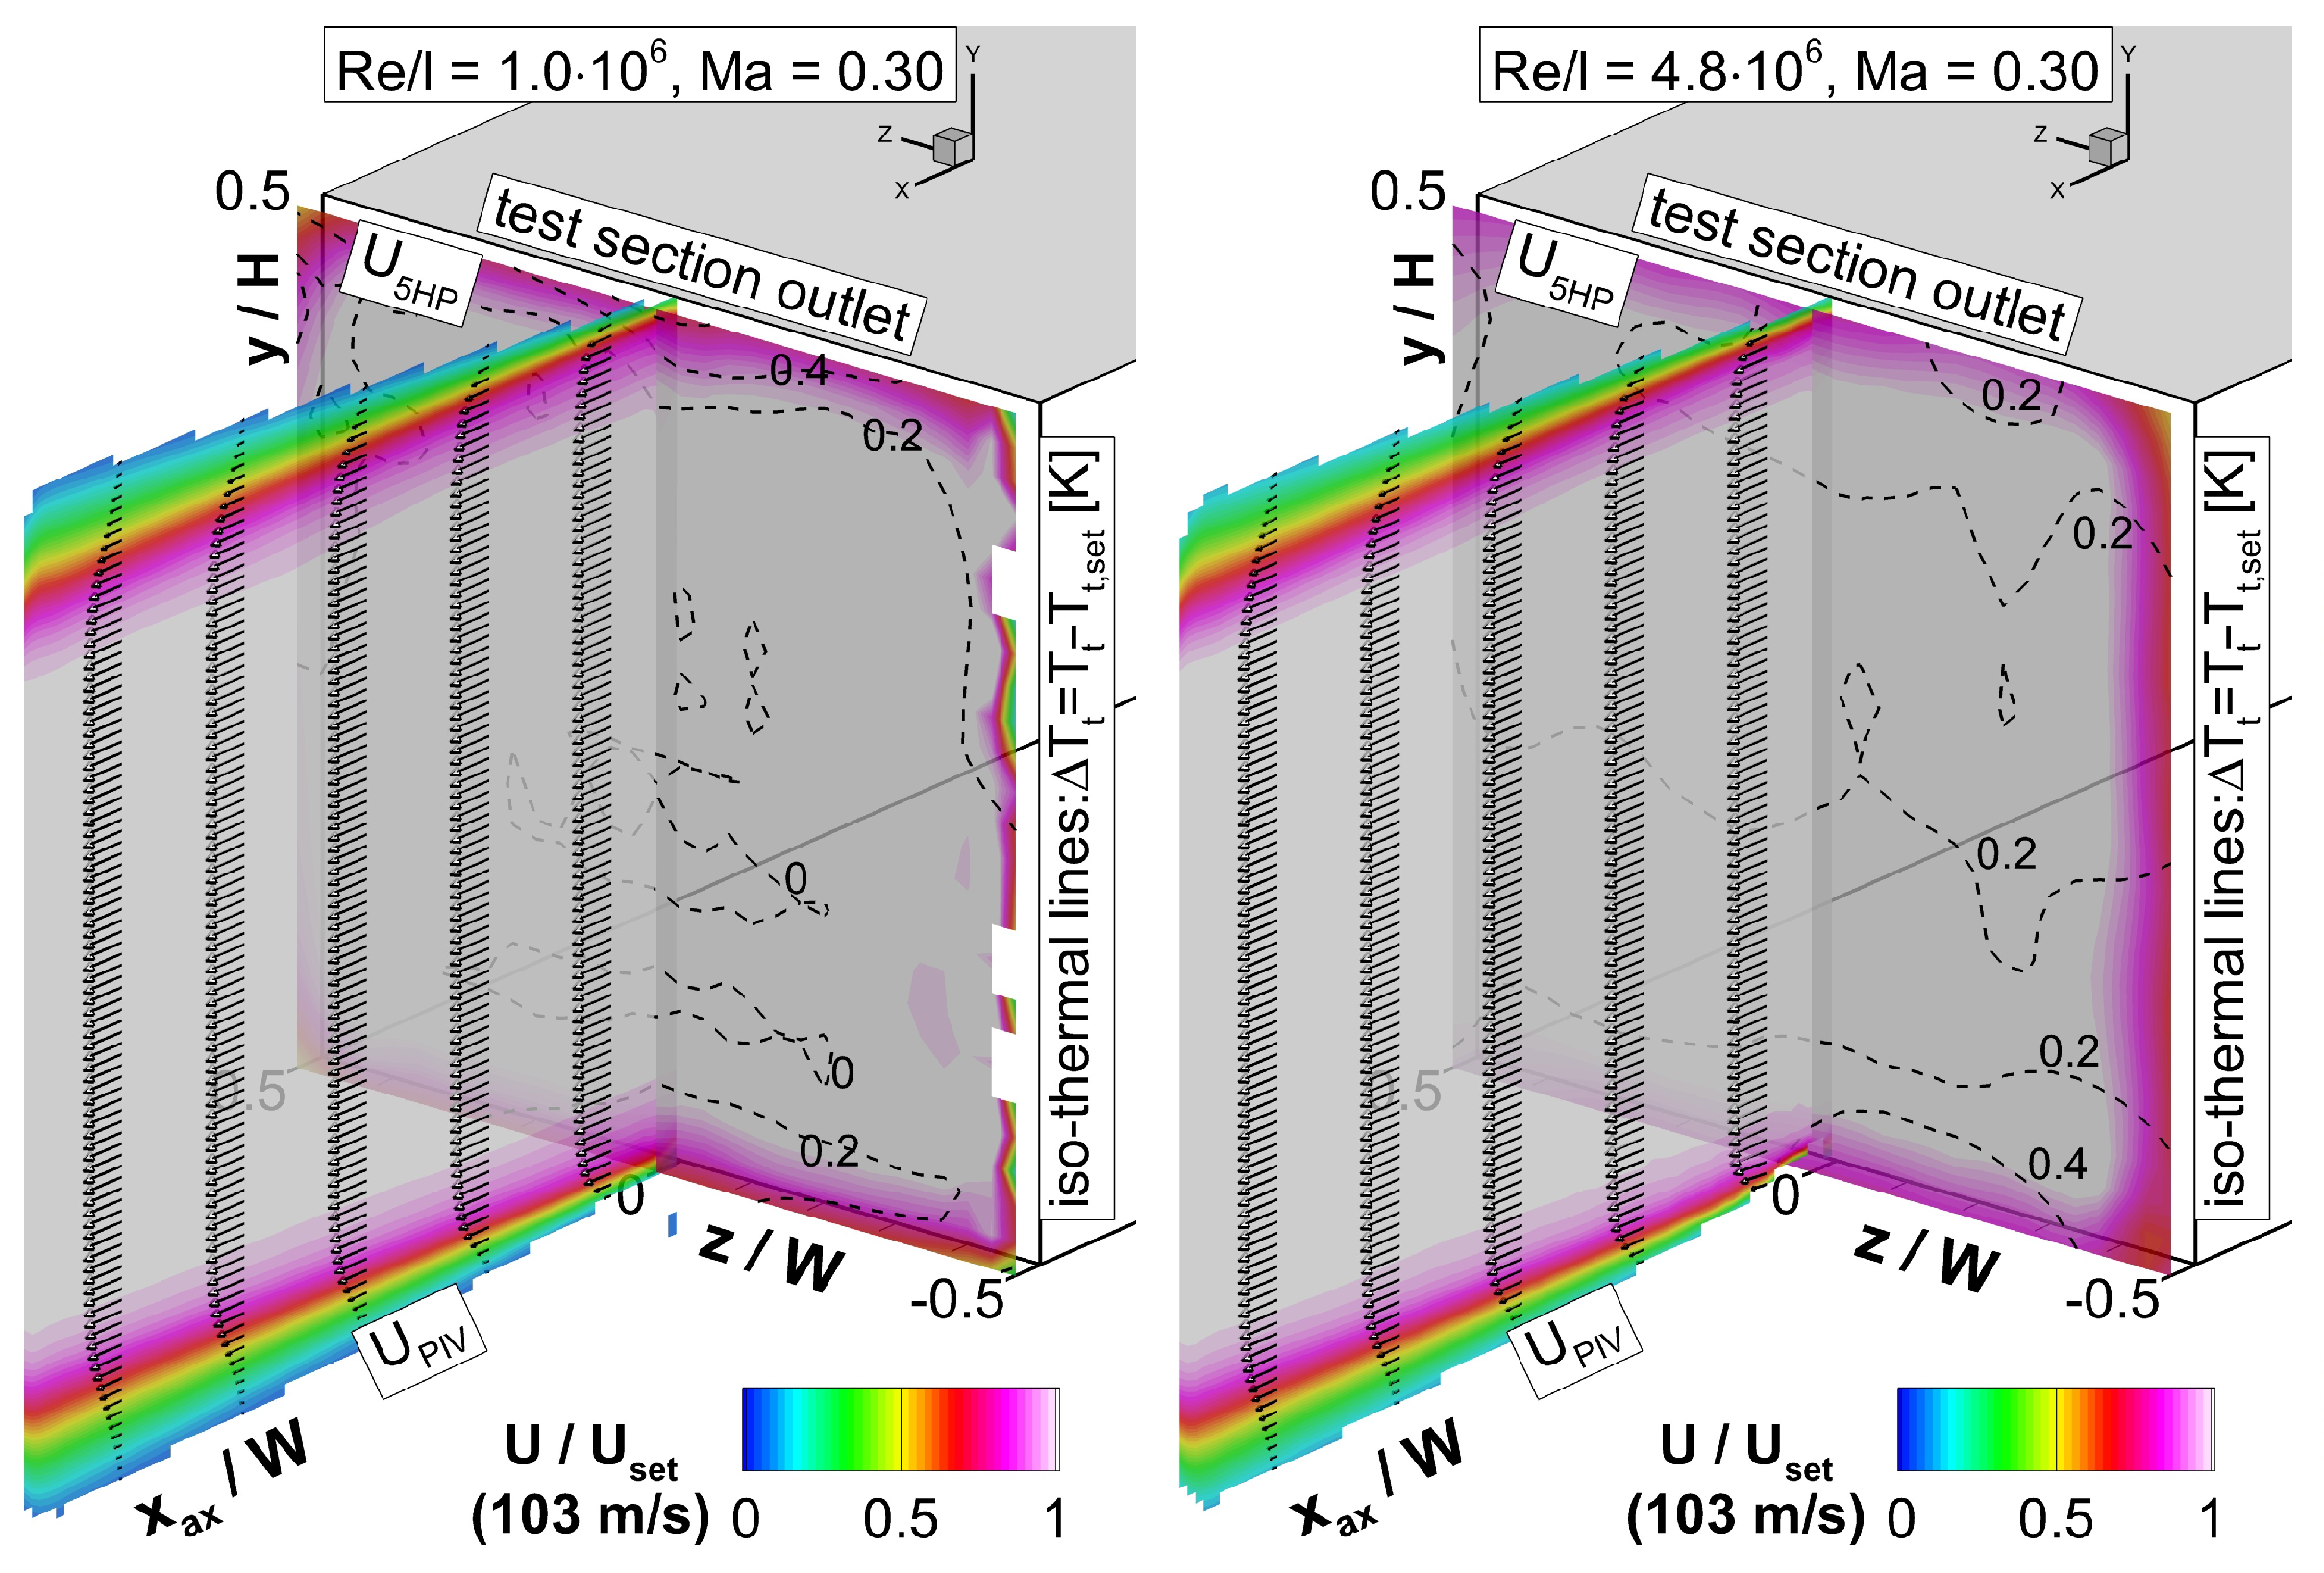
A holistic assessment of the flow quality in the measurement planes is provided in
Figure 10 by some exemplary results. The individual fields display all acquired data from the pneumatic, thermal, and velocity field measurements for three Mach and Reynolds number combinations(left:
at
, mid:
at
, right:
at
), all shown for the clean test section duct without turbulence grid. For this purpose, the five-hole probe data were converted into absolute flow velocities (
). Both the PIV and 5HP velocity fields were normalized by the target velocity of the respective operating point (
m/s and
m/s, respectively). The velocity fields in both the axial and lateral plane are in very good accordance with each other and reveal widely homogeneous core flow regions. The dashed iso-thermal lines represent the difference between the local total temperature
and the target temperature setting of the respective operation point. Locally scattered deviations of only several tenth Kelvin are present in the outflow temperature fields. The measurement uncertainty of conventional resistant thermal probes, which are installed in the settling chamber to control the operating total temperature, is usually in the same order of magnitude. This demonstrates a very good homogeneity of the temperature field as long as the main cooler is not operating at its limits. When operating the main cooler at its power limit in combination with maximum mass flow rates, local temperature deviations of up to 2 K were observed.
6. Repeatability of Test Results in the Old and New Facility
Especially in terms of airfoil performance characterization (e.g., determination of profile loss or outflow angle), it had to be demonstrated that the results of the old and revised wind tunnel facility are quantitatively comparable among each other after re-commissioning. The repeatability was tested on a transonic low pressure turbine cascade, which was investigated latest before the revision and directly after the re-commissioning using the entirely new HGK facility. As an operating point at a transonic Mach number is known to react very sensitive to any changes, e.g., caused by newly installed hardware components in the wind tunnel, the cascade’s exit Mach number of 0.95 was chosen for this specific assessment. Exemplary results of these investigations are presented in
Figure 11 in terms of the local total pressure loss coefficient
and outflow angle
, whereas the loss coefficient was normalized with the integral value from the test campaign prior to the revision. The data were measured in a wake traverse at 40% axial chord length downstream of the transonic turbine cascade across the central blades passage with a miniaturized wedge probe developed in-house. Both, the loss coefficient as well as the outflow angle distributions show an overwhelming agreement before and after the revision of the HGK. The difference in the integral total loss is only 0.11% and only 0.06
for the exit flow angle, which can be determined by the measurement uncertainty indicated by the error bars in
Figure 11. These experiments proof both, an unchanged high quality test environment after the revision and an excellent repeatability of testing in this test facility in general.
7. Available Measurement Techniques
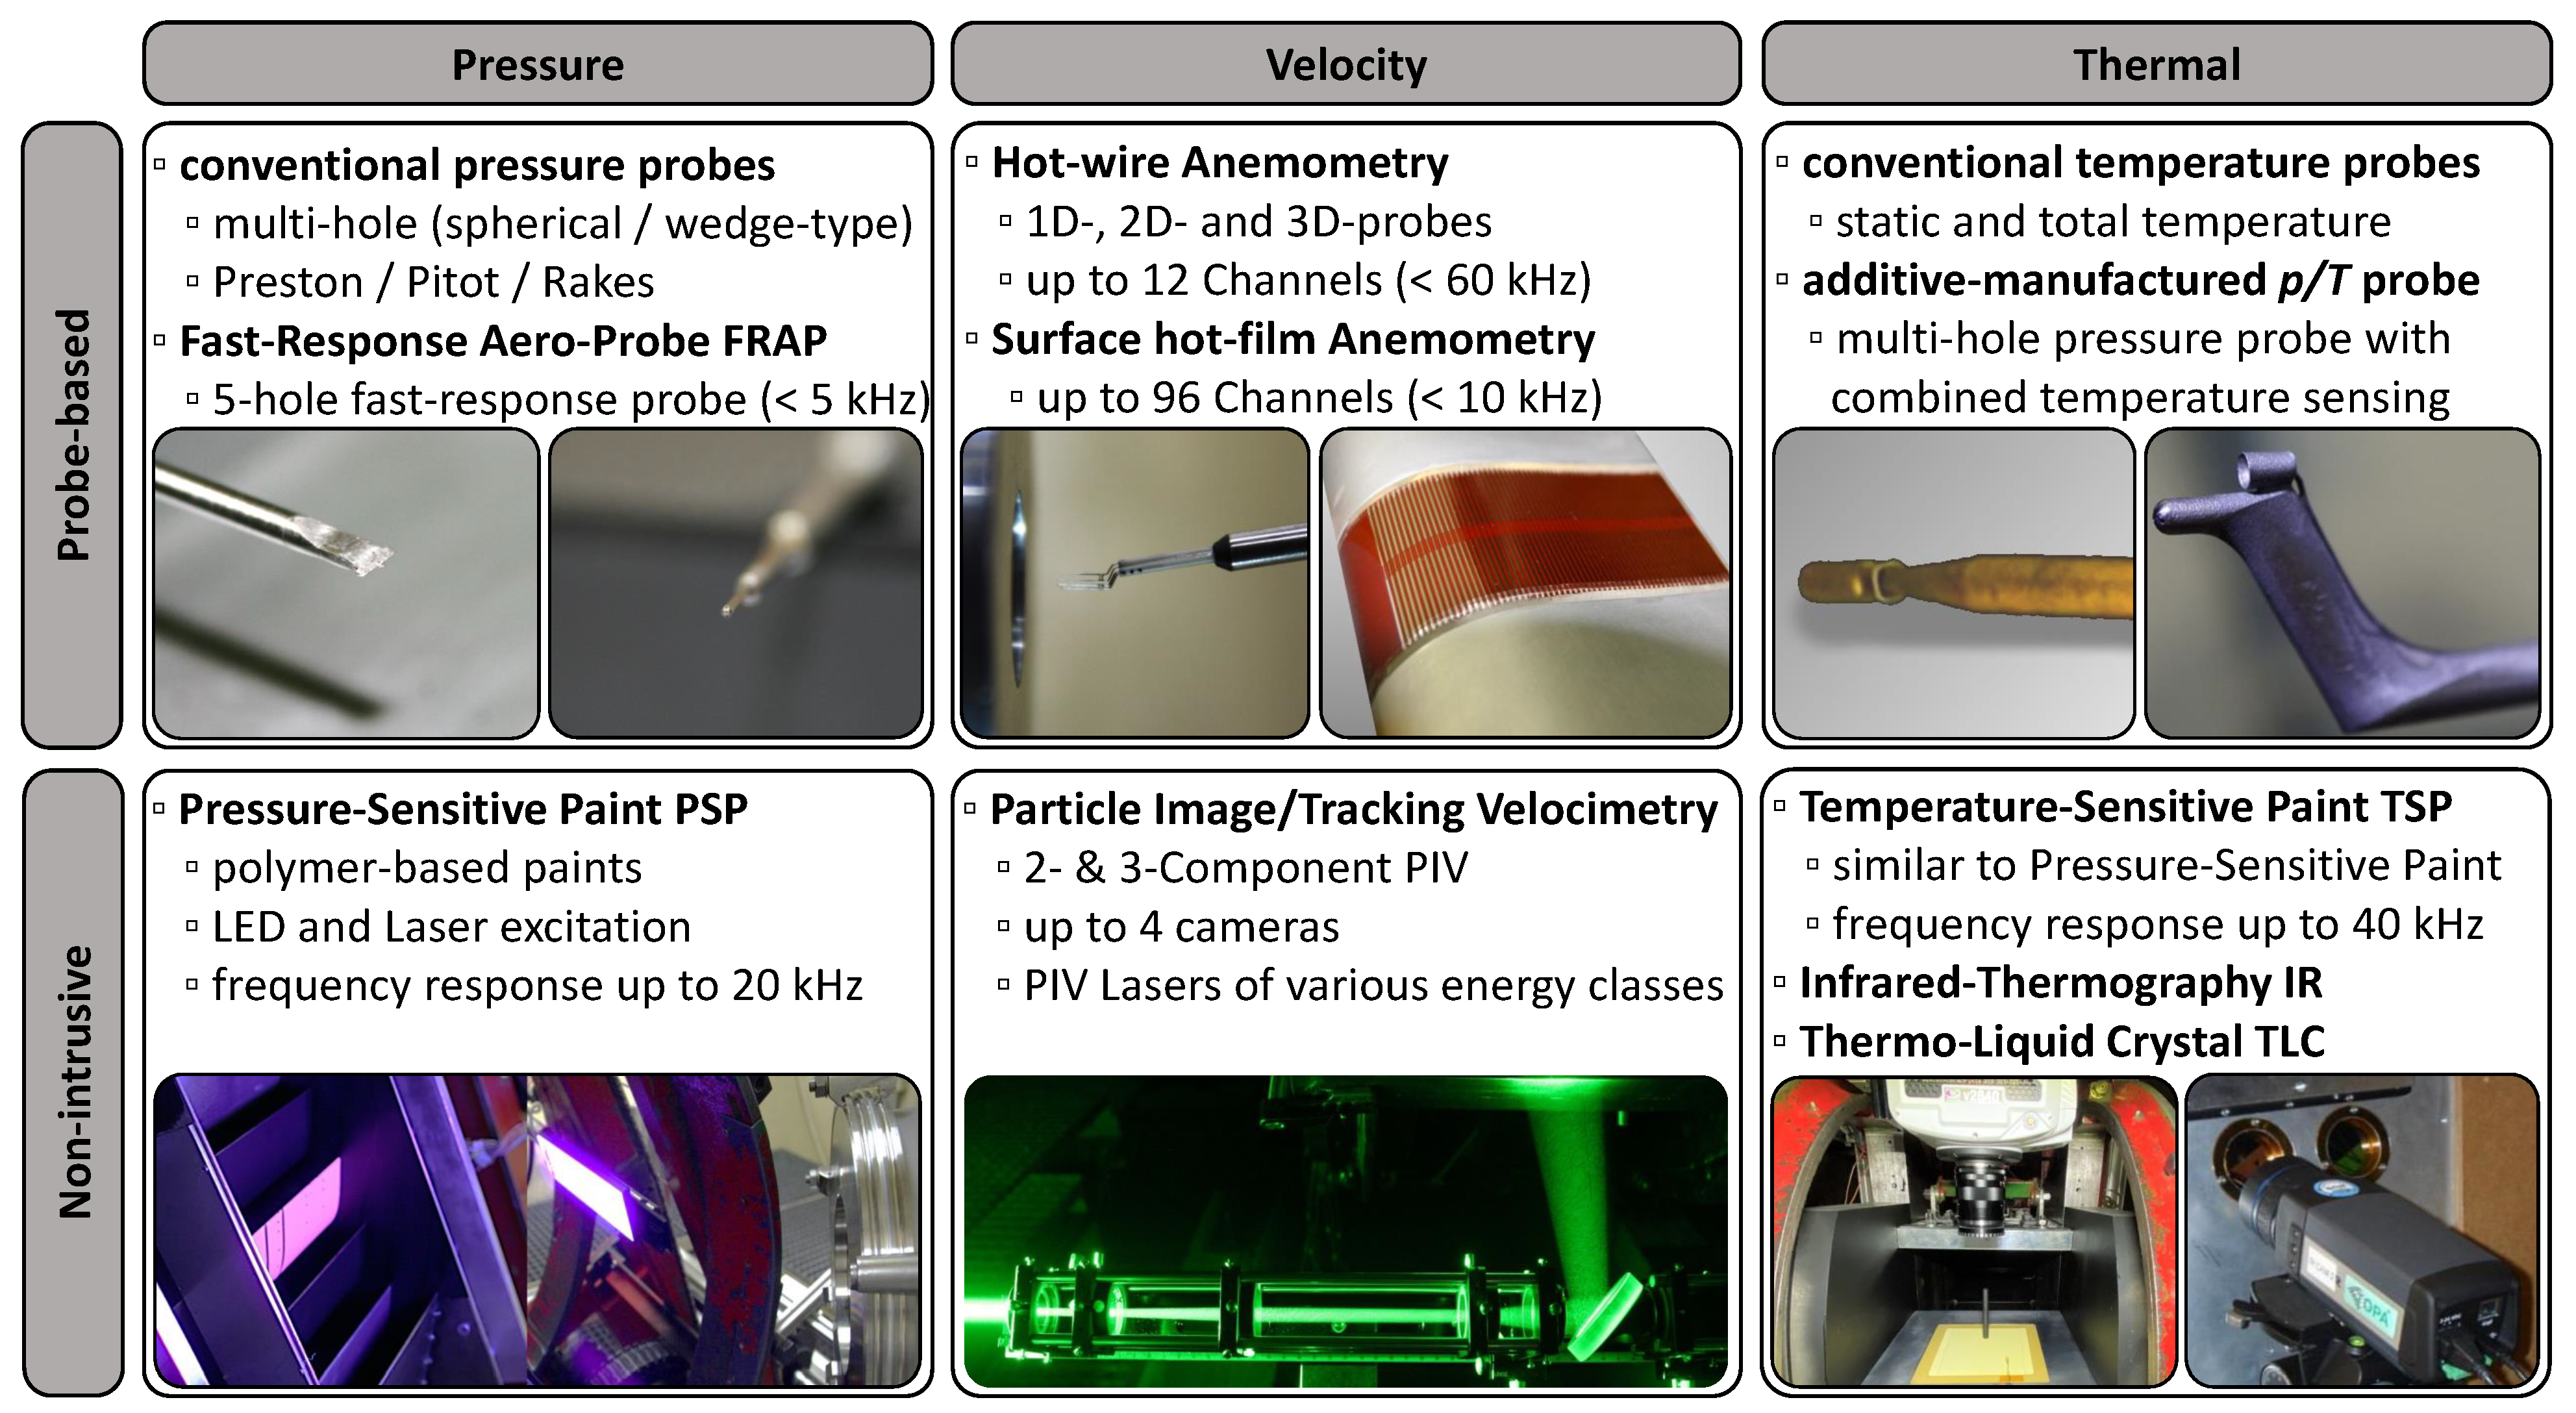
A large spectrum of measurement techniques for all requirements on steady-state or unsteady flow characterization are routinely applied in the HGK, including both probe-based as well as non-intrusive optical techniques as depicted in
Figure 12. A particular challenge for all these techniques is the testing environment at very low ambient pressure down to several hecto-Pascal and the limited access to the test specimen inside the pressure tank. This requires that the majority of the listed techniques have to be adapted for the specific use in the HGK. Due to space limitations in this paper, only a brief summary of the testing equipment portfolio can be given here and the reader is referred to the latest publications of the institute.
Details of the design and additive-manufacturing of the miniaturized five-hole wedge type probe which was already mentioned in the section above can be found in Börner and Niehuis [
10]. This probe was particularly calibrated for reliable wake traverses at high exit Mach number up to
. At these conditions, conventional blunt five-hole probes with a spherical head fail. Aberle-Kern et al. [
11] successfully proposed a methodology for loss determination downstream of cascades under consideration of thermal gradients in non-adiabatic flow fields by utilizing a newly developed combined thermal- and multi-hole probe.
Apart from the newest probe-based pressure measurements, the application of non-intrusive optical flow sensing techniques, i.e., Particle Image Velocimetry (PIV), Pressure- and Temperature-Sensitive Paints (P-/TSP) or Infrared Thermography (IR-T), was heavily raised within the last years. As all these diagnostic methods have in common the need of at least one camera, the optical access to the test specimen is inevitably required. In case, the test design requests the application of one of these techniques, the test specimen must be designed in an appropriate manner. Actively cooled LED light sources as well as CCD or CMOS cameras perfectly illuminate and capture the flow images even in the low-pressure environment. In order to prevent calibrated cameras (e.g., IR cameras) from the vacuum conditions, usually a special housing is required which can complicate an experimental setup. A PIV laser setup is also more complex compared to an atmospheric wind tunnel facility, since the laser head has to be placed outside the pressure chamber at atmospheric conditions and the routing path inside the test chamber can be very long. Therefore, it is inevitably required to couple the beam into the low-density environment with a severely different refraction index and deflect it with several mirrors to the location of interest. This is realized through a precision window and a very careful alignment of the optical path. Starting in 2016, Bitter et al. [
12] presented the application of combined PIV and PSP measurements in the HGK in order to gain a holistic view on the flow field around an LPT blade at a glance. Chemnitz and Niehuis [
8] reported on successful turbulence measurements in the 3D flow field downstream of an LP turbine cascade at high subsonic Mach numbers referencing 2D-3C PIV measurements to 3D hot-wire anemometry under low-density conditions. Bitter and Niehuis [
13] applied the same PIV technique to characterize the impact of periodically changing inlet turbulence on statistical flow quantities in the wake of an LPT cascade. Based on this, in the meanwhile, long-lasting experience in the application of non-intrusive techniques in the HGK environment has been gained. The latest achievements were the precise measurement of unsteady surface pressure fluctuations on an LPT cascade down to several Pascal by means of unsteady Pressure-Sensitive Paint (iPSP) at 6 kHz sampling rate, as reported in Bitter et al. [
14]. Recent activities seek to adapt unsteady optical temperature measurements by means of unsteady Temperature-Sensitive Paint (iTSP). First promising results of a cylinder in transonic cross flow sampled at acquisition rates of more than 20 kHz are presently under investigation. A non-intrusive but steady-state surface temperature sensing methodology for precise heat transfer estimations based on the Infrared Thermography is already available in the HGK, see Aberle et al. [
15].
8. Summary
After more than 60 years of intensive and successful operation of the High-Speed Cascade Wind Tunnel at Bundeswehr University Munich, this unique test facility was subject to a major revision and upgrade recently. In this context the entire drive train, the axial compressor, oil system, and the main air cooler were exchanged by more powerful components featuring state-of-the-art technologies. For the most challenging component, which turned out to be the axial compressor, finally a very attractive and tailored solution was found for replacement. Within a remarkably short downtime of only four months, the entire revision as well as the successful re-commissioning of the test facility was realized. The new HGK finally features an extended operation range (e.g., up to 50% higher Reynolds number) which extends the research portfolio to stationary gas turbine applications or HPT (high-pressure turbine) investigations which have often been requested in the past but could never be serviced before. The test facility with its new features and equipment now fulfills all demands on a modern test facility. The new actuators together with the control systems very soon enable long lasting test campaigns under very stable and automatically controlled operating conditions down to and never having been reached in the past. A huge variety of machine operating data not just simplifies trouble shooting during testing but also enables health monitoring and lifetime surveillance. With a powerful real-time data acquisition system in combination with many classical and modern measurement techniques, the new HGK is now well prepared and even more attractive for research needs and challenges in the future.
Author Contributions
Investigation, methodology, software, visualization, and validation, M.B.; conceptualization, writing, reviewing and editing, formal analysis, and data curation, R.N. and M.B.; resources, project administration, supervision, and funding, R.N. All authors have read and agreed to the published version of the manuscript.
Funding
The authors express their special thanks to the chancellor of the Bundeswehr University Munich, Siegfried Rapp, for his kind support of the project making the necessary budget available.
Institutional Review Board Statement
Not applicable.
Informed Consent Statement
Not applicable.
Data Availability Statement
The authors provide no supplemantary data.
Acknowledgments
The authors thank Ingenieurbüro Isler AG for the planning, project management, and successful completion of the entire revision. Thanks are also due to MAN for their support and willingness to develop and manufacture a tailored compressor for the HGK. In particular, it was Kai Ziegler at MAN, who had an open ear for all wishes and demands of the institute and made the successful cooperation possible right from the start. Special thanks go to the two technicians of the institute, Wilfried Ehrlich and Franz Grabendorfer, who actively supported the revision, and to the former chief engineer of the institute, Reinaldo Gomes, being a very valuable support with his profound experience during the planning phase.
Conflicts of Interest
The authors declare no conflict of interest.
Abbreviations
| 5HP | five-hole probe |
| HGK | High-Speed Cascade Wind Tunnel at the Bundeswehr University in Munich |
| IR-T | Infrared-Thermography |
| LPT | Low-Pressure Turbine |
| PIV | Particle Image Velocimetry |
| P-/TSP | Pressure-/Temperature-Sensitive Paint |
| ref | reference condition |
Symbols
| test section dimensions (height, width) |
| l | characteristic length |
| Mach number |
| mass flow |
| N | shaft rotational speed |
| static; total pressure |
| P | electrical power |
| q | dynamic pressure |
| Reynolds number; Re based on unit length m |
| static; total temperature |
| turbulence intensity |
| U | velocity vector |
| cascade outflow angle |
| specific heat ratio |
| ; | statistical quantities for operating stability |
| total pressure loss coefficient |
References
- Schlichting, H. The Variable Density High Speed Cascade Wind Tunnel of the Deutsche Forschungsanstalt für Luftfahrt Braunschweig; AGARD Report; NATO: Paris, France, 1956; Volume 91. [Google Scholar]
- Scholz, N.; Hopkes, U. Der Hochgeschwindigkeits-Gitterwindkanal der Deutschen Forschungsanstalt für Luftfahrt Braunschweig. Forsch. Auf Dem Geb. Des Ingenieurwesens 1959, 25, 5. (In German) [Google Scholar] [CrossRef]
- Sturm, W.; Fottner, L. The High-Speed Cascade Wind Tunnel of the German Armed Forces University Munich. In Proceedings of the 8th Symposium on Measuring Techniques for Transonic and Supersonic Flows in Cascades and Turbomachines, Genoa, Italy, 24–25 October 1985. [Google Scholar]
- European Commission. Flightpath 2050 Europe’s Vision for Aviation, Report of the High-Level Group on Aviation Research; European Commission: Brussels, Belgium, 2011. [Google Scholar] [CrossRef]
- Acton, P.; Fottner, L. The Generation of Instationary Flow Conditions in the High-Speed Cascade Wind Tunnel of the German Armed Forces University Munich. In Proceedings of the 13th Symposium on Measurement Techniques, Zurich, Switzerland, 5–6 September 1996. [Google Scholar]
- Ziegler, K.; Eisenberg, B.; Hörmeyer, K.; Emmrich, R.; Ressing, H. Development of a Novel Axial Compressor Generation for Industrial Applications–Part 1: Compressor Design and Performance. In Proceedings of the ASME Turbo Expo 2014, Düsseldorf, Germany, 16–20 June 2014. [Google Scholar]
- Anding, D.; Ressing, H.; Hörmeyer, K.; Pisch, R.; Ziegler, K. Development of a Novel Axial Compressor Generation for Industrial Applications–Part 2: Blade Mechanics. In Proceedings of the ASME Turbo Expo 2014, Düsseldorf, Germany, 16–20 June 2014. [Google Scholar]
- Chemnitz, S.; Niehuis, R. A Comparison of Turbulence Levels from Particle Image Velocimetry and Constant Temperature Anemometry Downstream of a Low-Pressure Turbine Cascade at High-Speed Flow Conditions. J. Turbomach 2020, 142, 071008. [Google Scholar] [CrossRef]
- Kiock, R.; Laskowski, G.; Hoheisel, H. Die Erzeugung Höherer Turbulenzgrade in der Meßstrecke des Hochgeschwindigkeits-Gitterwindkanales, Braunschweig, zur Simulation Turbo-Maschinenähnlicher Bedingungen; Technical Report, DFVLR-FB 82-25; DFVLR: Braunschweig, Germany, 1982. [Google Scholar]
- Börner, M.; Niehuis, R. Development of an Additive Manufactured Miniaturized Wedge Probe Optimized for 2D Transonic Wake Flow Measurements. In Proceedings of the XXIV Biannual Symposium on Measuring Techniques in Turbomachinery, Prague, Czech Republic, 29–31 August 2018. [Google Scholar]
- Aberle-Kern, S.; Niehuis, R.; Ripplinger, T. Loss determination at a linear cascade under consideration of thermal effects. Aeronaut. J. 2020, 124, 1592–1614. [Google Scholar] [CrossRef]
- Bitter, M.; Kurz, J.; Kähler, C.J.; Niehuis, R. Investigations of a low pressure turbine blade by means of simultaneous optical velocity and pressure measurements. In Proceedings of the 18th International Symposium on Applications of Laser Techniques to Fluid Mechanics, Lisbon, Portugal, 4–7 July 2016. [Google Scholar]
- Bitter, M.; Niehuis, R. Effects of Periodic Inflow Turbulence on the Statistics in the Wake of a Linear LPT Cascade at Jet-Engine Relevant Test Conditions. In Proceedings of the 13th International Symposium Particle Image Velocimetry-ISPIV 2019, Munich, Germany, 22–24 July 2019. [Google Scholar]
- Bitter, M.; Stotz, S.; Niehuis, R. On High-Resolution Pressure Amplitude and Phase Measurements Comparing Fast-Response Pressure Transducers and Unsteady Pressure-Sensitive Paint. J. Turbomach 2021, 143, 031012. [Google Scholar] [CrossRef]
- Aberle, S.; Bitter, M.; Hoefler, F.; Carretero Benignos, J.; Niehuis, R. Implementation of an In-situ Infrared Calibration Method for Precise Heat Transfer Measurements on a Linear Cascade. J. Turbomach 2019, 141, 021004. [Google Scholar] [CrossRef] [Green Version]
Figure 1.
Main components of the High-Speed Cascade Wind Tunnel before revision.
Figure 1.
Main components of the High-Speed Cascade Wind Tunnel before revision.
Figure 2.
New 3-stage axial compressor (left: during installation, right: final assembly).
Figure 2.
New 3-stage axial compressor (left: during installation, right: final assembly).
Figure 3.
Main components of the High-Speed Cascade Wind Tunnel after revision.
Figure 3.
Main components of the High-Speed Cascade Wind Tunnel after revision.
Figure 4.
Maximum achievable mass flow, total pressure ratio, unit Reynolds number, and Mach number versus old and new facility’s power setting under atmospheric condition ( hPa).
Figure 4.
Maximum achievable mass flow, total pressure ratio, unit Reynolds number, and Mach number versus old and new facility’s power setting under atmospheric condition ( hPa).
Figure 5.
Performance map of the HGK for different test section heights H over the facility’s static and dynamic pressure range (solid blue) and (dashed blue), respectively (at ).
Figure 5.
Performance map of the HGK for different test section heights H over the facility’s static and dynamic pressure range (solid blue) and (dashed blue), respectively (at ).
Figure 6.
Statistics of the operating point stability for Mach number (left) and Reynolds number (right) extracted from the continuous logs for more than 330 h of HGK testing.
Figure 6.
Statistics of the operating point stability for Mach number (left) and Reynolds number (right) extracted from the continuous logs for more than 330 h of HGK testing.
Figure 7.
Geometry details of two commonly used turbulence grids VIIIk (left) and IXgK (right).
Figure 7.
Geometry details of two commonly used turbulence grids VIIIk (left) and IXgK (right).
Figure 8.
Left: Outflow velocity profiles across the entire channel height of mm at different operating Mach numbers measured with 2D-3C PIV; center: absolute velocity uncertainty of avg. vector field; right: corresponding turbulence intensity profiles including the local error bars for the clean test section duct (black-clean) and equipped with the turbulence grids (blue-VIIIk; orange-IXgK) at two outflow Mach numbers (solid) and (dashed).
Figure 9.
Distribution of the integral turbulence intensity across the HGK’s entire performance map. was measured with 2D-3C PIV and averaged between without turbulence generator (black-clean) and for both turbulence grids (blue-VIIIk) and (orange-IXgK).
Figure 9.
Distribution of the integral turbulence intensity across the HGK’s entire performance map. was measured with 2D-3C PIV and averaged between without turbulence generator (black-clean) and for both turbulence grids (blue-VIIIk) and (orange-IXgK).
Figure 10.
Outflow topology at the HGK’s test section outlet measured with 5-hole probe, stereo-PIV and a total temperature probe for m at (left), m at (middle) and m at (right). The dashed iso-thermal lines show the local difference in the flow temperature according to the total temperature setting C.
Figure 11.
Profile loss characterization (left) and outflow angle measurements (right) on a transonic turbine cascade, before and after revision.
Figure 11.
Profile loss characterization (left) and outflow angle measurements (right) on a transonic turbine cascade, before and after revision.
Figure 12.
Portfolio of measurement techniques commonly applied in the HGK.
Figure 12.
Portfolio of measurement techniques commonly applied in the HGK.
| Publisher’s Note: MDPI stays neutral with regard to jurisdictional claims in published maps and institutional affiliations. |
© 2021 by the authors. Licensee MDPI, Basel, Switzerland. This article is an open access article distributed under the terms and conditions of the Creative Commons Attribution (CC BY-NC-ND) license (https://creativecommons.org/licenses/by-nc-nd/4.0/).
