1. Introduction
In rotor–stator cavities, which are found in all radial turbomachines, complex flow patterns occur and influence axial thrust on the shaft as well as disc-friction torque. During the design phase of radial turbomachinery, to design axial bearings reliably we have to know the maximum axial thrust on the shaft with sufficient precision. Moreover, if the geometry of the cavities is designed carefully, losses due to friction can be minimised and efficiency maximised.
The first thorough experimental study of turbulent rotor–stator cavity flow was conducted by Daily and Nece [
1], who designed a test rig able to reach Reynolds numbers up to
. Based on their torque and velocity distribution measurements, they identify two turbulent flow regimes in which rotor and stator boundary layers are either merged or separated. When these layers are separated, velocity measurements indicate the existence of a fluid core in the cavity middle, where radial velocity is negligible and circumferential velocity varies only with radius, not with axial coordinate. The existence of these flow regimes depends on circumferential Reynolds number
and relative axial gap width, defined as the ratio of axial gap width to disc outer radius. They also provide empirical correlations for the torque coefficient
for each flow regime, allowing turbomachinery designers to estimate disc torque and machine efficiency during the design phase.
In [
2], models for rotor–stator cavity flow with through-flow are introduced which are based on assumed velocity profiles and wall shear stress measurements. The models allow for the calculation of radial pressure distribution and axial thrust for the cases of closed cavity and centripetal through-flow. Additionally, in the through-flow case, they take into account the angular momentum flux into the cavity. This paper tests the validity of these models at a large Reynolds number range.
Radtke and Ziemann [
3] experimentally investigated not only closed rotor–stator cavities, but also centripetal and centrifugal through-flow with and without preswirl alongside variations of the cavity geometry. We compare our measurement results to theirs.
Poncet et al. [
4] investigated turbulent flow with separated boundary layers in a rotor–stator cavity with and without centripetal through-flow in the Reynolds number range of
at relative cavity widths of
. In their paper, Laser Doppler Anemometry measurements of core swirl ratio are compared to predictions based on measurements of radial pressure distribution. Using the
power law for the boundary layer velocity profiles, they derived a theoretical model for the core swirl ratio
which is calibrated using the measurement results. The validity of their model is reported for a wide range of Reynolds numbers and through-flow mass fluxes.
Poncet et al. [
5] proposed a new Reynolds stress turbulence model suitable for numerical investigations of rotor–stator cavity flow that is reported to be superior to
k-
turbulence models for this application. They investigated the mean flow structure, the core swirl ratio, the radial pressure distribution and turbulence statistics for closed cavities, and centripetal as well as centrifugal through-flow. Their paper gives a comprehensive summary of flow structures with separated boundary layers inside rotor–stator cavities.
Will [
6] investigated centripetal and centrifugal flow in a rotor–stator cavity, using analytical, experimental and numerical methods. He developed a new one-dimensional flow model of core swirl ratio, assuming separated boundary layers and using the logarithmic law of the wall.
Wang et al. [
7] performed particle image velocimetry measurements in a water-filled microscale rotor–stator cavity made of glass with smooth compared to hydrophobic discs at low Reynolds numbers. They found a reduction of torque of more than 50% when using hydrophobic rotors, which was attributed to a thin air layer between disc and liquid in the case of hydrophobic rotor surfaces and to a reduction of turbulence intensity.
In the present study, experimental results of two rotor–stator test rigs are combined to study how disc torque, radial pressure distribution and axial thrust are influenced by Reynolds number, cavity width, centripetal through-flow and angular momentum flux into the cavity. The small test rig is operated with water, can be equipped with different discs with an outer radius of
each and is made of PMMA (Plexiglass). It covers a Reynolds number range of
and an axial gap width range of
. A more detailed description can be found in [
8,
9,
10]. The large test rig, first introduced by Barabas et al. [
11], can reach Reynolds numbers up to
since it has a large disc radius and is operated with carbon dioxide. Relative gap widths of
are investigated in this test rig. Both rigs allow the superimposition of centripetal through-flow with different inlet swirl angles. Only corotating inlet swirl is investigated.
2. Rotor–Stator Cavity Test Rigs, Measurement Procedures and Uncertainty Calculation
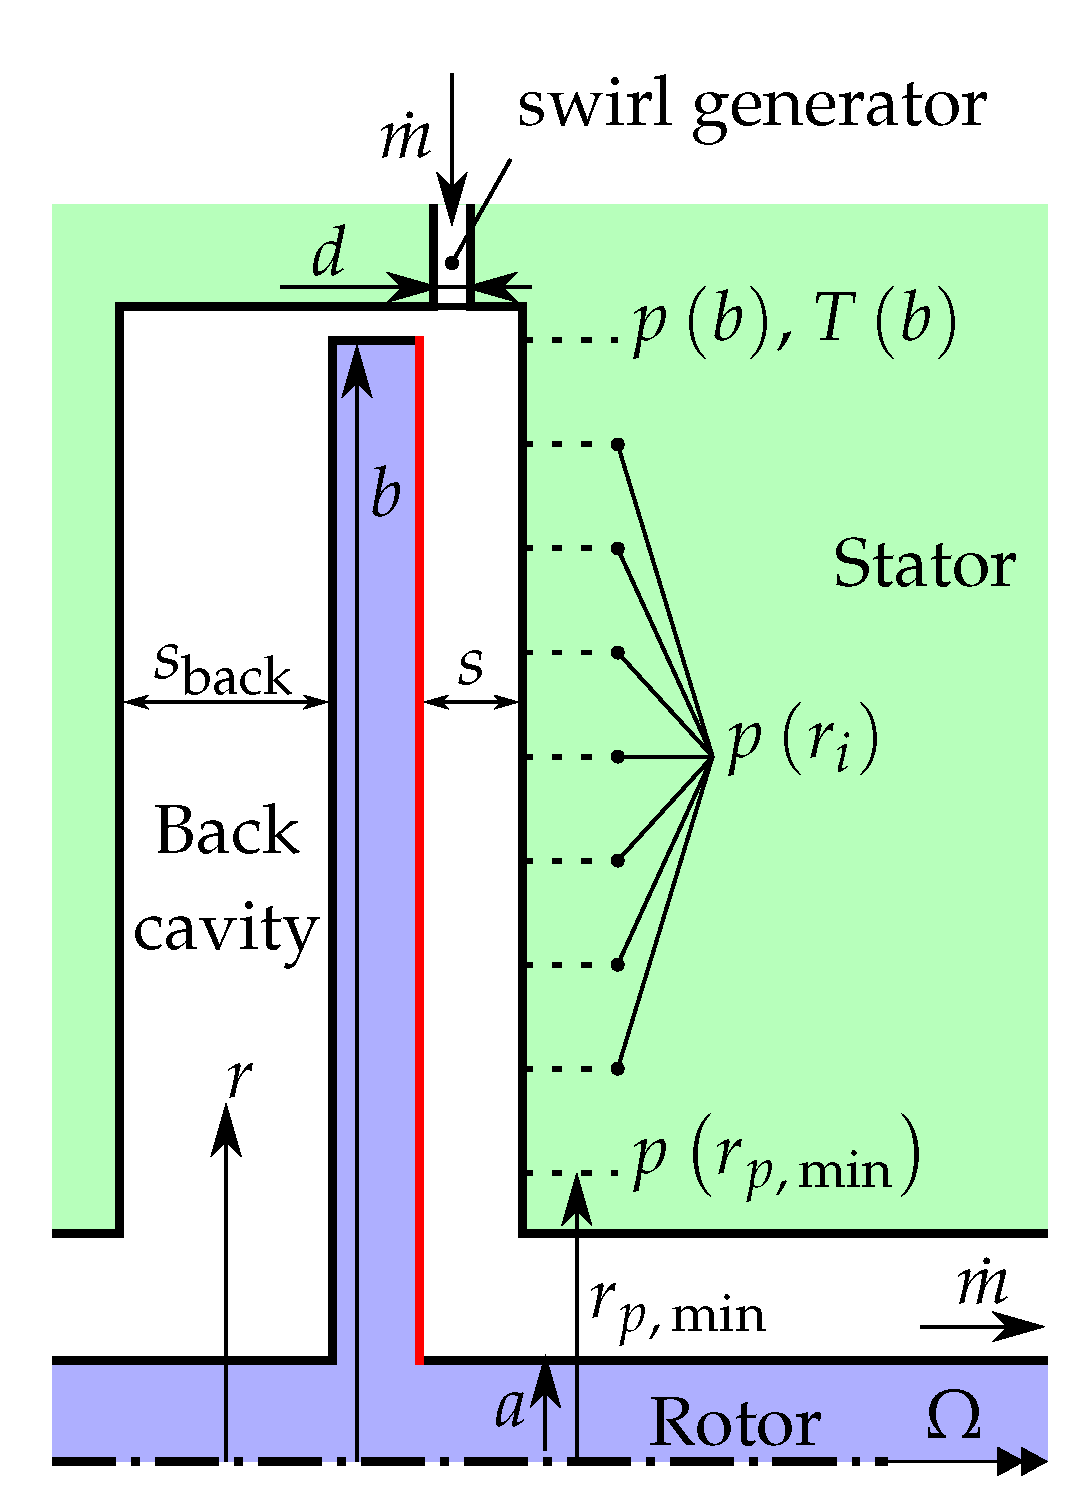
A schematic of the large rotor–stator test rig used in this study is given in
Figure 1. The rotor has angular velocity
, outer radius
b and hub radius
a. Cavity width is given by distance
s. Through-flow with mass flow rate
enters the cavity through a centripetal swirl generator, which has inlet width
d, and exits axially at the hub. Swirl generators are changed to create through-flow with different inlet swirl angles
. In the case of a closed cavity, the swirl generator is replaced by a ring structure, resulting in a cylindrical shroud without any opening. The rig is cooled by water to remove the heat generated by fluid friction.
A detailed drawing of the small test rig can be seen in ([
10], Figure 33), including the sensors used. It is constructed similarly to the large test rig but does not have a hub in its front cavity. Additionally, it does not need to be cooled.
To determine the axial force resulting from the radial pressure distribution in the front cavity of the small test rig, the following measurement technique was used; greater detail is given in [
10]. Tension–compression force transducers and a linear ball bearing are used to measure the axial thrust on the rotor and the shaft. The sum of the axial forces on both parts is given by
where
is the axial force measured by tension–compression force transducers, and
and
are the axial forces due to the pressure
in the back and the pressure
in the front cavity, respectively. The radial pressure distribution in the back and front cavity is characterised by the axial thrust coefficients
and
, respectively, which are defined as
In the case of a closed cavity without through-flow and equal widths of the front and back cavity (
), identical flow structures in the front and back cavity are assumed, which leads to the assumption
. In this test rig configuration, the axial thrust coefficient
of the back cavity is calculated from measurements of the net axial thrust
. The measured coefficient
is transformed into a correlation, which is then used to calculate the axial thrust coefficients
in the front cavity from net axial force
measurements using Equation (
1) in different test rig configurations.
The large test rig has nine taps to measure radial pressure distribution, to which differential pressure transducers are connected to measure the pressure differences
directly (see
Figure 1). In addition, temperature and absolute pressure are measured at the outer radius
b. From these measurements, density
and kinematic viscosity
are calculated. The radial pressure distribution in the small test rig is measured at twelve distinct radial positions; density and kinematic viscosity are assumed to be constant [
10]. The pressure coefficient
is a dimensionless measure of static pressure
relative to that at disc outer radius
b.
The axial thrust coefficient
can be calculated using the pressure coefficient
by
and this procedure is employed for the large test rig. The minimal pressure measurement radius is denoted by
(see
Figure 1). The integral is approximated using the trapezoidal rule, i.e., pressure coefficient
is assumed to vary linearly with the radius
r between two adjacent pressure measurement taps.
The torque coefficient
measures the fluid friction torque
on the front-facing side of the disc, indicated by a red line in
Figure 1. It is calculated as follows for both test rigs (see [
10]): the overall torque
is measured between the motor and the coupling, and includes the friction torque
generated by the bearings and the fluid friction on the shaft. The fluid friction in the back cavity is modelled by a correlation,
, and the friction on the cylindrical outer rotor surface is given by the correlation
. This leads to
where
is a correlation derived from measurements with no disc installed. In the large test rig, this is conducted at different CO
2 pressure levels
p and the shaft rotating at varying angular velocities
. In the small test rig, only the angular velocity
is varied [
10].
The correlation
is found by setting the front and back cavity widths equal,
, with the test rigs in the closed cavity configuration and by assuming
. The overall torque
at varying angular velocities
and pressure levels
p in the large test rig is measured, then
is found from
In [
3], a correlation
is given which predicts the friction on the cylindrical outer rotor surface in rotor–stator cavities. It is assumed that this correlation holds for the friction on this surface in the large test rig, although extrapolation to Reynolds numbers higher than those investigated by Radtke and Ziemann [
3] is required. This correlation is used in the torque coefficient calculation in the large test rig case. The friction on the cylindrical outer rotor surface is neglected in the small test rig [
10].
For the large test rig, the calculation of torque coefficient uncertainties includes measurement uncertainties for the following quantities: overall torque
, breakaway torque, temperature
T, absolute static pressure
p, angular rotor velocity
and manufacturing tolerances. The uncertainty of the correlation
is not known and not included in the calculation, meaning that the torque coefficient uncertainties calculated here provide a lower bound; in reality they may be higher. To calculate these uncertainties, the first-order error propagation method is used as presented in [
12]. Uncertainties of measurements in the small test rig are taken from [
10].
The curve fit and model parameter uncertainty calculations are carried out as presented in [
13]; the method is briefly summarised here. Let
be a column vector of measured values with associated covariances
and
be a column vector of unknown model parameters. The column vector of model equations is given by
. The measured values
will most likely not fulfil the model
for any vector of model parameters
; therefore, the vector
is replaced by a column vector
of free parameters that should fulfil the model equations
while minimising the squared error norm
. This error norm assigns a high weight to measurement results with low uncertainties and vice versa. The problem is solved, using a column vector
of Lagrange multipliers, for the unknown column vector
by finding a Karush–Kuhn–Tucker point
of the Lagrange function
Here,
are components of the matrix
of measurement covariances. The Karush–Kuhn–Tucker conditions for this problem, which are solved for
, read
A solution
to these conditions includes the vector
of optimal model parameters.
The covariances
, including the covariances
of optimal model parameters
, are derived by first order error propagation and are given by
Here,
are the components of the matrix
of covariances of the vector
. The standard uncertainties
are then given by
.
If the uncertainties of the measured values are unknown, the curve fit method reduces to calculating the Karush–Kuhn–Tucker point that minimises the squared error norm . In this case, all measured values are equally weighted.
4. Centripetal Through-Flow
In a radial turbomachine, superposed centripetal through-flow can occur in a side chamber, significantly influencing the coefficients investigated earlier. The mass flow through the cavity is given by the through-flow coefficient
with
for centripetal through-flow. The small and large test rigs can operate at through-flow coefficient ranges of
and
, respectively.
A significant amount of angular momentum can be carried into the rotor–stator cavity if the inflow has a circumferential velocity component; this angular momentum flow is given by the coefficient
where
is the preswirl guide vane angle relative to the radial direction. With a preswirl angle of
, radial inflow occurs and no angular momentum flows into the cavity, resulting in an angular momentum coefficient of
. Corotational swirl corresponds to preswirl angles of
, with the angular momentum coefficient
being positive. The small test rig covers the range of
and the large one
.
It is important to note that computational fluid dynamics simulations along with measurements in the small test rig not presented here show a significant influence of centripetal inlet area on the results: a jet develops at the inlet, with smaller inlet areas generating higher velocity jets for the same mass flow rate. The inlet gap widths d are and times the disc radius b for the large and small test rig, respectively. Results are presented separately.
4.1. Large Test Rig
The large test rig has four different configurations: in addition to the closed cavity, one of three different preswirl guide vanes for centripetal through-flow may be installed. The preswirl angles investigated are 0, 26 and 52.
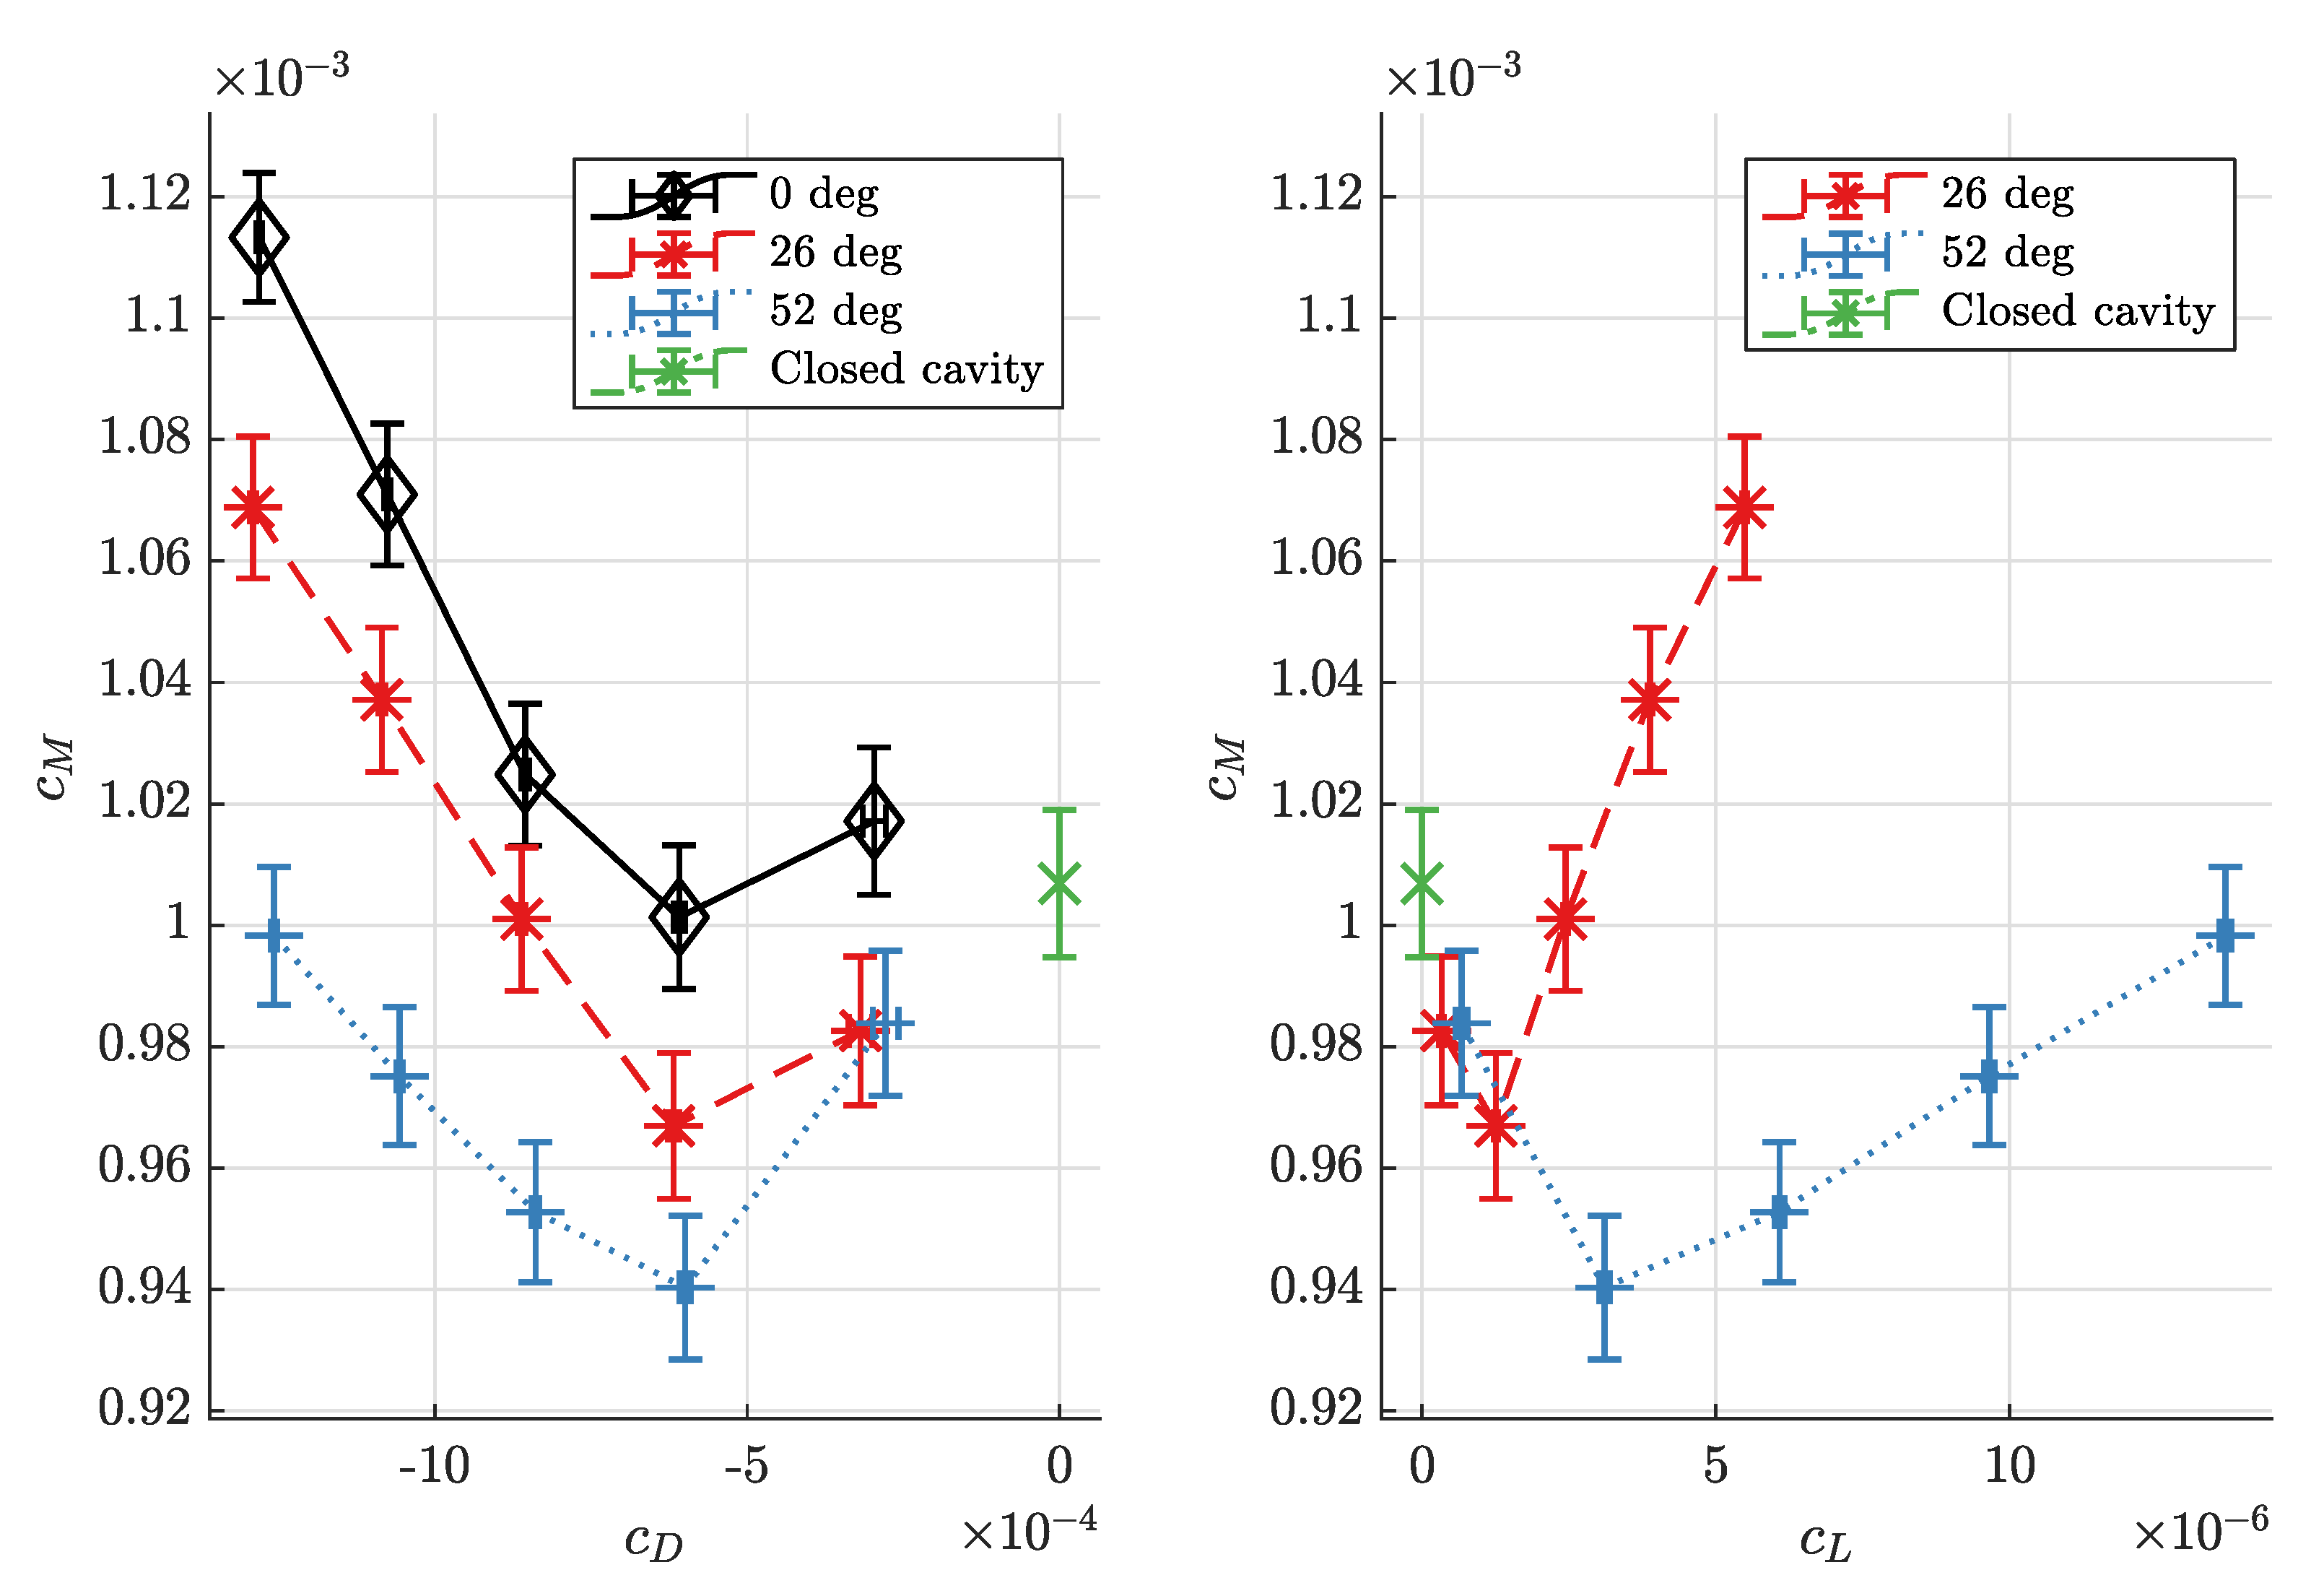
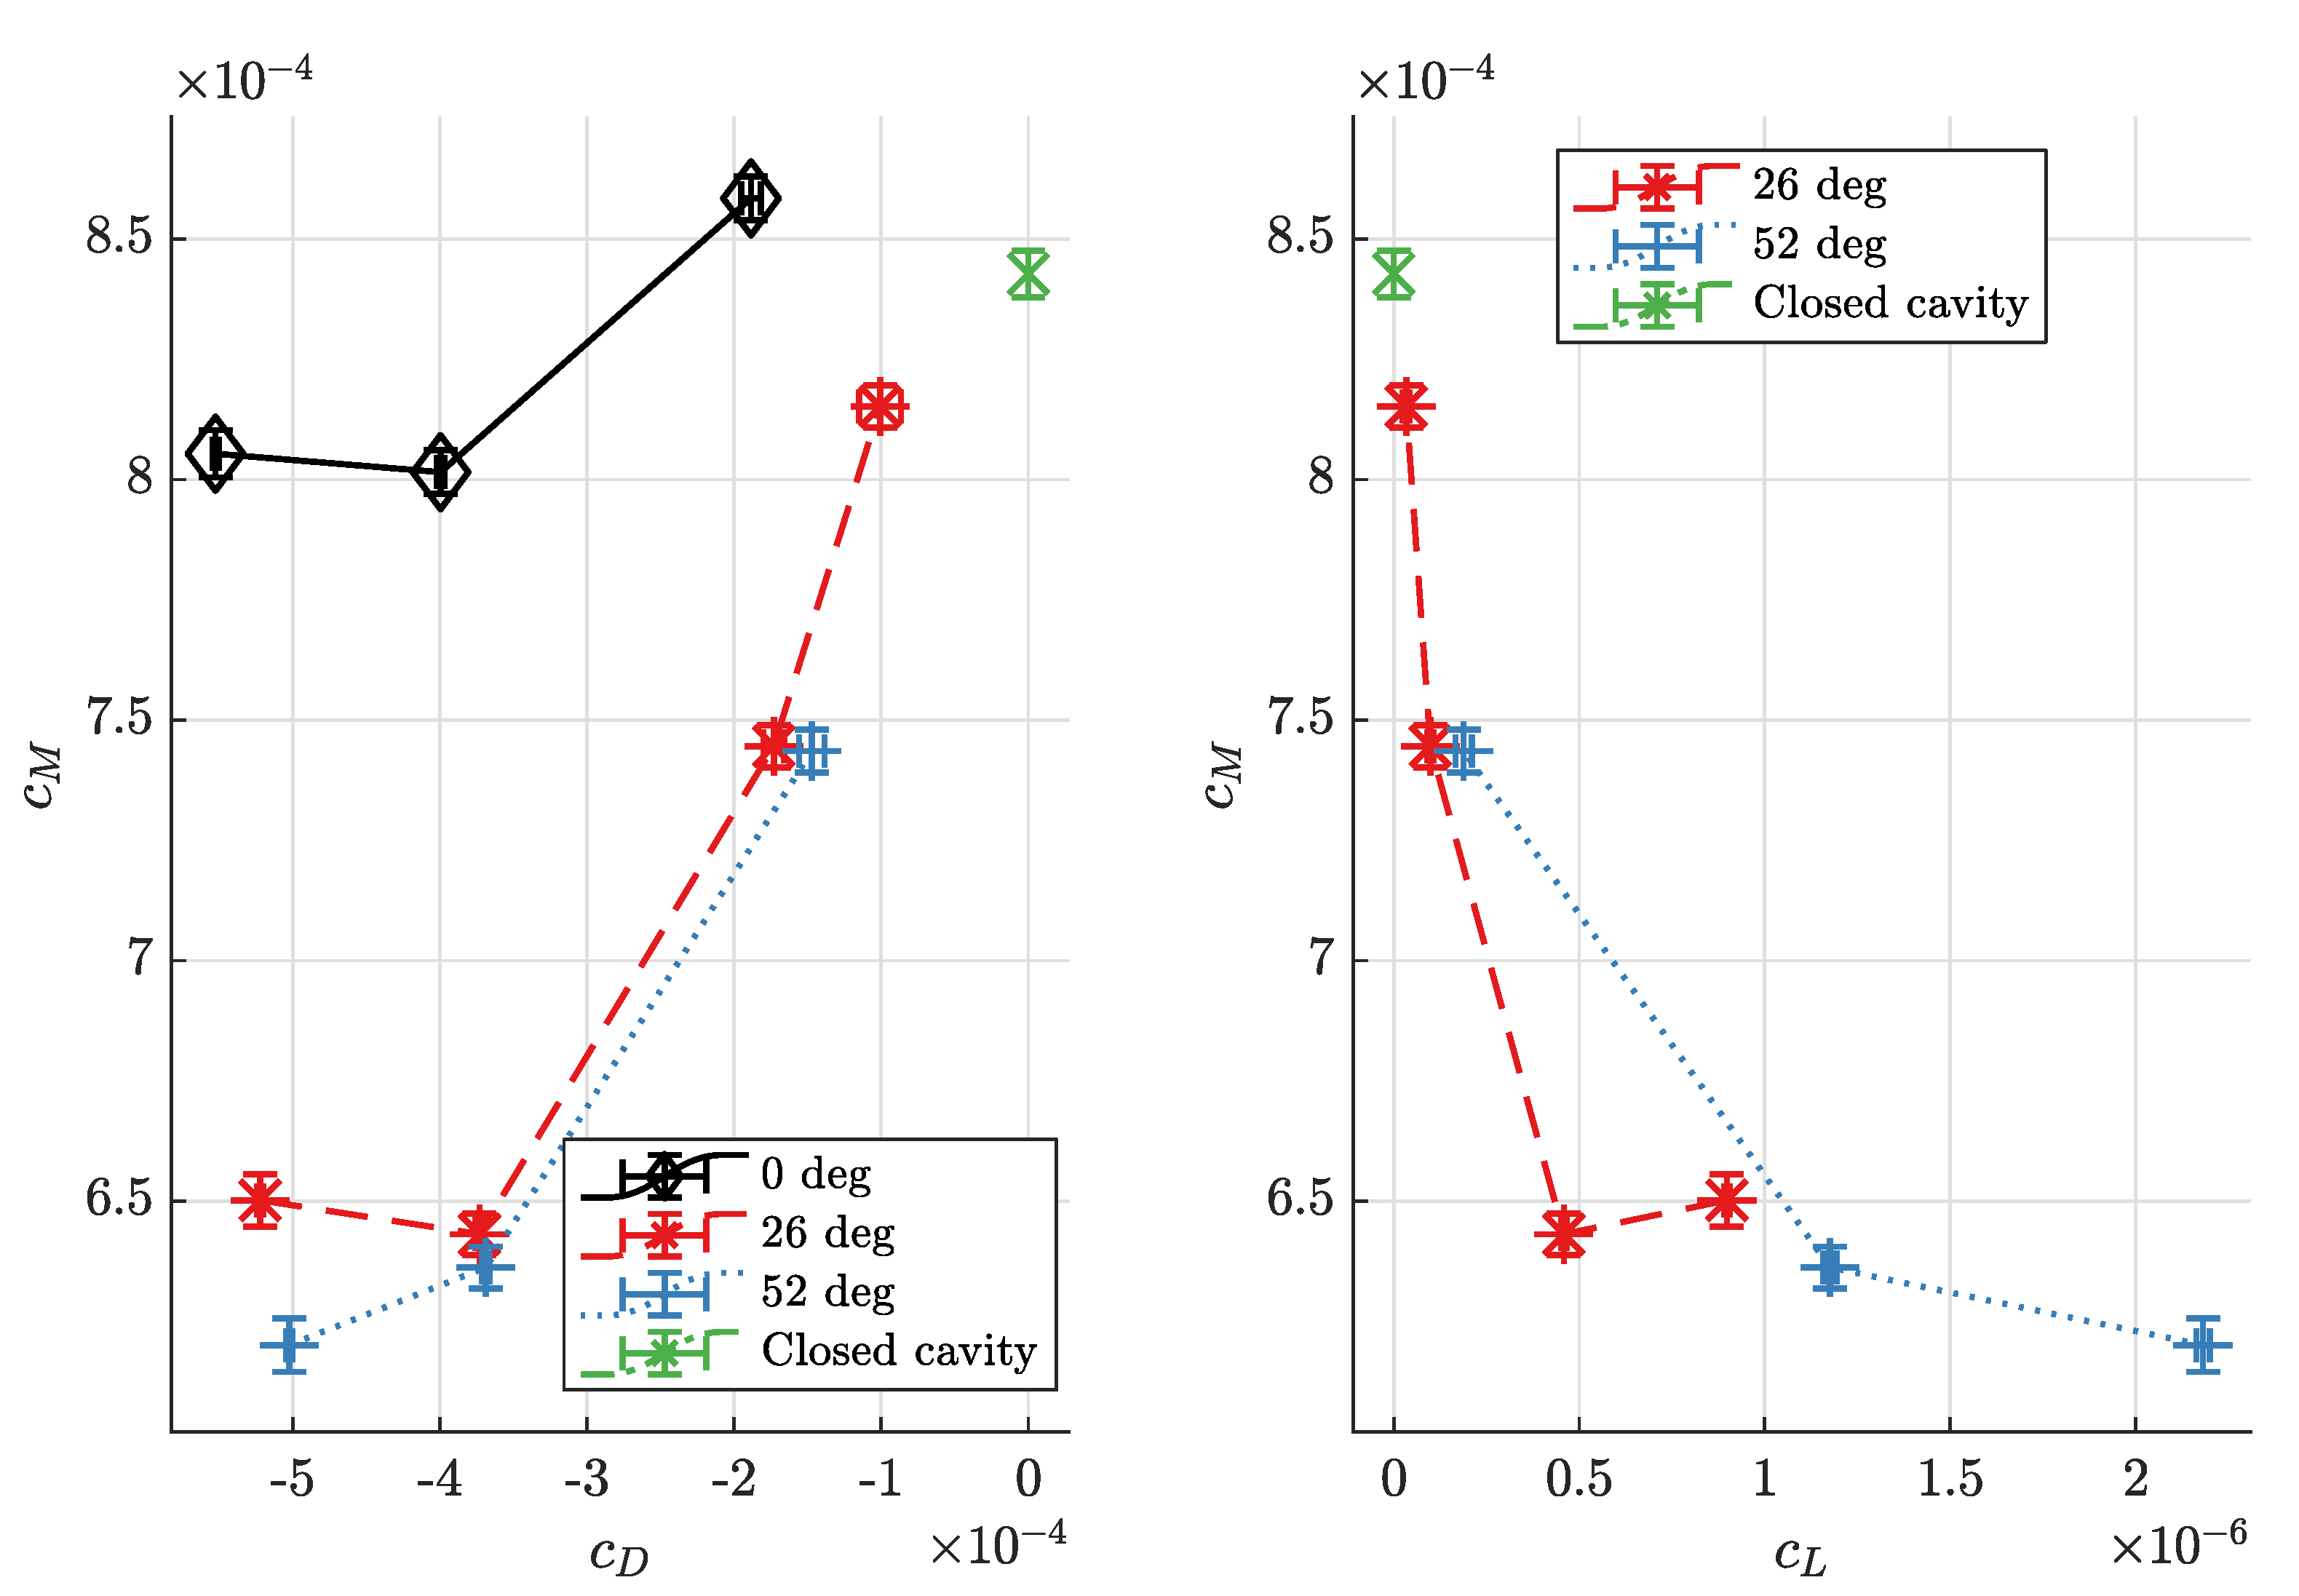
Figure 5 illustrates the torque coefficients
measured with and without centripetal through-flow for a relative gap width of
and in the Reynolds number range of
. It is apparent that with increasing centripetal mass flow (
decreasing below zero), the torque coefficient
first decreases, reaches a minimum and then increases to higher values than that of the closed cavity configuration. The torque coefficient minima are all found at through-flow mass flux coefficients of
, but at different angular momentum flow coefficients
. This indicates that the point where the minima occur depends only on mass flow, and not on inlet swirl angle. However, the torque coefficient values strongly depend on the angular momentum flow into the cavity, with high preswirl angles leading to lower torque coefficients at the same mass flux coefficients.
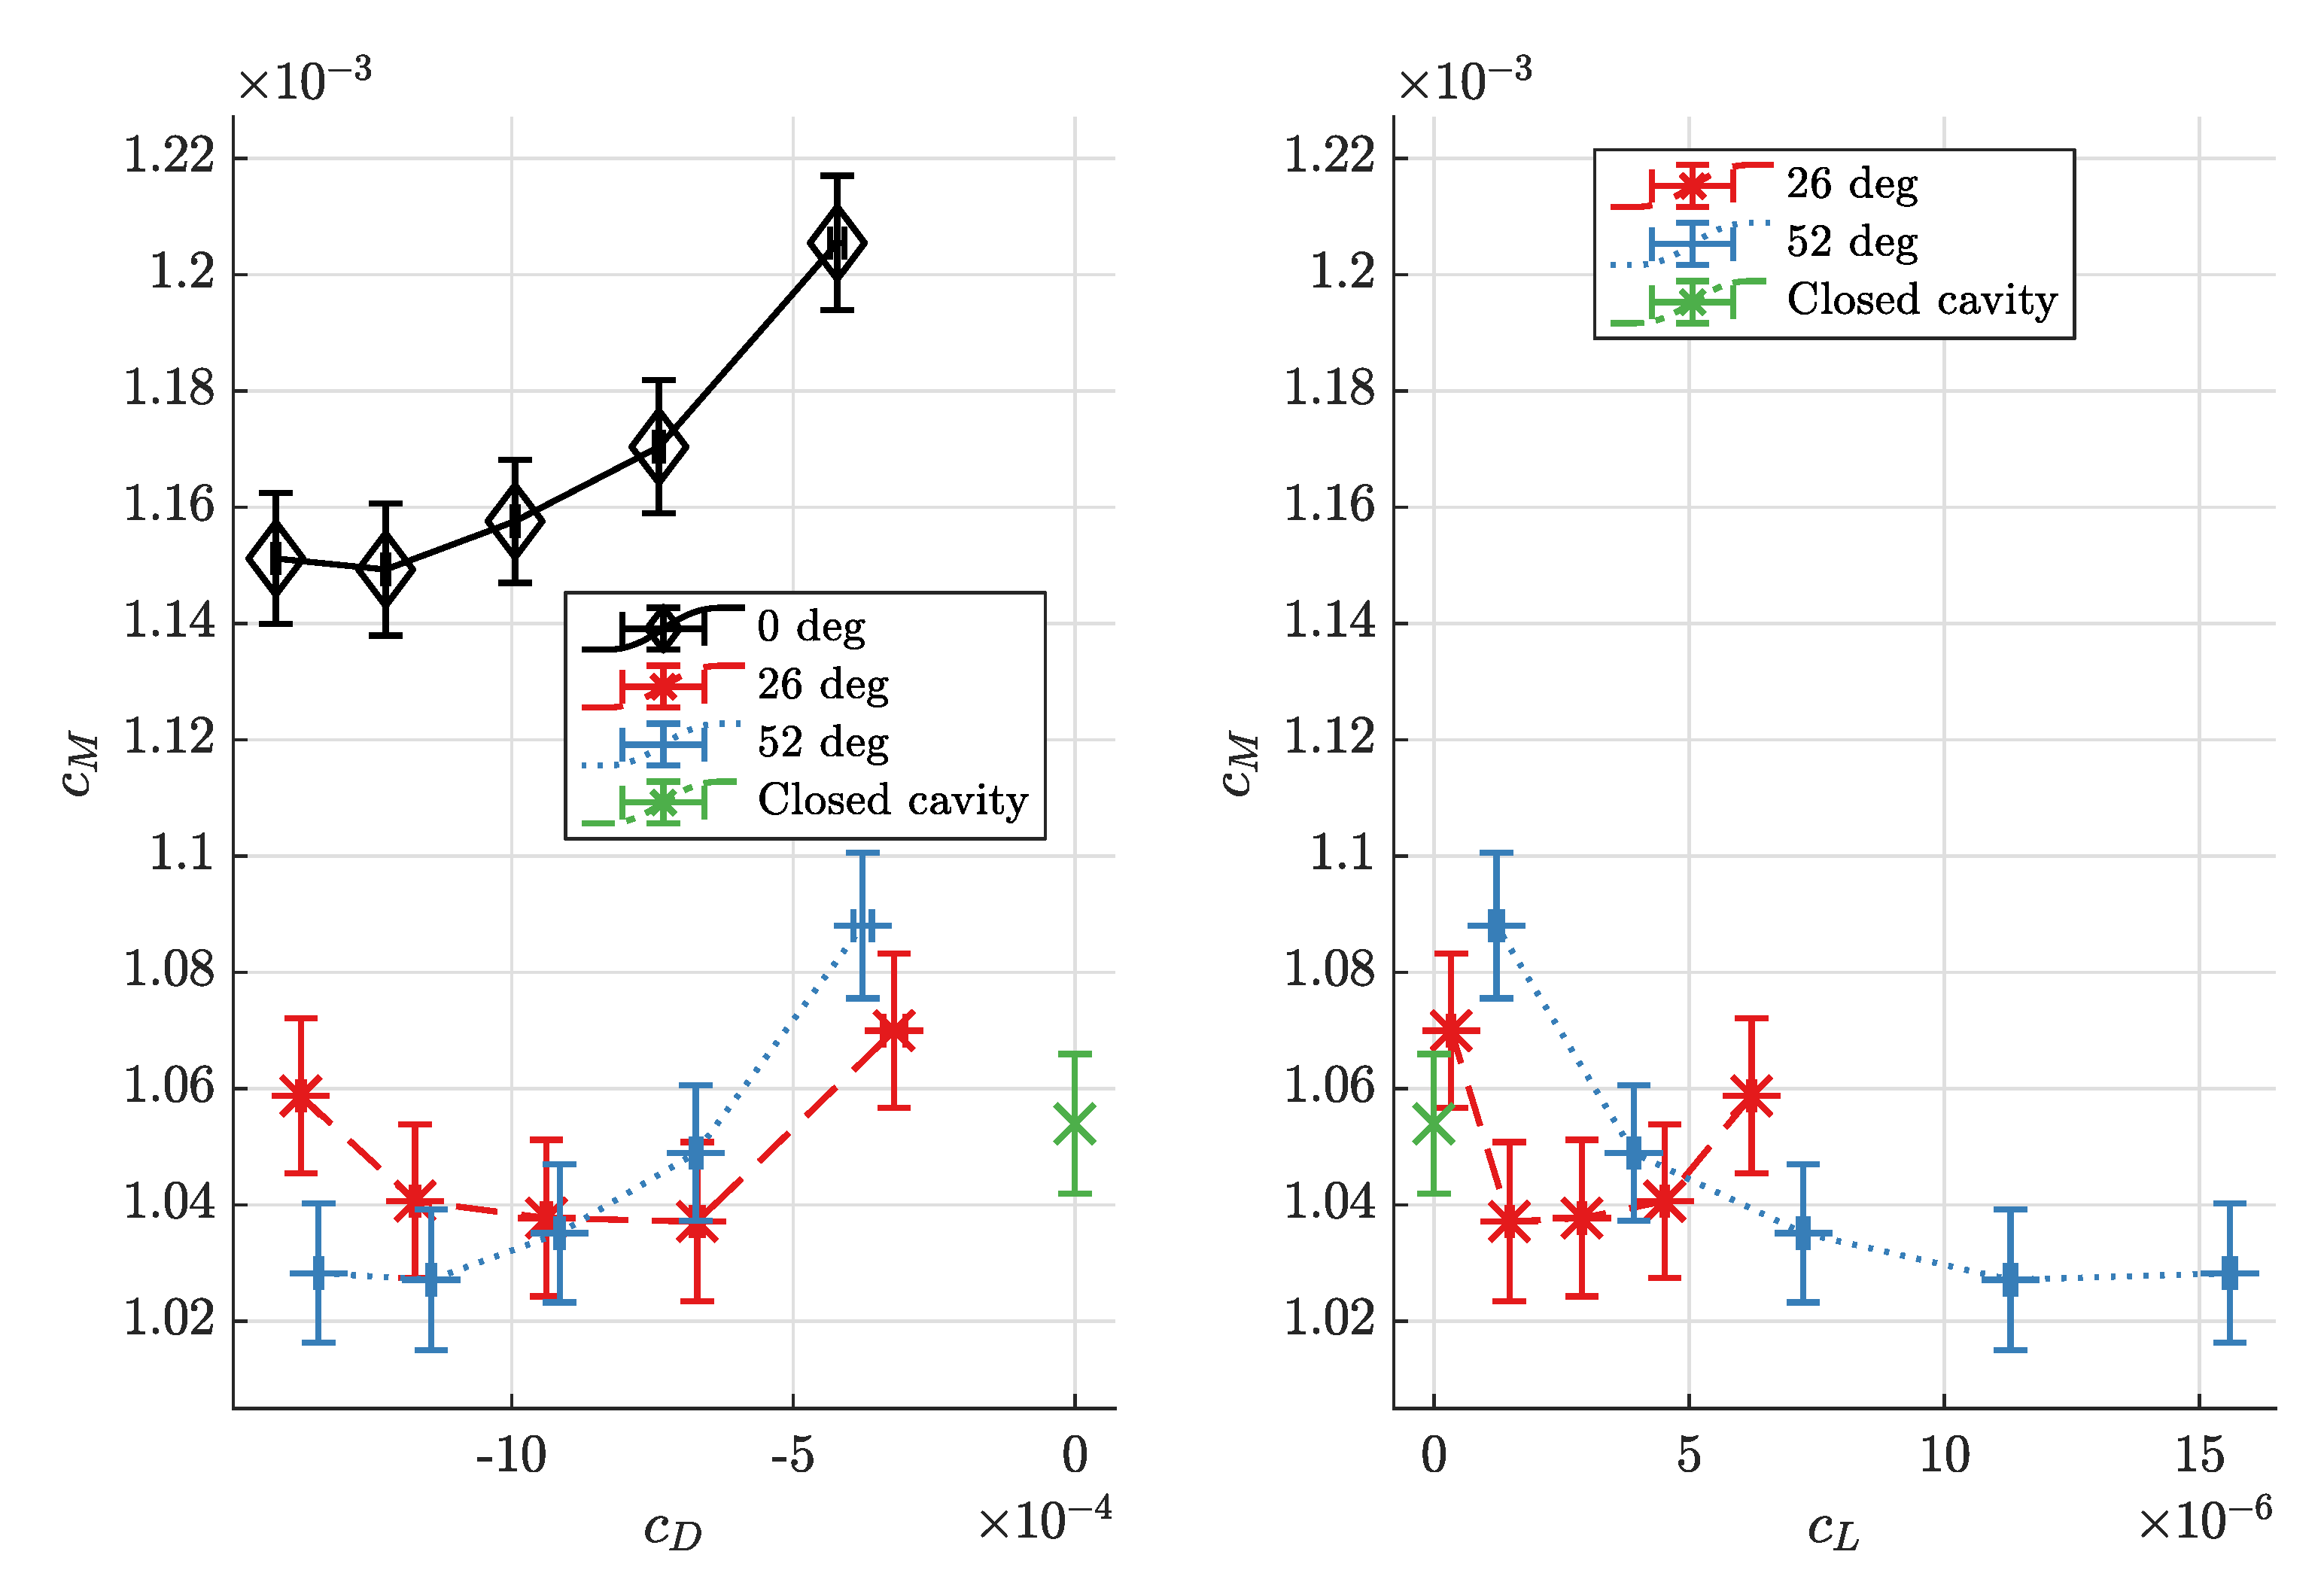
For large Reynolds numbers of
shown in
Figure 6, the decline of torque coefficients from radial inflow to a preswirl angle of 26
is much larger than for the moderate Reynolds numbers in
Figure 5, but the torque coefficients at preswirl angles 26
and 52
differ significantly only at high through-flow mass flux (small through-flow coefficient values
). Minimum torque coefficients are found at
for radial inflow and the 26
preswirl angle, but at
for the 52
preswirl angle. For this gap width and Reynolds number range, the angular momentum flux entering the cavity plays an important role: for radial inflow, where by definition
, the minimum torque coefficient is
, but with increasing angular momentum inflow in the case of corotating preswirl, the torque coefficient quickly drops to values below
.
With a relative cavity width of
and a Reynolds number of
, the torque coefficient behaves as shown in
Figure 7. The only difference in experimental set-up from that of
Figure 5 is that the cavity width is three times larger. Again, torque coefficients are significantly higher with radial inflow (
, no preswirl) than with preswirl, but while a difference between preswirl angles of 26
and 52
is observed at the smaller cavity width, no significant difference is observed here. For this larger cavity width, the minima of the torque coefficient seem to be shifted to smaller through-flow mass flux coefficients compared to the small cavity width, but this conclusion is not certain since the uncertainties of the measured torque coefficient are about as large as the change in the torque coefficients itself.
The explanation for greater torque coefficients in the case of radial inflow, which has been observed, is as follows. If through-flow enters the cavity radially, i.e., with a preswirl angle of , it creates a large gradient in the axial direction between the circumferential velocities of the fluid and disc close to its outer radius. This gives rise to a large drag, resulting in torque coefficients significantly higher than in the closed cavity or the centripetal through-flow case with corotating preswirl. The difference in circumferential velocity between the inflow and the disc is smaller with corotating preswirl, therefore the velocity gradient, drag and torque coefficient decrease.
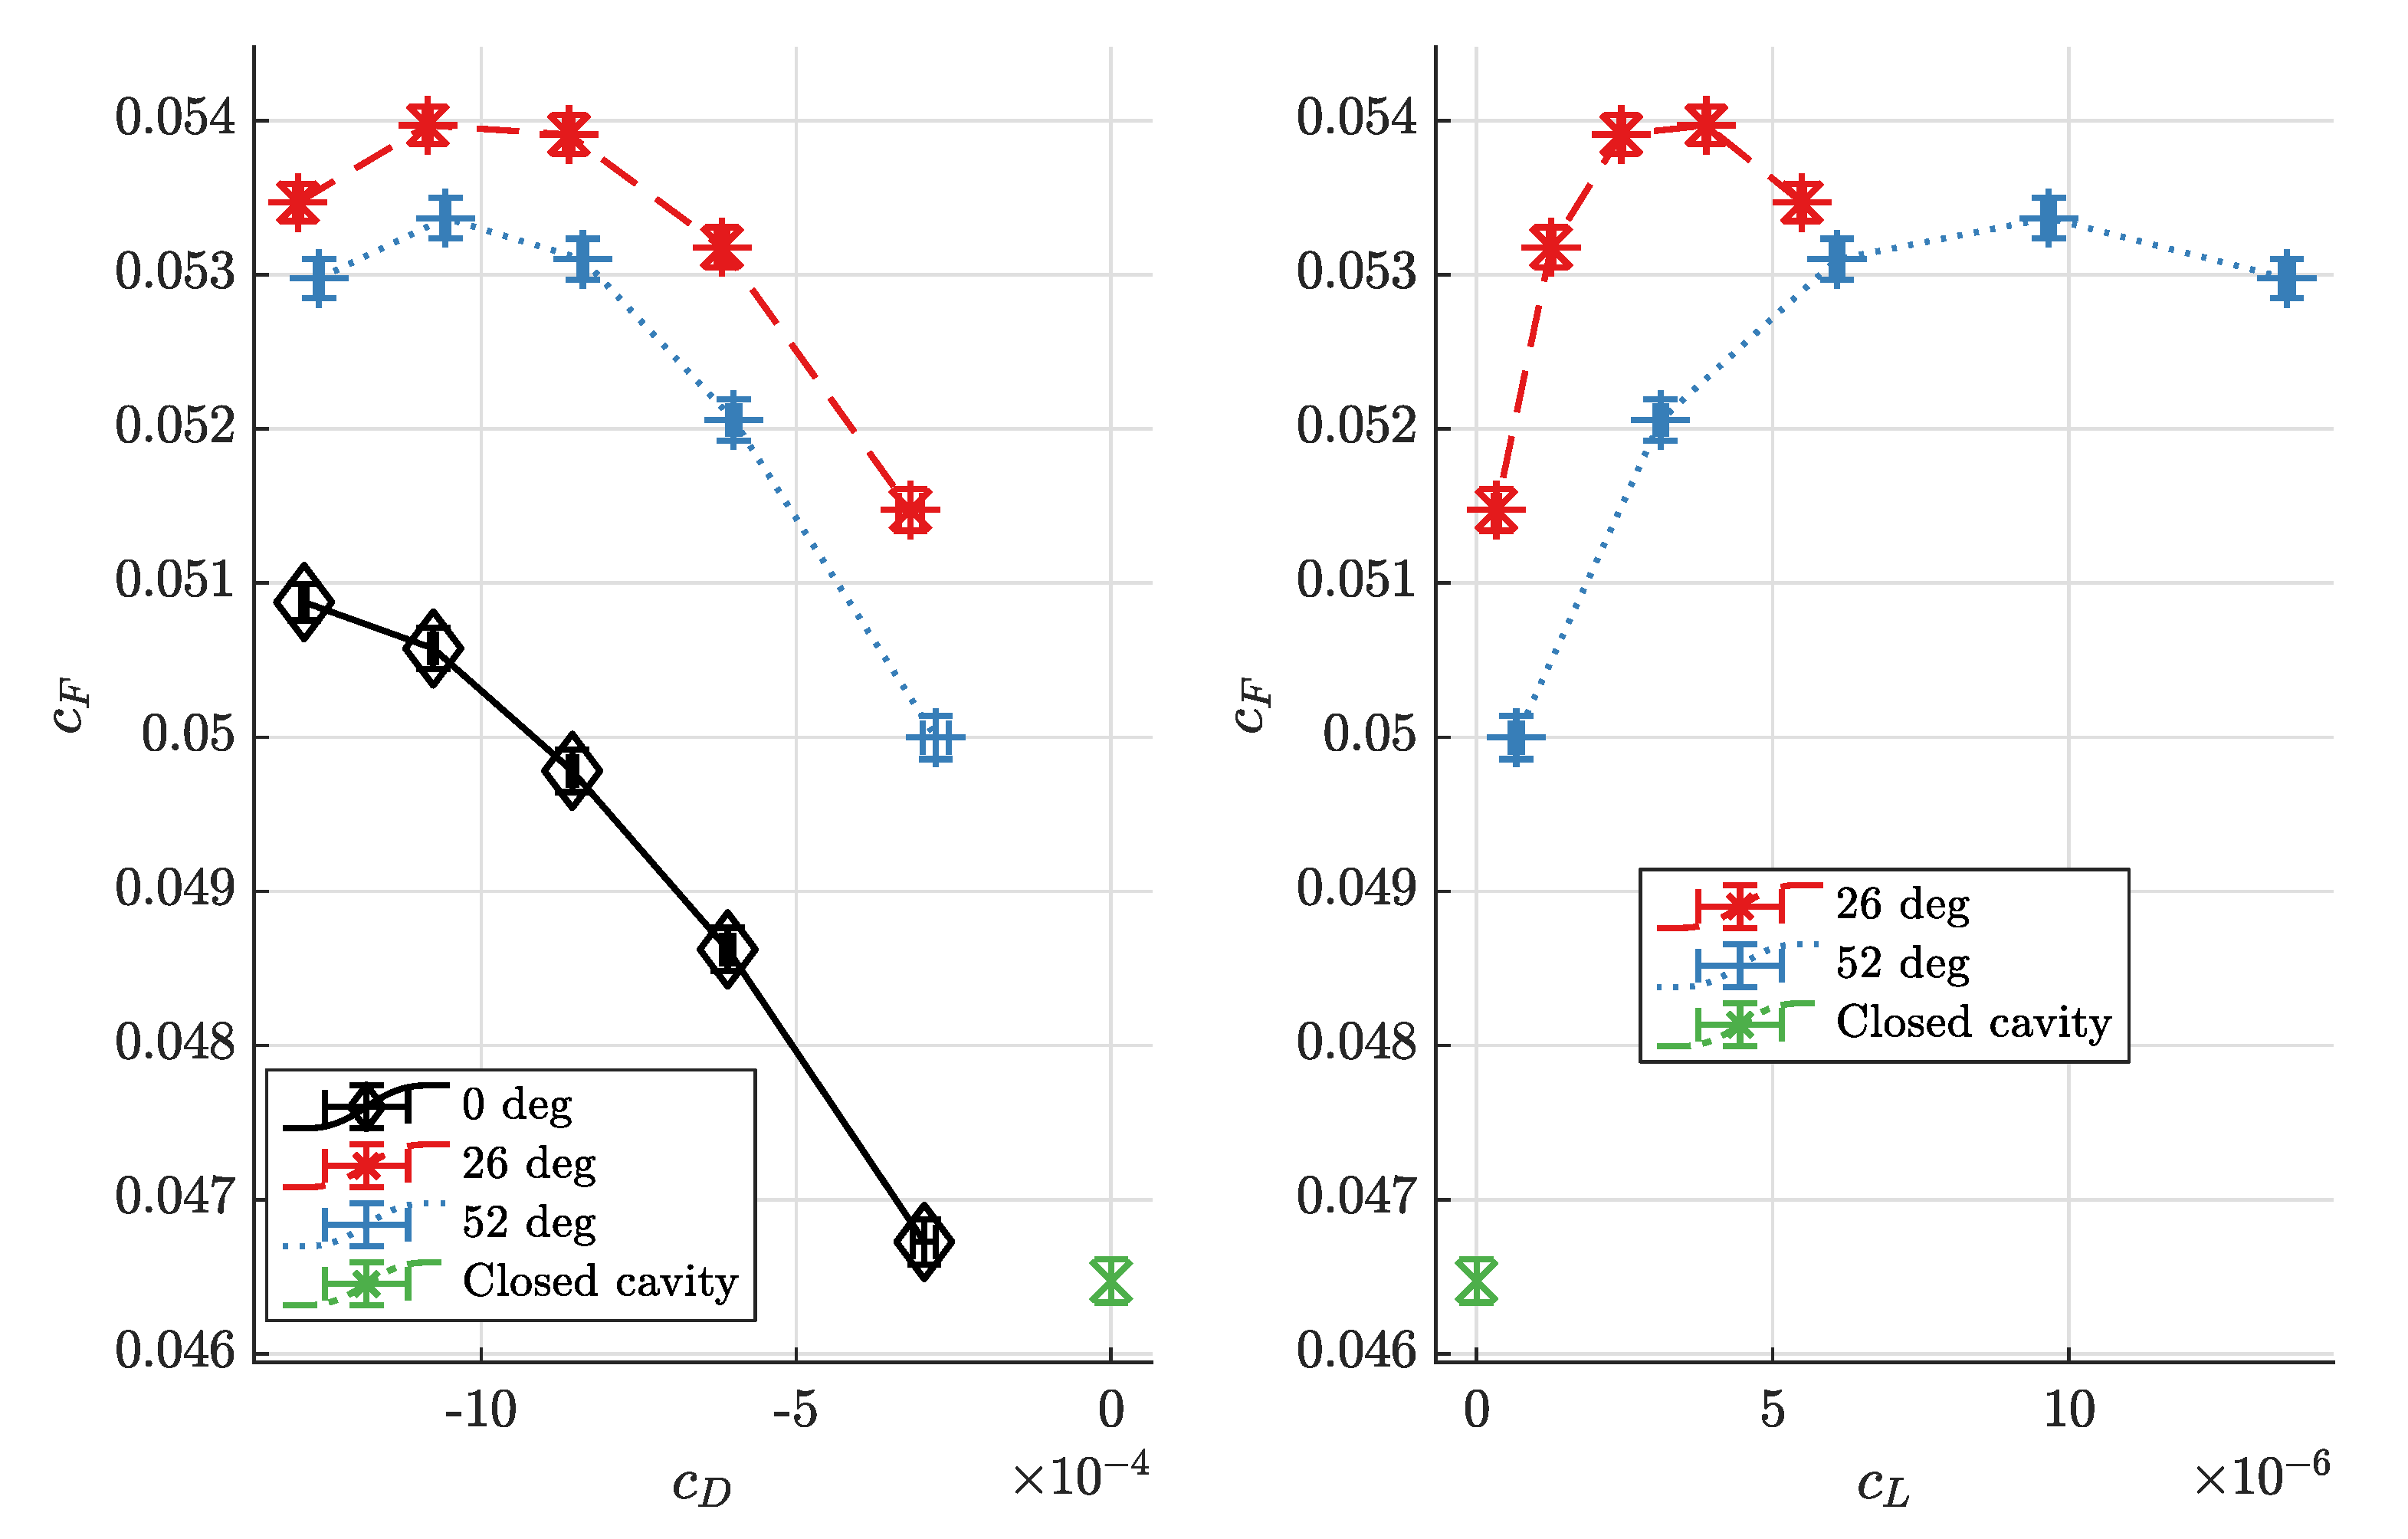
The development of axial thrust coefficients with centripetal through-flow is shown in
Figure 8 for the same measurements that are shown in
Figure 5 (
,
): centripetal through-flow significantly increases the thrust coefficient as essentially it is an accelerated flow which results in a larger radial pressure gradient. With increasing centripetal mass flow (decreasing
), the axial thrust coefficient reaches a maximum for preswirl angles of 26
and 52
at a through-flow coefficient of
. For radial inflow, it seems that the thrust coefficient converges towards a maximum, too, which is outside of the investigated through-flow mass flux range. For this gap width and Reynolds number, centripetal through-flow with preswirl angles of 26
and 52
generates higher axial thrust coefficients compared to radial inflow with a preswirl angle of 0
. The small differences in the axial thrust coefficients between measurements with preswirl angles of 26
and 52
are not considered significant, because the experiment at the preswirl angle of 52
was conducted at a slightly higher Reynolds number than those for 26
. The angular momentum coefficient
alone is again insufficient to describe the axial thrust behaviour because multiple different axial thrust coefficient values are observed for one angular momentum coefficient value.
To investigate the influence on axial thrust of mass and angular momentum flow into the cavity, the radial pressure distribution of the closed cavity configuration and the centripetal through-flow case with 52
preswirl angle is plotted in
Figure 9. To provide a better view of the pressure gradients, markers and error bars are omitted. With increasing centripetal through-flow, the pressure at relative radii of
decreases as indicated by larger pressure coefficient values
. Simultaneously, the pressure at relative radii of
increases, leading to lower pressure coefficients compared to the closed cavity configuration. Since in the computation of axial thrust coefficients the pressure coefficients are weighted with the radial position
r, a small pressure increase at large radii can balance larger pressure drops at small radii. This happens at the maxima of axial thrust coefficients as at this point a change in the radial pressure distribution does not cause a change in
.
4.2. Small Test Rig
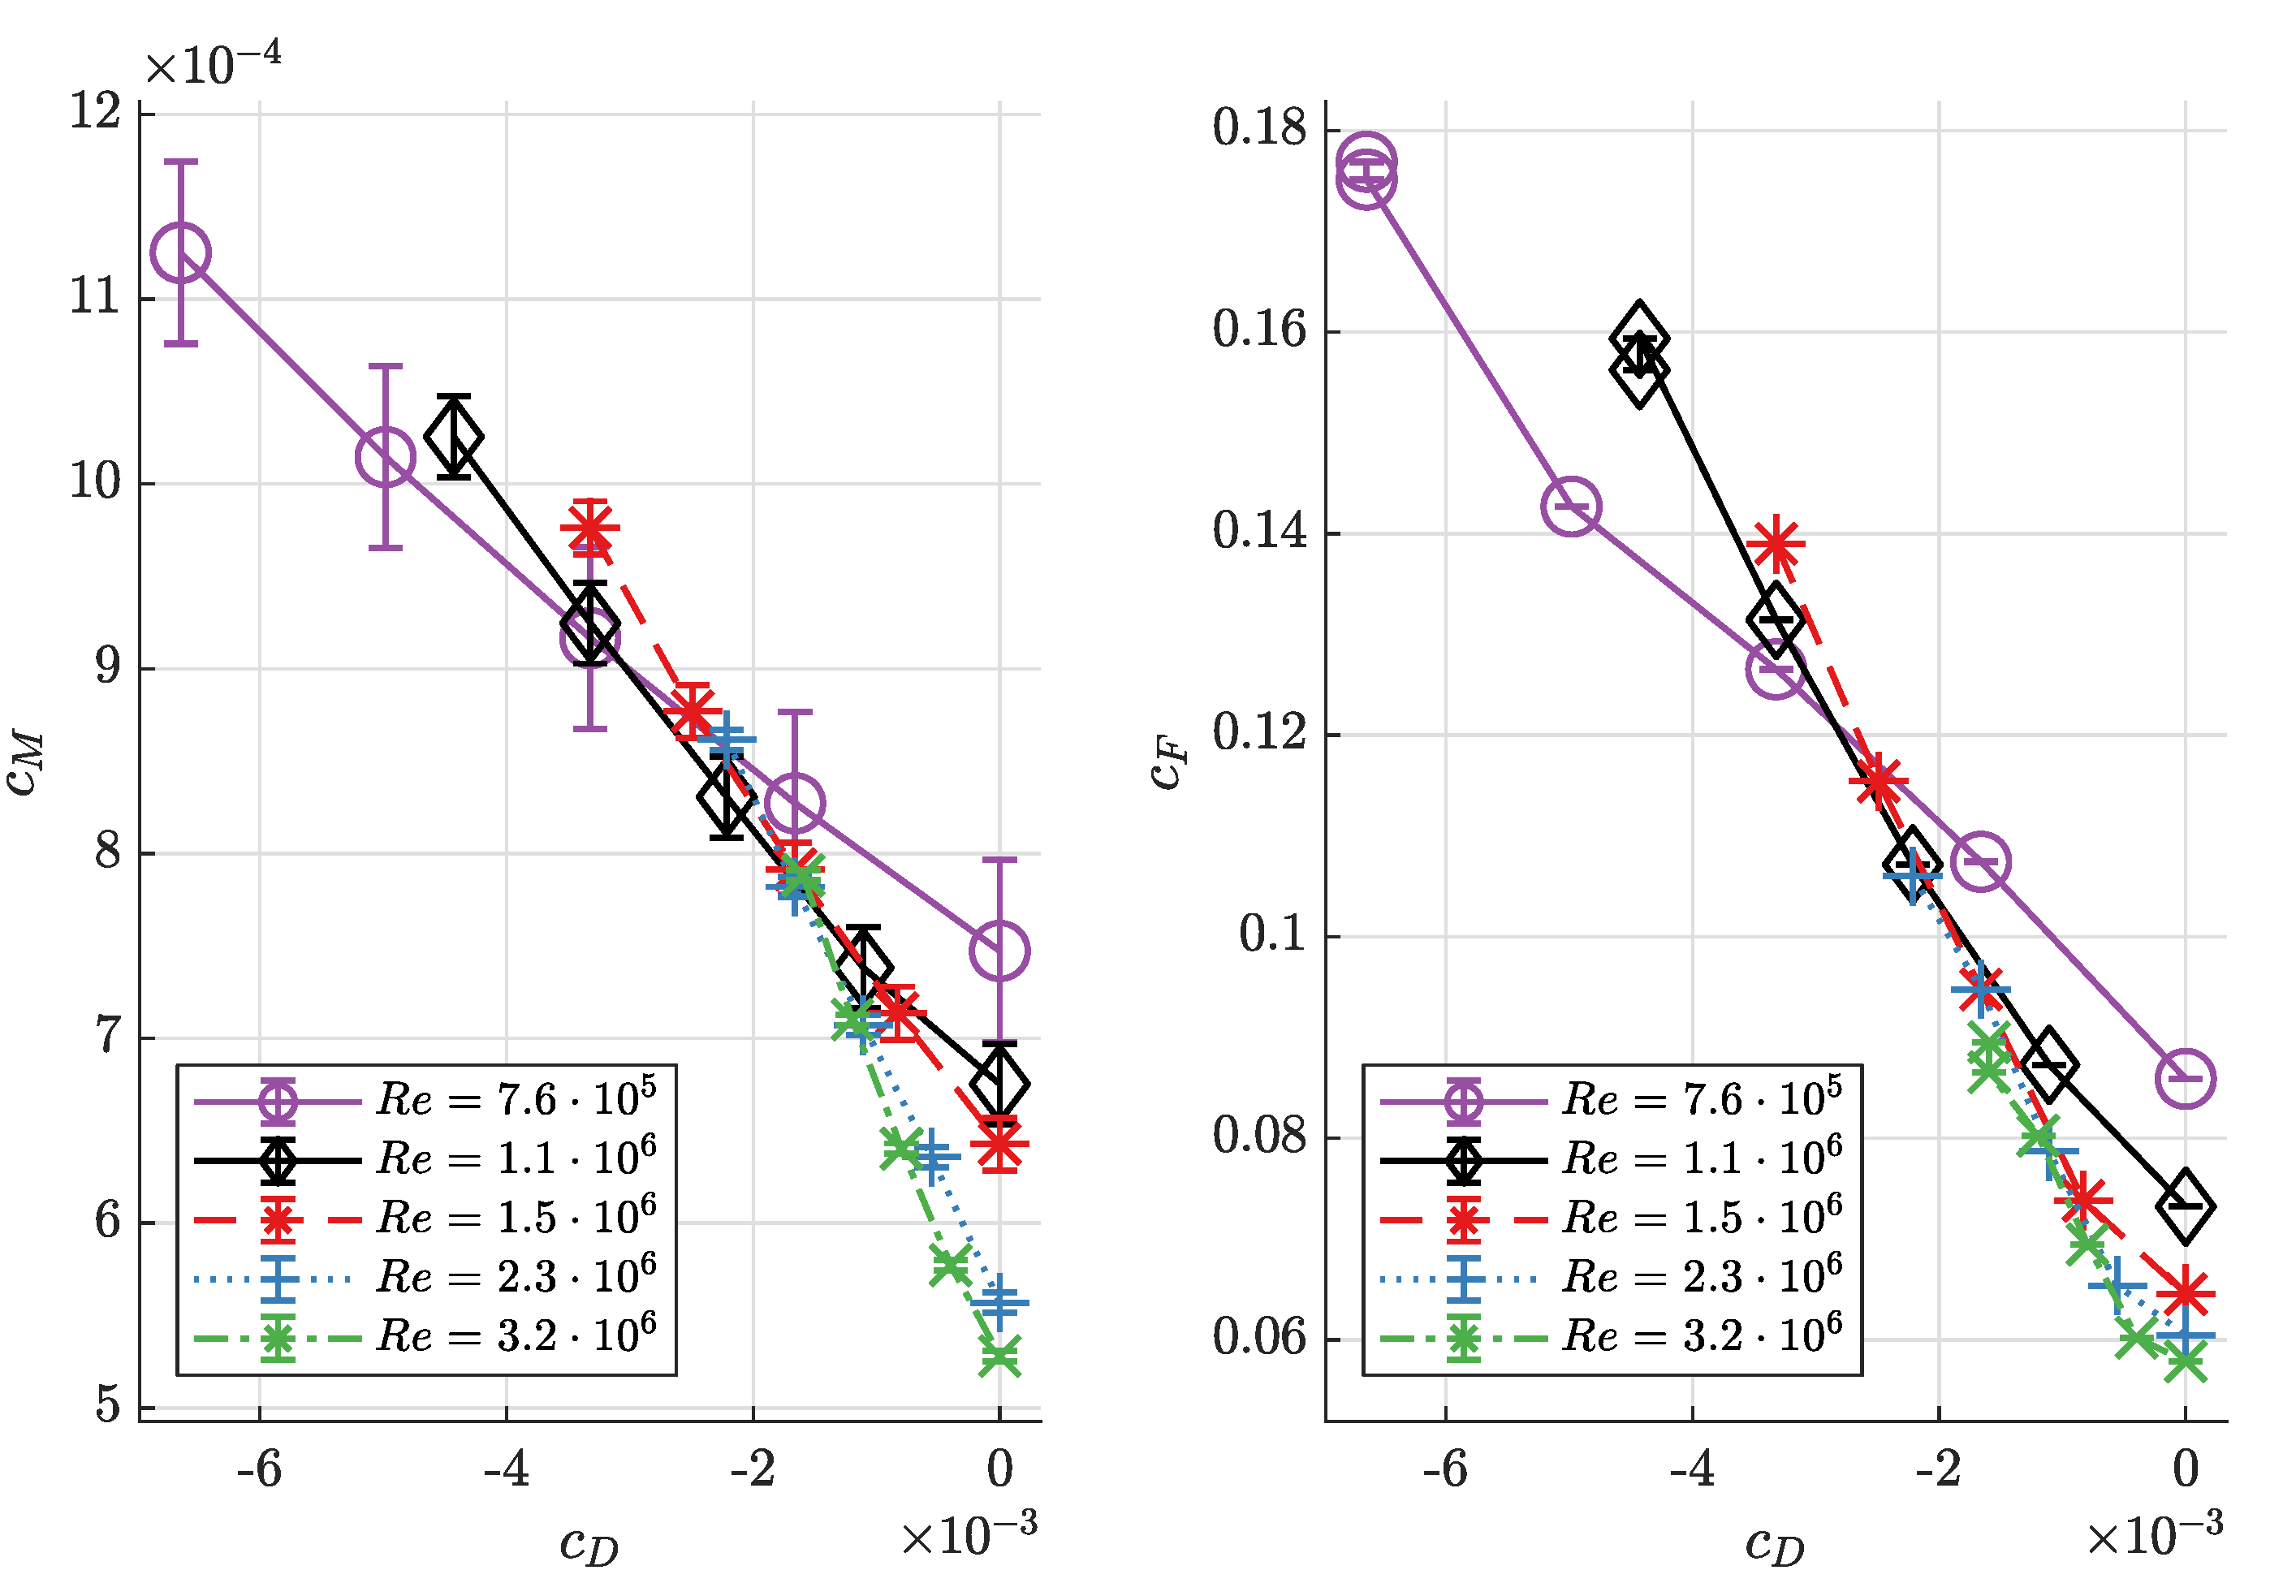
In
Figure 10, axial thrust coefficients
and torque coefficients
measured in the small test rig with the cavity closed are compared to those obtained with radial inflow for the small relative cavity width of
. The result shows an almost linear increase of thrust and torque coefficient with decreasing through-flow coefficient
, with the slope depending on the circumferential Reynolds number: as Reynolds number increases, the slopes
and
decrease.
In comparison to the results of the large test rig, it appears that the torque coefficient minima, observed in the large test rig for moderate through-flow mass flow rates and radial inflow, do not appear. The axial thrust coefficients of the large test rig with radial inflow, plotted in
Figure 8, increase with decreasing through-flow coefficients, just as in the small test rig. However, in the large test rig, this increase decelerates with decreasing through-flow coefficients, while, in the small test rig, no deceleration is observable.
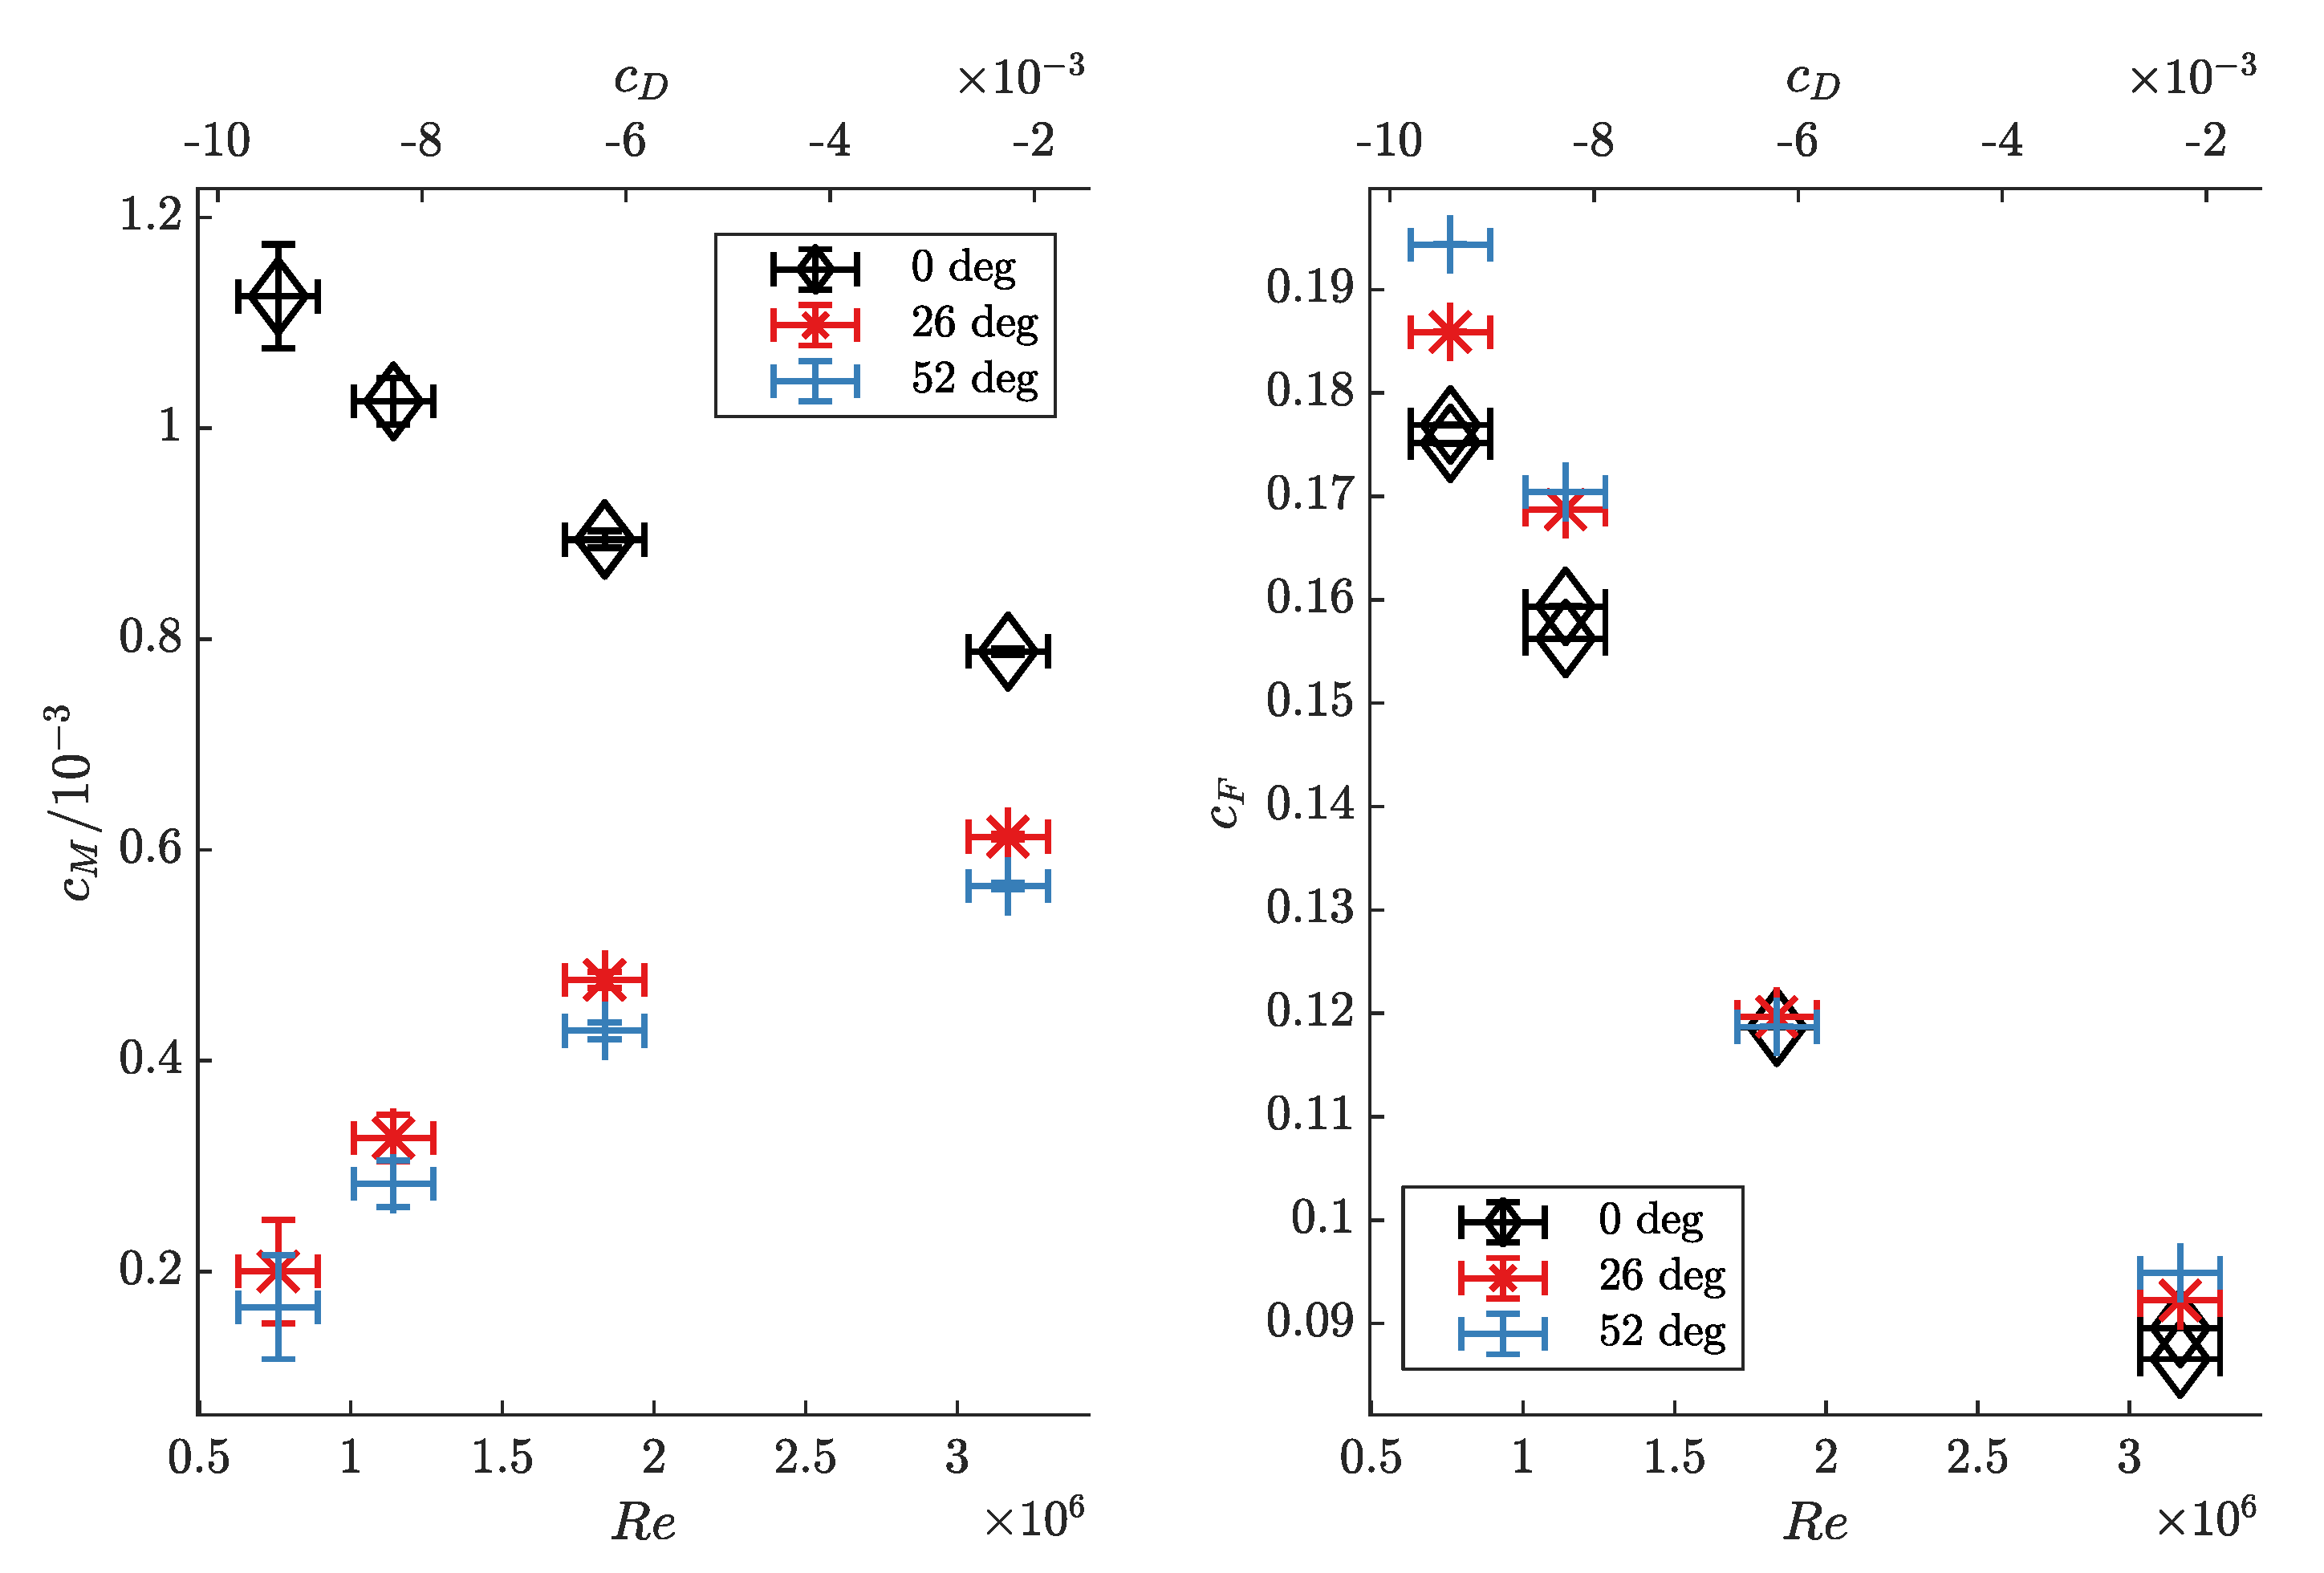
In
Figure 11, the influence of preswirl angle on torque and axial thrust coefficient for the small test rig is presented. It is important to note that, in this figure, the Reynolds number of the data points is found on the lower horizontal axes while the through-flow coefficient is found on the upper ones. The torque coefficient behaviour with varying preswirl angles is similar to that observed in the large test rig: when the preswirl angle increases from 0
(radial inflow) to 26
, the torque coefficient drops sharply, while a further increase of the preswirl angle to 52
only leads to a marginal decrease of the torque coefficient compared to the results with a preswirl angle of 26
. Regarding the thrust coefficient, it is found that an increase of the preswirl angle increases the thrust coefficient, as in the large test rig. Interestingly, this increase is very small at the operating point
,
, but larger at all other points.
5. Conclusions
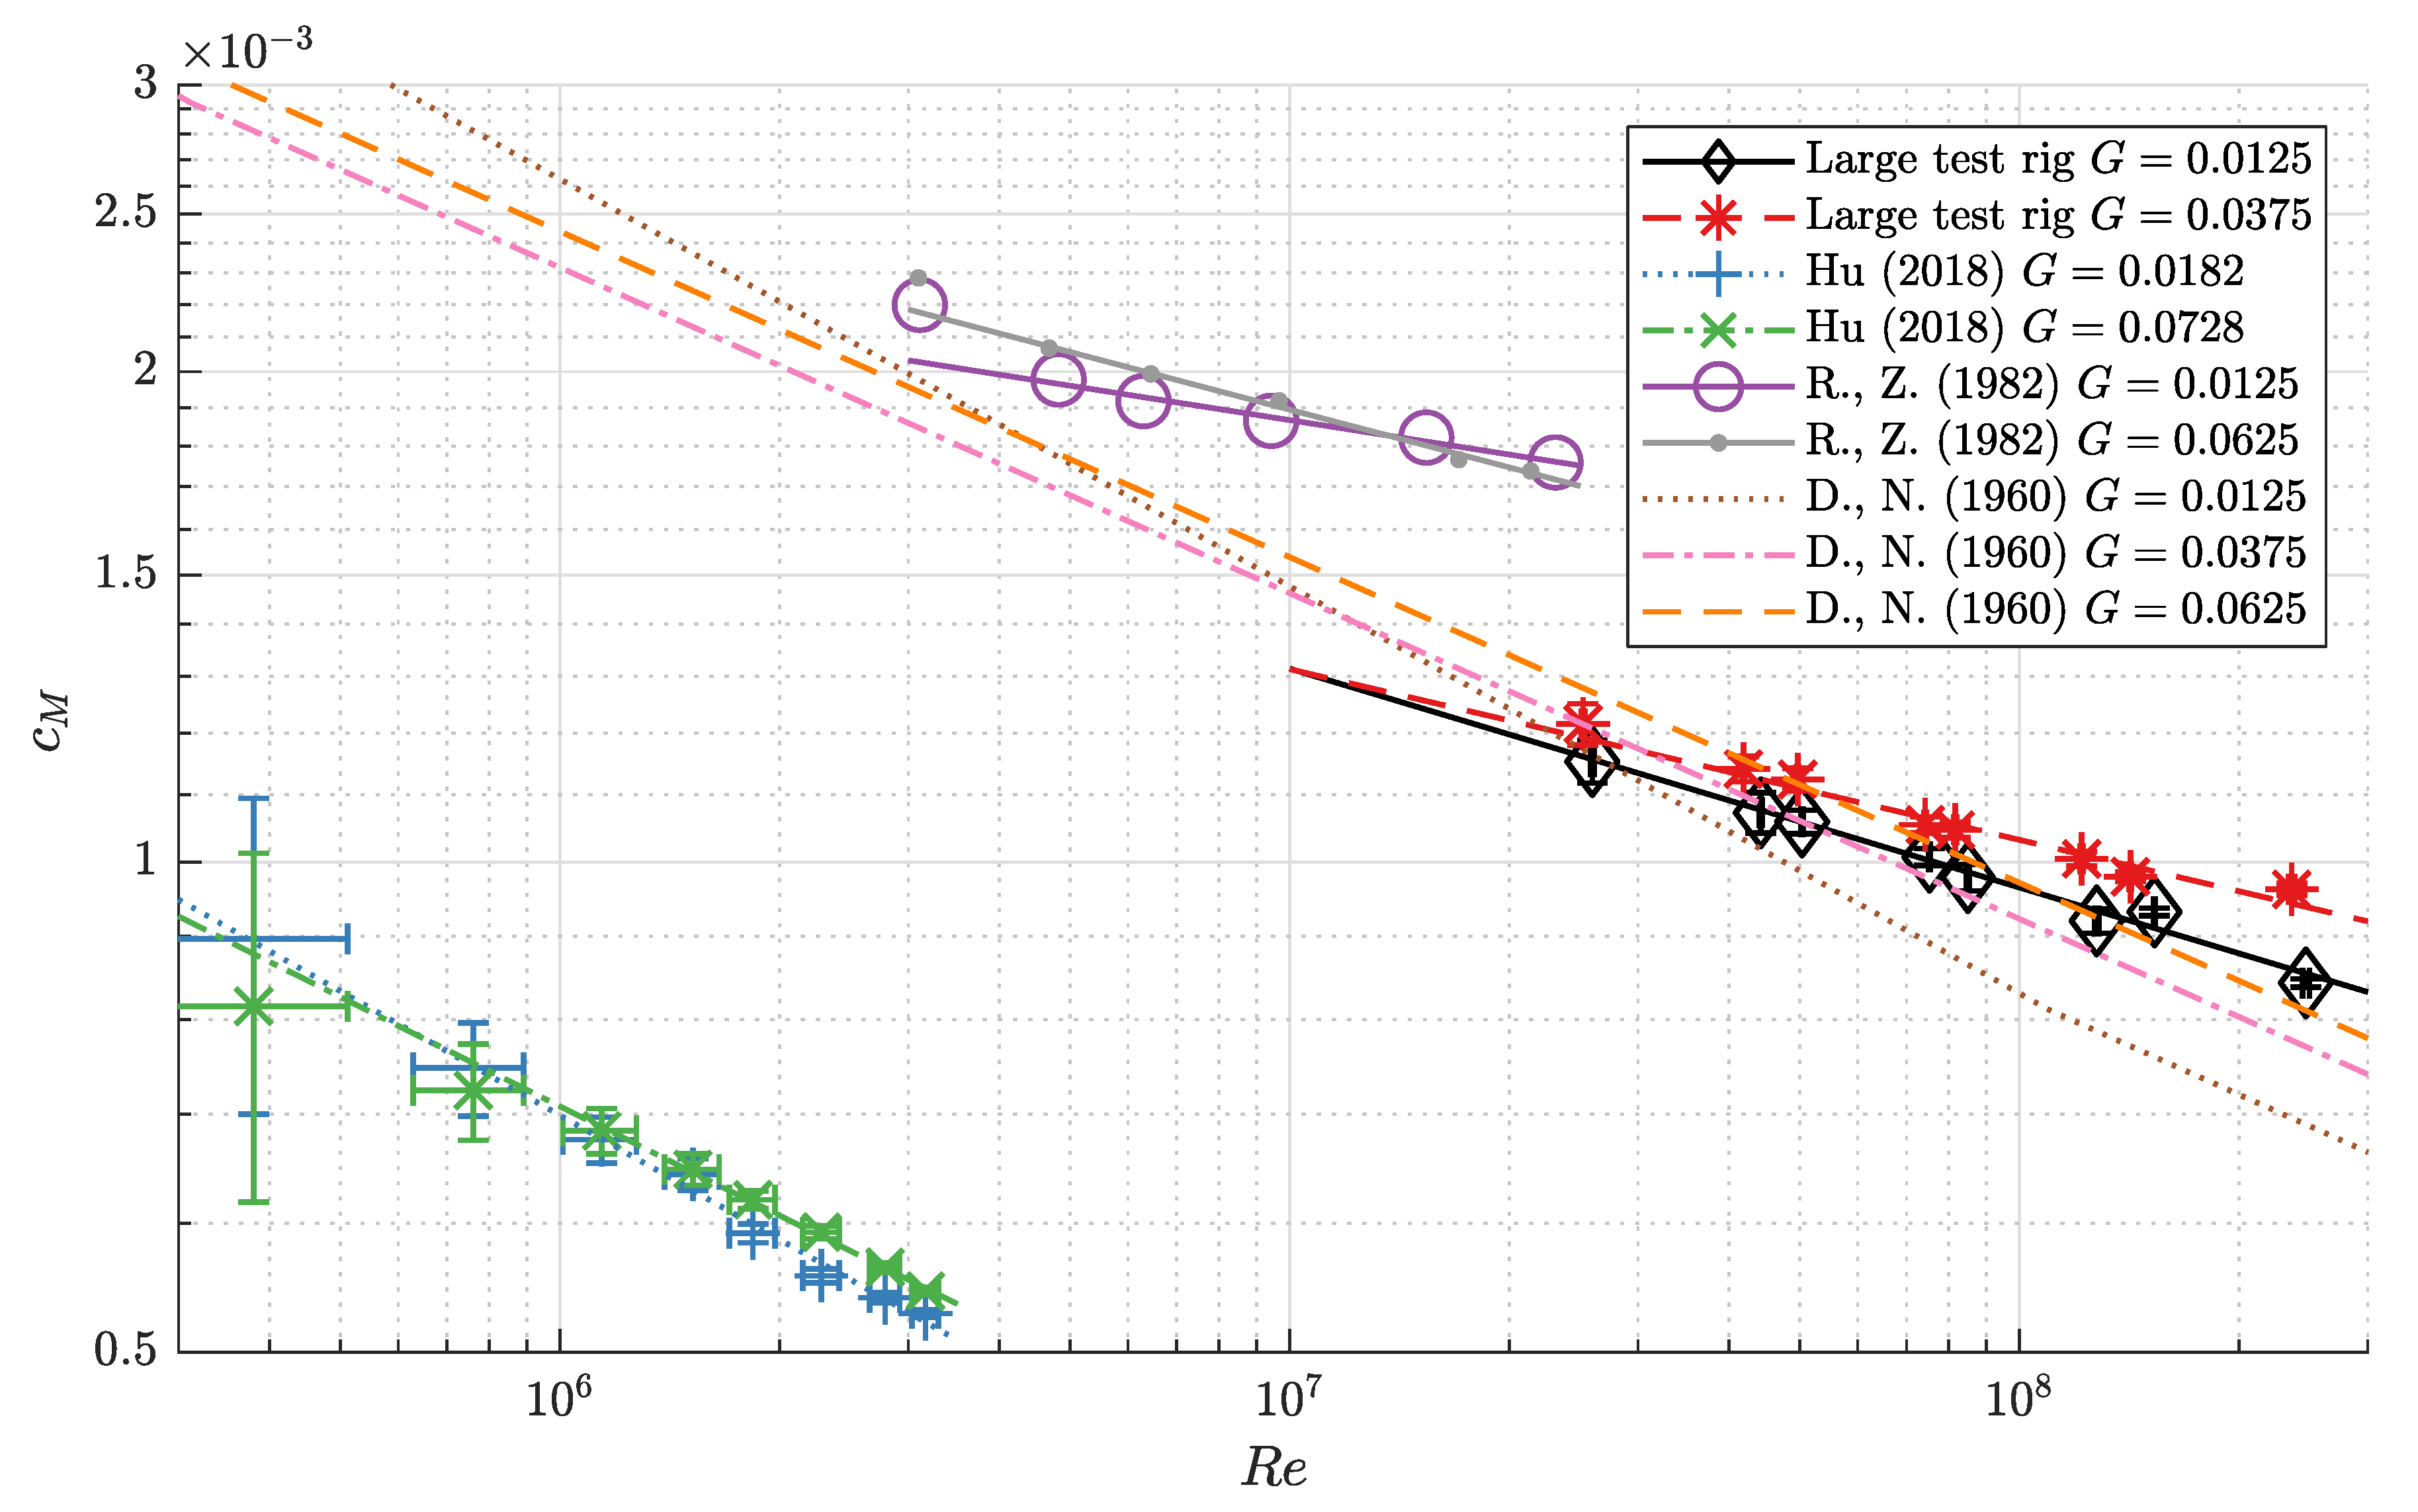
In the closed cavity configuration and in the Reynolds number range of
, the decrease of torque coefficient with increasing Reynolds number behaves in the same way as found experimentally by Daily and Nece [
1] and as predicted by Kurokawa and Toyokura [
14]. For Reynolds numbers
, torque coefficient decreases significantly more slowly with increasing Reynolds number. This behaviour is observed in two different test rigs with two different compressible fluids (the large carbon-dioxide-operated test rig used here and the air-operated test rig built by Radtke and Ziemann [
3]).
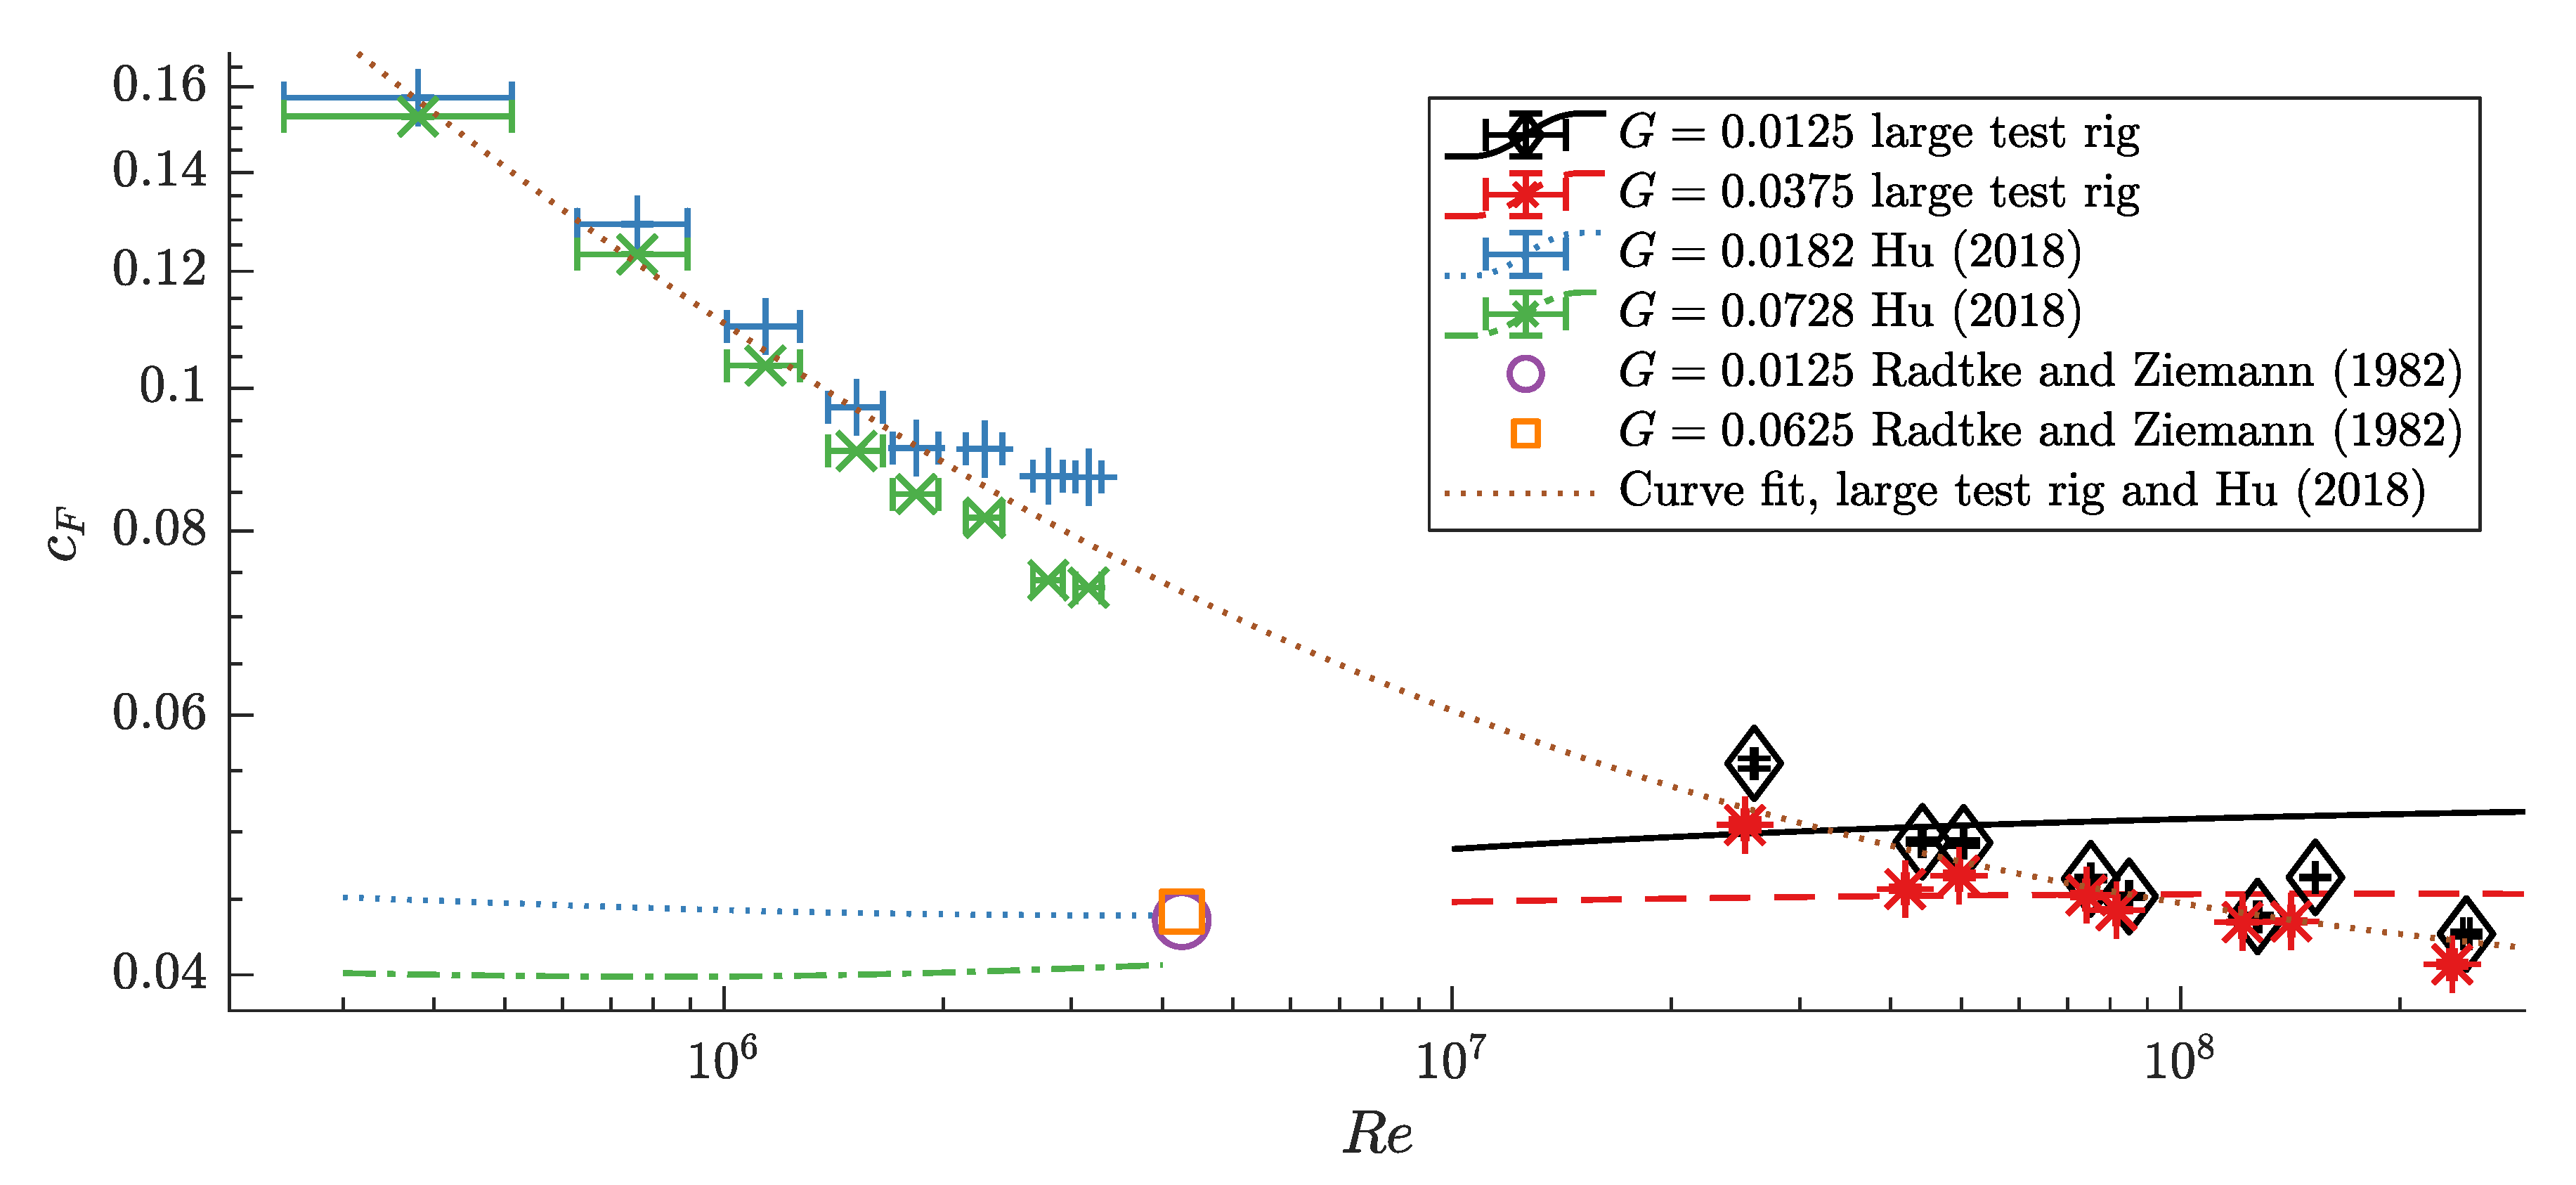
In both the small and large test rigs and in the closed cavity case, axial thrust coefficient is found to decrease with increasing Reynolds number. Neither of the models proposed by Kurokawa and Sakuma [
2] predicts this behaviour. In the large test rig at the small cavity width, the radial pressure gradient decreases with increasing Reynolds number. However, the model by Kurokawa and Sakuma [
2] applicable to this case predicts the opposite behaviour. However, these models capture the influence of the relative axial gap width qualitatively: with increasing Reynolds number, axial thrust coefficient decreases; with increasing cavity width, axial thrust coefficient increases.
In the large test rig with centripetal through-flow, as mass flow coefficient decreases, torque coefficient first decreases to a minimum and then increases. The torque coefficient minima are found at different mass flow coefficients, depending on the specific Reynolds number, relative axial gap width, and preswirl angle. Such minima are not found in the small, water-operated test rig, where in contrast centripetal through-flow with radial inflow increases torque coefficients.
In both the large and small test rigs, increasing the preswirl angle from 0 to 26 leads to a reduction of torque coefficient. No significant differences between preswirl angles of 26 and 52 were observed, with one exception: in the large test rig, at Reynolds numbers in the range of , at the small cavity width of , and when the preswirl angle was increased to 52, a further reduction of torque coefficient was observed.
For the small gap width and a Reynolds number range of , a mass flow coefficient of with any preswirl angle investigated lead to a larger axial thrust coefficient than that of the closed cavity configuration without through-flow. Characteristic maxima of axial thrust coefficients are observed for preswirl angles of 26 and 52. For radial inflow, the coefficients seem to converge towards a maximum, which lies outside the test rig’s operating range. Almost the same behaviour of axial thrust coefficients is observed in the small test rig with radial inflow, where centripetal through-flow increases the axial thrust coefficients, but no signs of maxima are found. Preswirl angle was also found to influence axial thrust coefficient, with an increase in preswirl angle resulting in an increase in the coefficient in both the large and small test rigs.
Finally, the increase of axial thrust coefficient with centripetal through-flow and a preswirl angle of 52 observed in the large test rig is a result of the pressure increasing at relative radii of and decreasing at relative radii of compared to the radial pressure distribution of the closed cavity case.
