Article

High Resolution Experimental and Computational Methods for Modelling Multiple Row Effusion Cooling Performance †

1
Department of Engineering Science, University of Oxford, Oxford OX1 3PJ, UK
2
Turbine Systems, Rolls-Royce PLC, Derby DE24 8BJ, UK
*
Author to whom correspondence should be addressed.
This paper is an extended version of our paper published in Proceedings of the European Turbomachinery Conference ETC12 2017, Paper No. 130.
Int. J. Turbomach. Propuls. Power 2018, 3(1), 4; https://doi.org/10.3390/ijtpp3010004
Submission received: 18 December 2017 / Revised: 25 January 2018 / Accepted: 29 January 2018 / Published: 31 January 2018

Abstract

:
The continuing rise in turbine entry temperatures has necessitated the development of ever-more advanced cooling techniques. Effusion cooling is an example of such a system and is characterised by a high density of film cooling holes that operate at low blowing ratios, thereby achieving high overall cooling effectiveness. This paper presents both an experimental and computational investigation into the cooling performance of effusion systems. Two flat-plate geometries (with primary hole pitches of 3.0D and 5.75D) are experimentally investigated via a pressure sensitive paint technique yielding high resolution film effectiveness distributions via heat-mass transfer analogy. A computational fluid dynamics (CFD) scalar tracking method was used to model the setup computationally with the results comparing favourably to those obtained from the experiments. The CFD domain was modified to assess the cooling performance from a single film hole ejection. A superposition method was developed and applied to the resulting two-dimensional film effectiveness distribution that quickly yielded data for an array of closely-packed holes, allowing a rapid assessment of a multi-hole effusion type setup. The method produced satisfactory results at higher pitches, but at lower pitches, high levels of jet interactions reduced the performance of the superposition method.

1. Introduction

The ongoing drive to increase turbine thermal efficiency and specific power output has resulted in a continuing increase in both turbine entry temperatures (TETs) and pressure ratio. As a consequence, the last fifty years have seen temperatures at entry to the high pressure (HP) turbine rise by over 500 K with turbine blade operating temperatures now in excess of the material’s engineering limits [1]. This has necessitated increasingly complex methods of internal convective cooling on the inside of the blade surface and external film cooling, which acts to shield the blade from the hotter core gas. However, it is noted that raising the coolant flow rate is at the detriment of engine efficiency, and as a result, cooling systems that achieve high cooling effectiveness using a small coolant volume are preferable [2].
Effusion cooling technology presents one possible method whereby high cooling performance can be achieved whilst simultaneously reducing the required coolant flow rate. It is fundamentally based on a similar mechanism to film cooling in which coolant is passed through holes in the blade surface, forming a protective film of cooler air. However, in the case of film cooling, the discrete nature and relatively large spacing of the holes results in an incomplete coverage of the protective film. Additionally, the high momentum flux of the jets through the film holes results in jet lift-off at the exit of the holes, consequently increasing mixing losses and reducing cooling performance until the jets re-attach downstream [3].
Effusive cooling systems differ from those of film cooling in the size and spacing of the holes, where effusion cooling is typically characterised by smaller diameter holes with a much smaller pitch than film cooling holes. This is often described by small non-dimensional hole pitch (S/D). This increased hole density with reduced diameter has been shown to provide significant increases in effectiveness (see [4,5,6]); this is a result of both a reduction in blowing ratio (and consequently, jet lift-off), allowing the formation of a near continuous film, along with an increased combined convective effect within each of the cooling holes. Foster and Lampard [7] demonstrated the rise in effectiveness with smaller spanwise hole pitching and also observed a decrease in jet lift-off. Relative to conventional films, variations in surface temperature are also reduced as hole density is increased [8], and this can help alleviate thermal stresses that can have an adverse effect on blade life. As with film cooling, diffuser-shaped outlet holes are sometimes used to reduce jet exit velocity and help increase film coverage [3]. For similar reasons, effusion holes are often inclined to the blade surface direction, typically at around 30–35° [9]. Krawciw et al. [10] performed an experimental and computational study investigating the variation in film performance between an inclined cylindrical film hole and two fanned hole geometries, demonstrating the anticipated improvement in film effectiveness attributed to lateral jet spreading in the fanned geometries. Hu and Ji [11] performed a conjugate CFD study investigating the effect of varying inclination angle on cooling effectiveness and observed little variation in film performance between 30° and 60° inclined cylindrical holes. However, given the increased length for convective cooling with the 30° holes, this configuration is preferable. A study by Andreini et al. [12] did, however, demonstrate that at very high blowing ratios, more characteristic of combustor liner cooling, normally inclined film holes did display a slight improvement over those angled at 30°, and this was attributed to both an anticipated increase in heat transfer inside the holes due to entrance effects, as well as a reduction in mainstream heat transfer augmentation. The same study also investigated the effect of the hole length to diameter ratio with results suggesting that higher adiabatic film effectiveness was achieved as this ratio was increased. Ceccherini et al. [13] investigated the effect of blowing ratio on effusion cooled flat-plates at two mainstream Mach numbers (0.15 and 0.4) and demonstrated that the lowest blowing ratio tested (0.5), in general, exhibited the greatest spanwise adiabatic film cooling effectiveness, and this decreased as the blowing ratio was further elevated; a trend that was observed at both mainstream Mach numbers. At the lower mainstream Mach number, however, it was observed that the asymptotic developed film state was reached earlier and with a slightly lower absolute film effectiveness value than the highest blowing ratio investigated (1.7). Andrei et al. [14] assessed the effect of density ratio in effusion cooling applications and found the effect to be relatively small, particularly at higher blowing ratios. Krewinkel [3] also discusses how variations in surface roughness due to manufacturing techniques have been shown to influence cooling performance with observations of greater roughness increasing effectiveness.
Challenges exist, however, in the successful implementation of effusion cooling systems, which have, to-date, somewhat limited their application in gas turbine environments. As noted by Krewinkel [3], manufacturing costs and concerns over component reliability remain, although advances in manufacturing methods are helping to address these issues. An additional consideration is the risk of blockage associated with the typically smaller hole diameters characteristic of effusion cooling. It is also noted that there exists an aerodynamic penalty associated with the mixing of film jets, and consequently, an optimisation process is required in the development of components to ensure that the thermal benefits of effusion type systems outweigh any potential additional aerodynamic losses.
Experiments on effusion type systems have typically investigated non-dimensional hole pitches in the range of 2–16 [5,12,14,15,16,17]. However, to the best of the author’s knowledge, few studies in the open literature have discussed and compared a range of computational and experimental methods for modelling multiple row effusion cooling performance.
The current study discusses a number of experimental and computational methods for modelling multi-row effusion cooling performance for two flat-plate effusion geometries utilising 30° inclined cylindrical cooling holes. The results of each method are then contrasted and discussed.

2. Materials and Methods

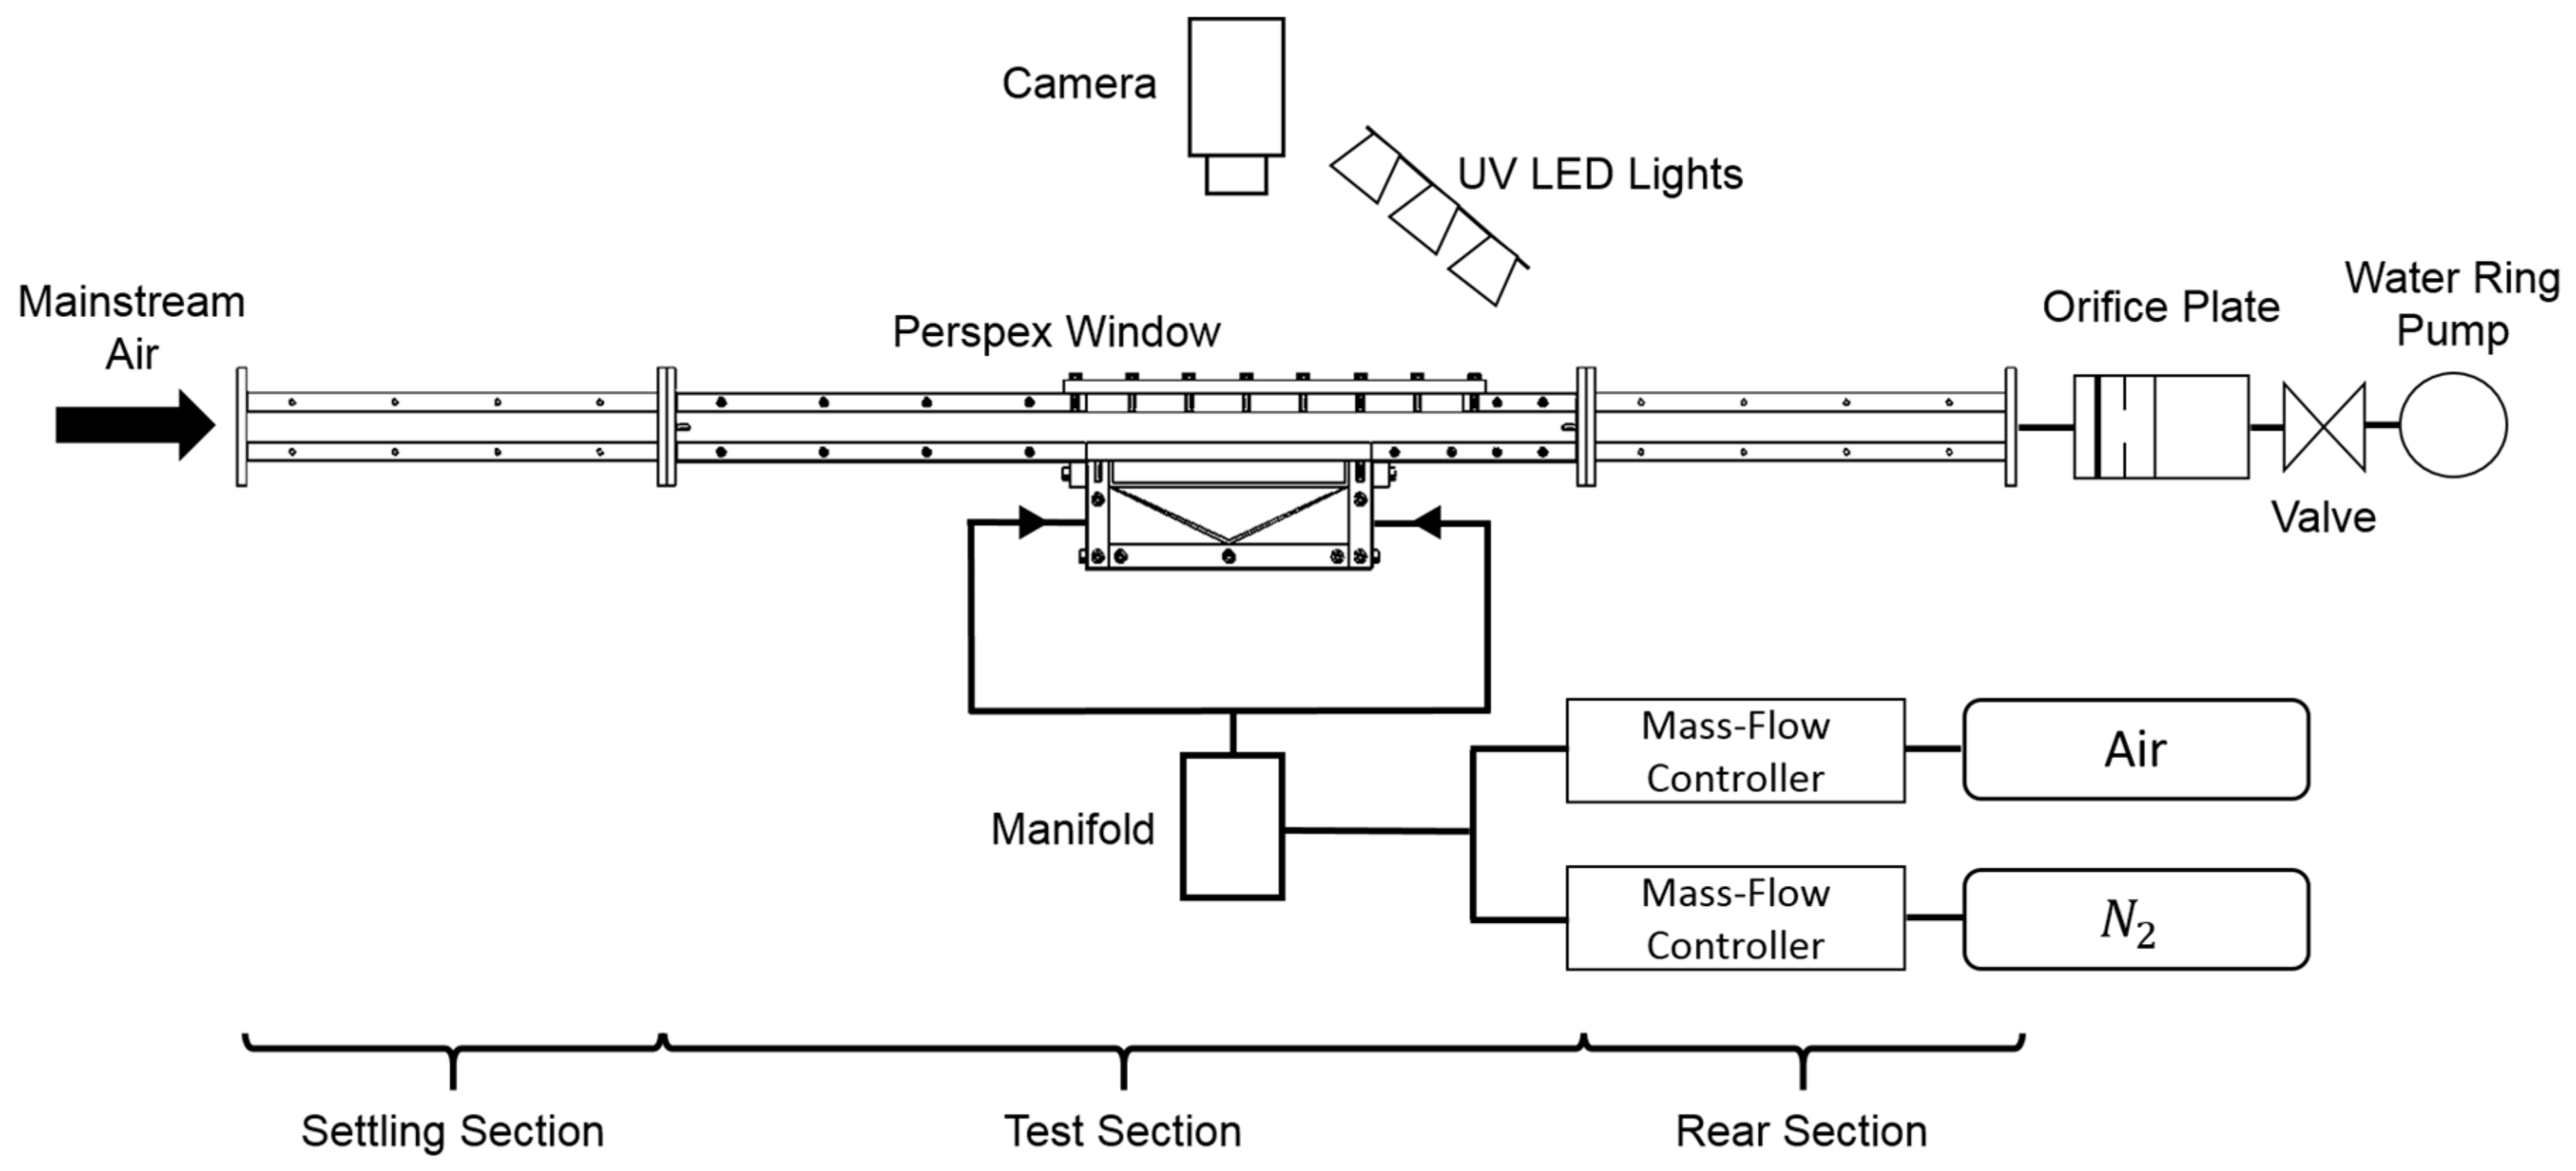
2.1. Experimental Setup

The experimental study utilised one of the low speed wind tunnel facilities at the Oxford Thermofluids Institute (http://www.eng.ox.ac.uk/thermofluids), University of Oxford. A schematic of the experimental setup is provided in Figure 1 with an elaboration on some of the key features below.
The mainstream flow was comprised of ambient air, drawn in through a filtered open intake by a water ring vacuum pump, through a channel cross-sectional area measuring 192 mm × 24 mm. An upstream settling section was of sufficient length to allow flow development and to help ensure a uniform velocity profile. All tunnel sections were manufactured from clear acrylic (Altuglas International, Saint-Avold, France) to allow for optical access.
Coolant flow comprised a mixture of air and nitrogen, the respective quantities of which were controlled by two automatic mass-flow controllers. The nitrogen source was a compressed nitrogen bottle, whilst the coolant air supply was via the laboratory compressed air supply. Both gas streams were then mixed via a manifold system after which the mixed gas was passed through four hoses (of equal diameter and length) and entered the coolant plenum. To help ensure an even coolant feed, the four hoses were fed into the coolant plenum in a symmetrical manner, and a two-layer perforated plate system was used to dissipate the jets.

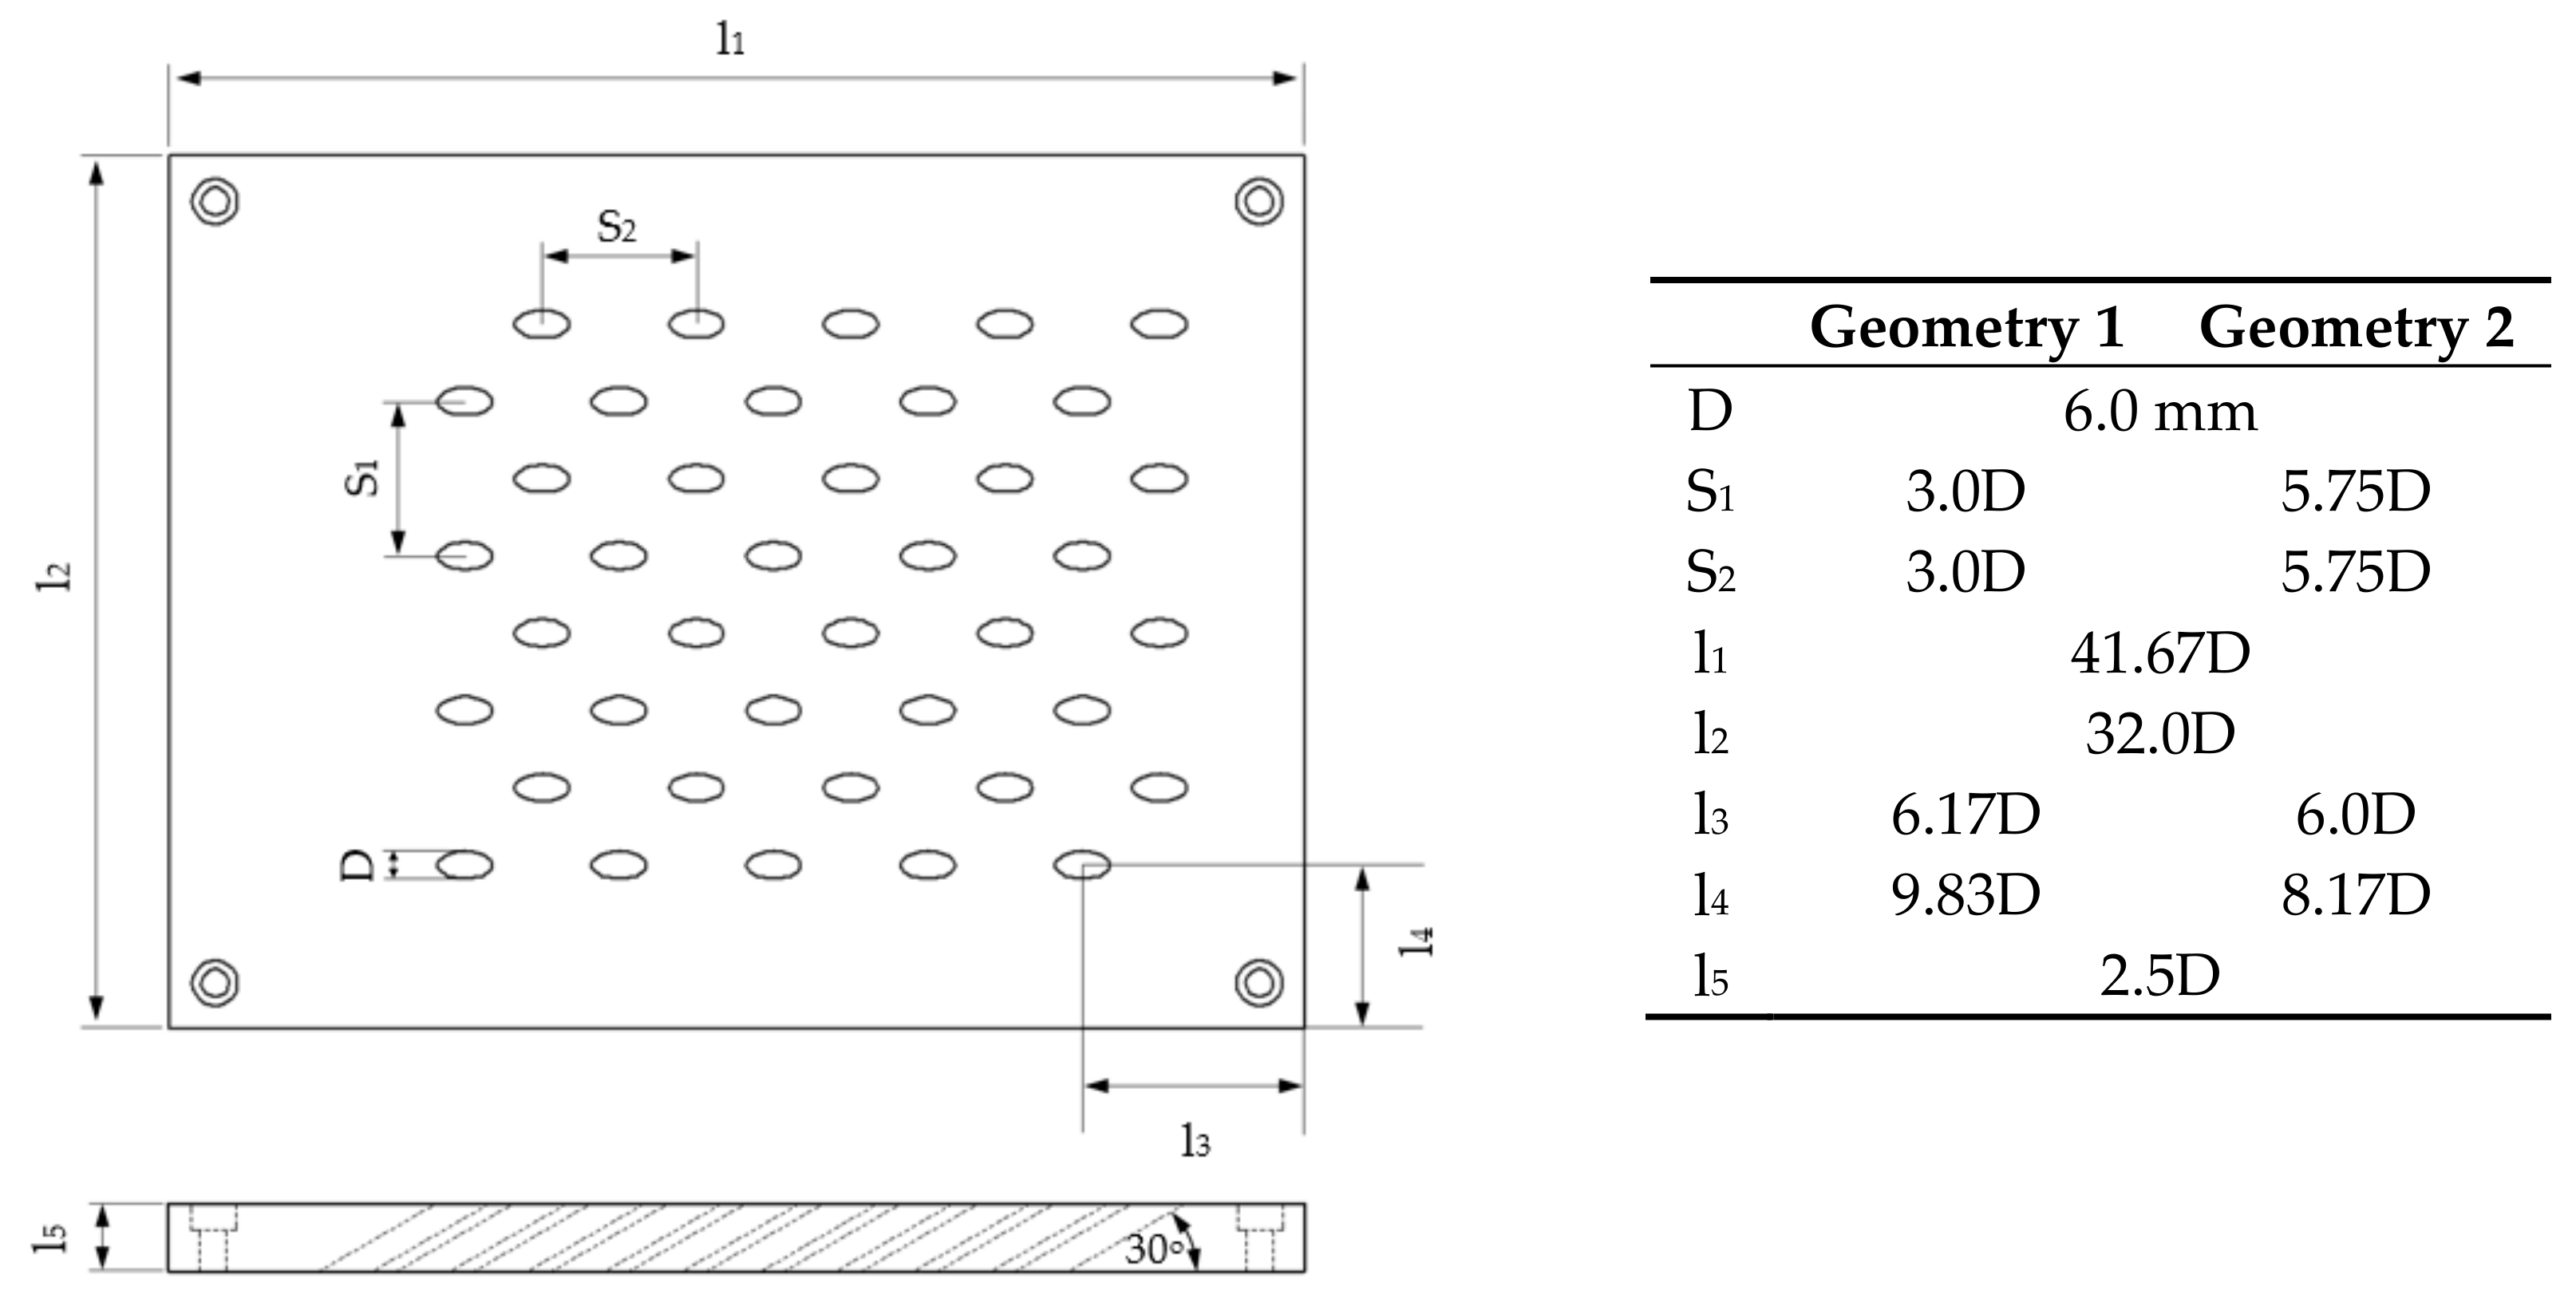
2.2. Flat-Plate Effusion Cooling Geometries

The experimental setup was used to assess the film cooling performance achieved from two flat-plate cooling geometries. Both geometries exhibited a staggered configuration of circular film holes angled at 30° to the plate surface. Two non-dimensional hole pitches (based on the primary holes) were tested with Geometry 1 exhibiting a pitch of P1 = 3.0 and Geometry 2 a pitch of approximately P2 = 5.75. The hole diameter in both cases was 6.0 mm, and further plate dimensions are provided in Figure 2. It is also noted that Geometry 1 exhibited a 7 × 8 array of primary holes with a total of 112 holes including those that were staggered, whilst Geometry 2 exhibited a 4 × 5 array of primary holes with a total of 40 holes including the staggered hole components. The plates were manufactured from a single piece of aluminium of 2.5D depth with the holes drilled through the surface. O-ring seals were placed at the base of the plates to minimise flow leakage during experiments with the plates being secured via bolts placed in each corner.
For both geometries, blowing ratios in the range of 0.1–1.2 were investigated. To achieve the required blowing ratio, both coolant and mainstream mass-flow rates were varied. Maximum mainstream inlet flow velocities were around 9.5 m/s, whilst to achieve the higher blowing ratios, mainstream inlet velocity was reduced to 5.75 m/s. Turbulence intensity was estimated using an empirical correlation for pipe flow and based on the inlet Reynolds number (with duct hydraulic diameter as the length scale) and varied between 4.43% and 4.72%. Turbulence length scale was determined as being approximately 0.5D and calculated based on both the hydraulic diameter of the duct and the maximum mixing length in developed turbulent flow through a pipe (see [18]). Freestream boundary layer thickness was predicted, based on the turbulence length scale [18], as being approximately 1.25D.
It is noted that experimental errors increased at the lower blowing ratios given the precision of the mass-flow controllers; however, these did not exceed 15%.

2.3. Pressure Sensitive Paint Measurement Methodology

A brief overview of the pressure sensitive paint (PSP) measurement technique is provided here, but the reader is referred to Wong et al. [19], Gurram et al. [20] and Han and Rallabandi [21] for further details.
The UniFIB PSP (supplied by Aircraft Research Association, Bedford, UK) used in the study is comprised of a mixture of fluoro isopropyl butyl polymer (FIB), platinum tetra(pentafluorophenyl) porphine (PtTFPP) and a white pigment. As noted by Wong et al. [19], PtTFPP is a luminophore that responds when exposed to light of a certain wavelength. This response is quenched by the interaction with oxygen, and consequently, the intensity of the emitted light decreases as the partial pressure of oxygen in contact with the PSP increases. By careful calibration, the partial pressure of oxygen can be determined at all positions across the PSP. The analogy of heat and mass transfer is fundamental to the experiment, and consequently, the mainstream flow field was turbulent across all experiments. Equation (1) demonstrates the experimental measurements of oxygen partial pressure required to allow for an estimation of film effectiveness by heat-mass transfer analogy [21]. Given the similar molecular weights of air and nitrogen, the mass fraction ratio is approximately equivalent to the mole fraction ratio and consequently the partial pressure ratio. It is also noted that in Equation (1), C O 2 , c is zero, as pure nitrogen was used as the coolant in the experiments.
η f = ( T T a w ) ( T T c , e )     ( C C w ) ( C C c ) = ( C O 2 , a i r C O 2 , N 2 ) ( C O 2 , a i r C O 2 , c ) = 1 C O 2 , N 2 C O 2 , a i r = 1 p O 2 , N 2 p O 2 , a i r = 1 p O 2 , N 2 / p O 2 , r e f p O 2 , a i r / p O 2 , r e f
During experiments, a gas thermocouple was used to monitor coolant temperature with variations kept to a minimum in an attempt to reduce the impact of thermal effects on the PSP method. Intensity images of the experiments were captured using a 1928 × 1452 resolution, monochromatic CCD camera (Allied Vision Technologies Bigeye G-283B, supplied by Stemmer Imaging, Tongham, UK) with a 610 nm-long pass filter. The in-house MATLAB (version R2015b, MathWorks, Cambridge, UK) post-processing method developed by Wong et al. [19] was utilised in calculating film effectiveness from the raw image data. It is noted that, following the perturbation method discussed by Moffat [22], the greatest uncertainty in film effectiveness values occur at lower effectiveness where for an effectiveness of around 0.14, the associated uncertainty is 3.1%. This drops to around 1.4% for effectiveness values greater than 0.8. For further details on the uncertainty associated with this PSP experimental rig setup, please see Wong et al. [19], where this is discussed in greater detail.

2.4. Computational Simulations

Modelling of film cooling performance by computational means provides a significant engineering challenge. Accurately capturing the innately complex flow features associated with film ejection and flow-mixing necessitates the use of dense computational meshes and more advanced turbulence models—such as large eddy simulations (LES)—that require significant computational power. Indeed, CFD is well known to struggle with accurate prediction of absolute film effectiveness levels [23,24]. An alternative method of modelling film performance via CFD that was particularly suited to the validation of the PSP experimental results utilised a mass transfer method in which the concentrations of an introduced passive species were obtained throughout the flow domain. By heat-mass transfer analogy, the film effectiveness performance could be ascertained.

2.5. Passive Scalar Tracking CFD Methodology

The scalar tracking CFD method passively tracks the motion of introduced scalar particles in the fluid medium. The motion of these particles is described via the general convection-diffusion equation repeated in Equation (2).
ϕ t = · ( Γ ϕ ) · ( v ϕ ) + s ϕ
For the current simulations, it is noted that there are no source terms ( s ϕ = 0). The simulation is also steady-state, and consequently, ϕ / t = 0, leading to the simplification shown in Equation (3).
· ( v ϕ ) = · ( Γ ϕ ) ( v n ϕ ) x n = x n ( Γ ϕ x n )
The flow is also assumed to be incompressible given both the ambient temperature and low speed of the rig being validated, along with a further assumption of constant cp. To reproduce the mixing behaviour observed in the thermal field, the diffusivity of the introduced scalar is set to that of the effective thermal diffusivity, and this is shown in Equation (4), where the turbulent Prandtl number has a value of approximately 0.85.
Γ = 1 ρ c p ( k l + ( c p μ t P r t ) ) = α
As noted by Thomas and Povey [25], by setting the scalar concentrations at the inlet of the cooling holes to 1 and that at the inlet of the mainstream to 0, the scalar concentration in the mixed flow can be calculated as a fraction of the coolant to mixed mass-flow rate. This, in combination with the continuity and energy equations, can be shown to be analogous to the film effectiveness as described in Equation (5), and the reader is referred to [25] for further details.
Σ ϕ = ( T T a w ) ( T T c , e ) = η f

2.6. Multi-Hole CFD Domain and Setup

The multi-hole CFD simulations were performed using Ansys Fluent (Version 16.2, Ansys Inc., Canonsburg, PA, USA) on the same geometries as were tested in the experimental setup. The CFD domain modelled the test section used in the experimental setup. The mainstream flow domain commenced at the leading edge of the flat-plate with the exit of the simulated domain at the trailing edge of the plate. Viscous walls were situated at locations corresponding to the walls of the wind tunnel. Coolant was fed to the inlet of the effusion cooling holes via a plenum that was of identical cross-sectional area to the experimental setup. A velocity boundary condition was specified at the inlet of the mainstream flow with the velocity profile obtained from separate simulations that modelled flow development along the inlet settling section of the experimental rig. The coolant inlet boundary condition was a specified mass-flow rate. Both the mainstream and coolant boundary conditions were based on the same values tested in the experiments with turbulence properties estimated as described in Section 2.2. Additional boundary conditions were required for the introduced species at both flow inlets, as well as the outlet. For both geometries, a mesh refinement study was performed (using Ansys ICEM, Version 16.2, Ansys Inc.) to ascertain the required mesh fidelity to allow for relatively low simulation times whilst having little effect on the veracity of the results. Meshes for both geometries were approximately 6 million elements in size, unstructured in nature and comprised of tetrahedral elements with prism layers at the solid/fluid interface and refinements around the film hole locations. In all simulations y+ values were less than 5. Additionally, across all simulations, the realisable k-ϵ turbulence model was used with enhanced wall treatment.

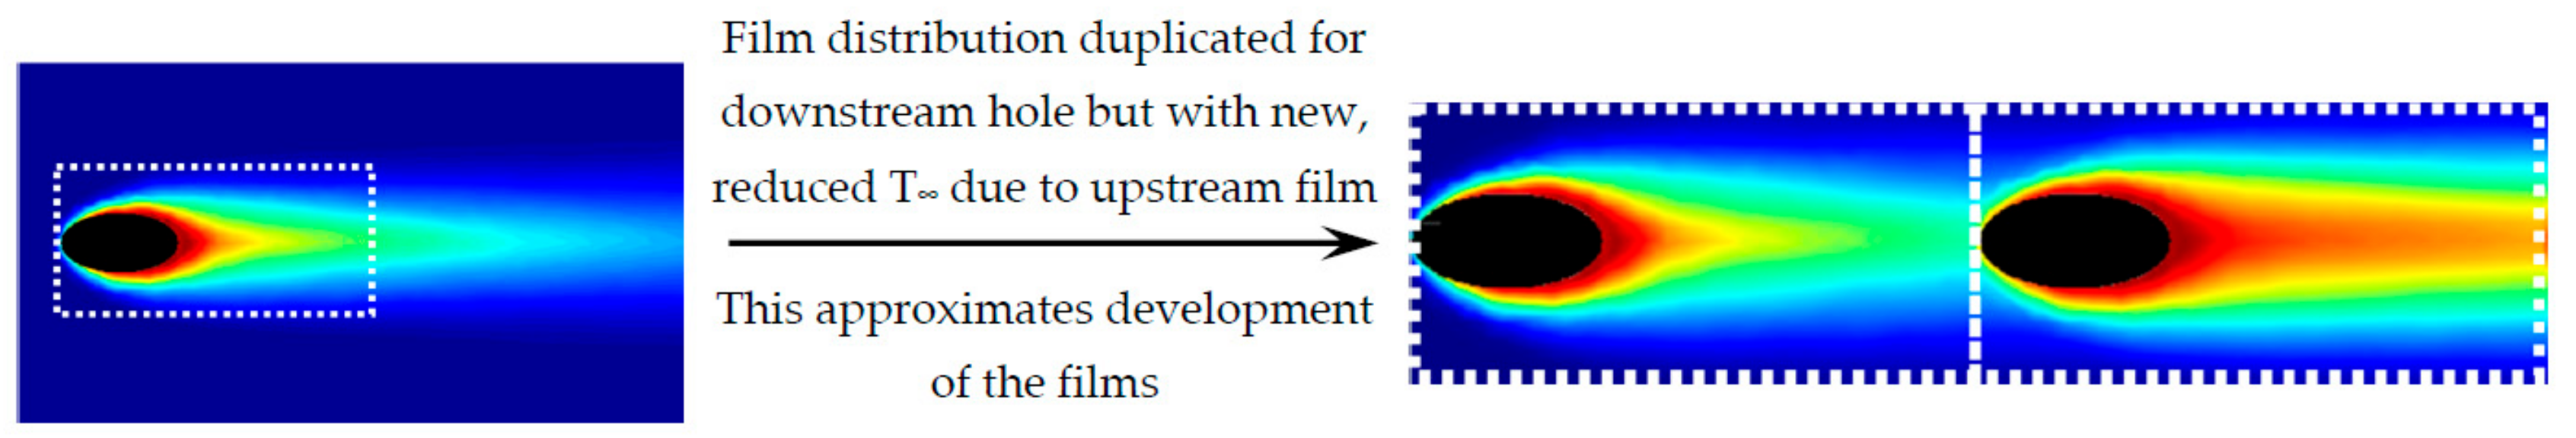
2.7. Single Hole CFD Domain, Setup and Superposition Method for Multi-Row Modelling

An additional method of effusion cooling modelling was considered, which utilised the additive superposition method proposed by Sellers [26]. The use of a superposition model allows for the manipulation of data from a single film ejection to develop data for multi-row film performance. The Sellers model treats each ejected film as being an independent and confined layer and is described in Equation (6). The basis of the method is that the freestream temperature for the single film cooling hole is replaced by the adiabatic wall temperature, which results from the upstream films. To the authors’ knowledge, the present work is the first to apply this process to detailed, two-dimensional distributions of effectiveness.
η f = 1 i = 1 n ( 1 η f i ( x ) )
To make the method as comparable as feasibly possible to the experimental work and multi-hole CFD simulations, the CFD domain once again modelled the experimental setup; however, in this case, the flat-plate simulated had only a single film hole. Mesh parameters and the CFD solver setup remained the same as with the multiple hole simulations. After running the solution, the resulting film effectiveness distribution and node location information were imported into a bespoke MATLAB script. The script replicated the film effectiveness data in the spanwise direction based on a specified hole pitch, whilst in the streamwise direction, Sellers’ superposition method was used to model downstream film development. For simplification, the non-dimensional pitching tested via this method was 5.75, given that there is little spanwise interaction between the individual films at this hole pitch. An example of the method is demonstrated in Figure 3.

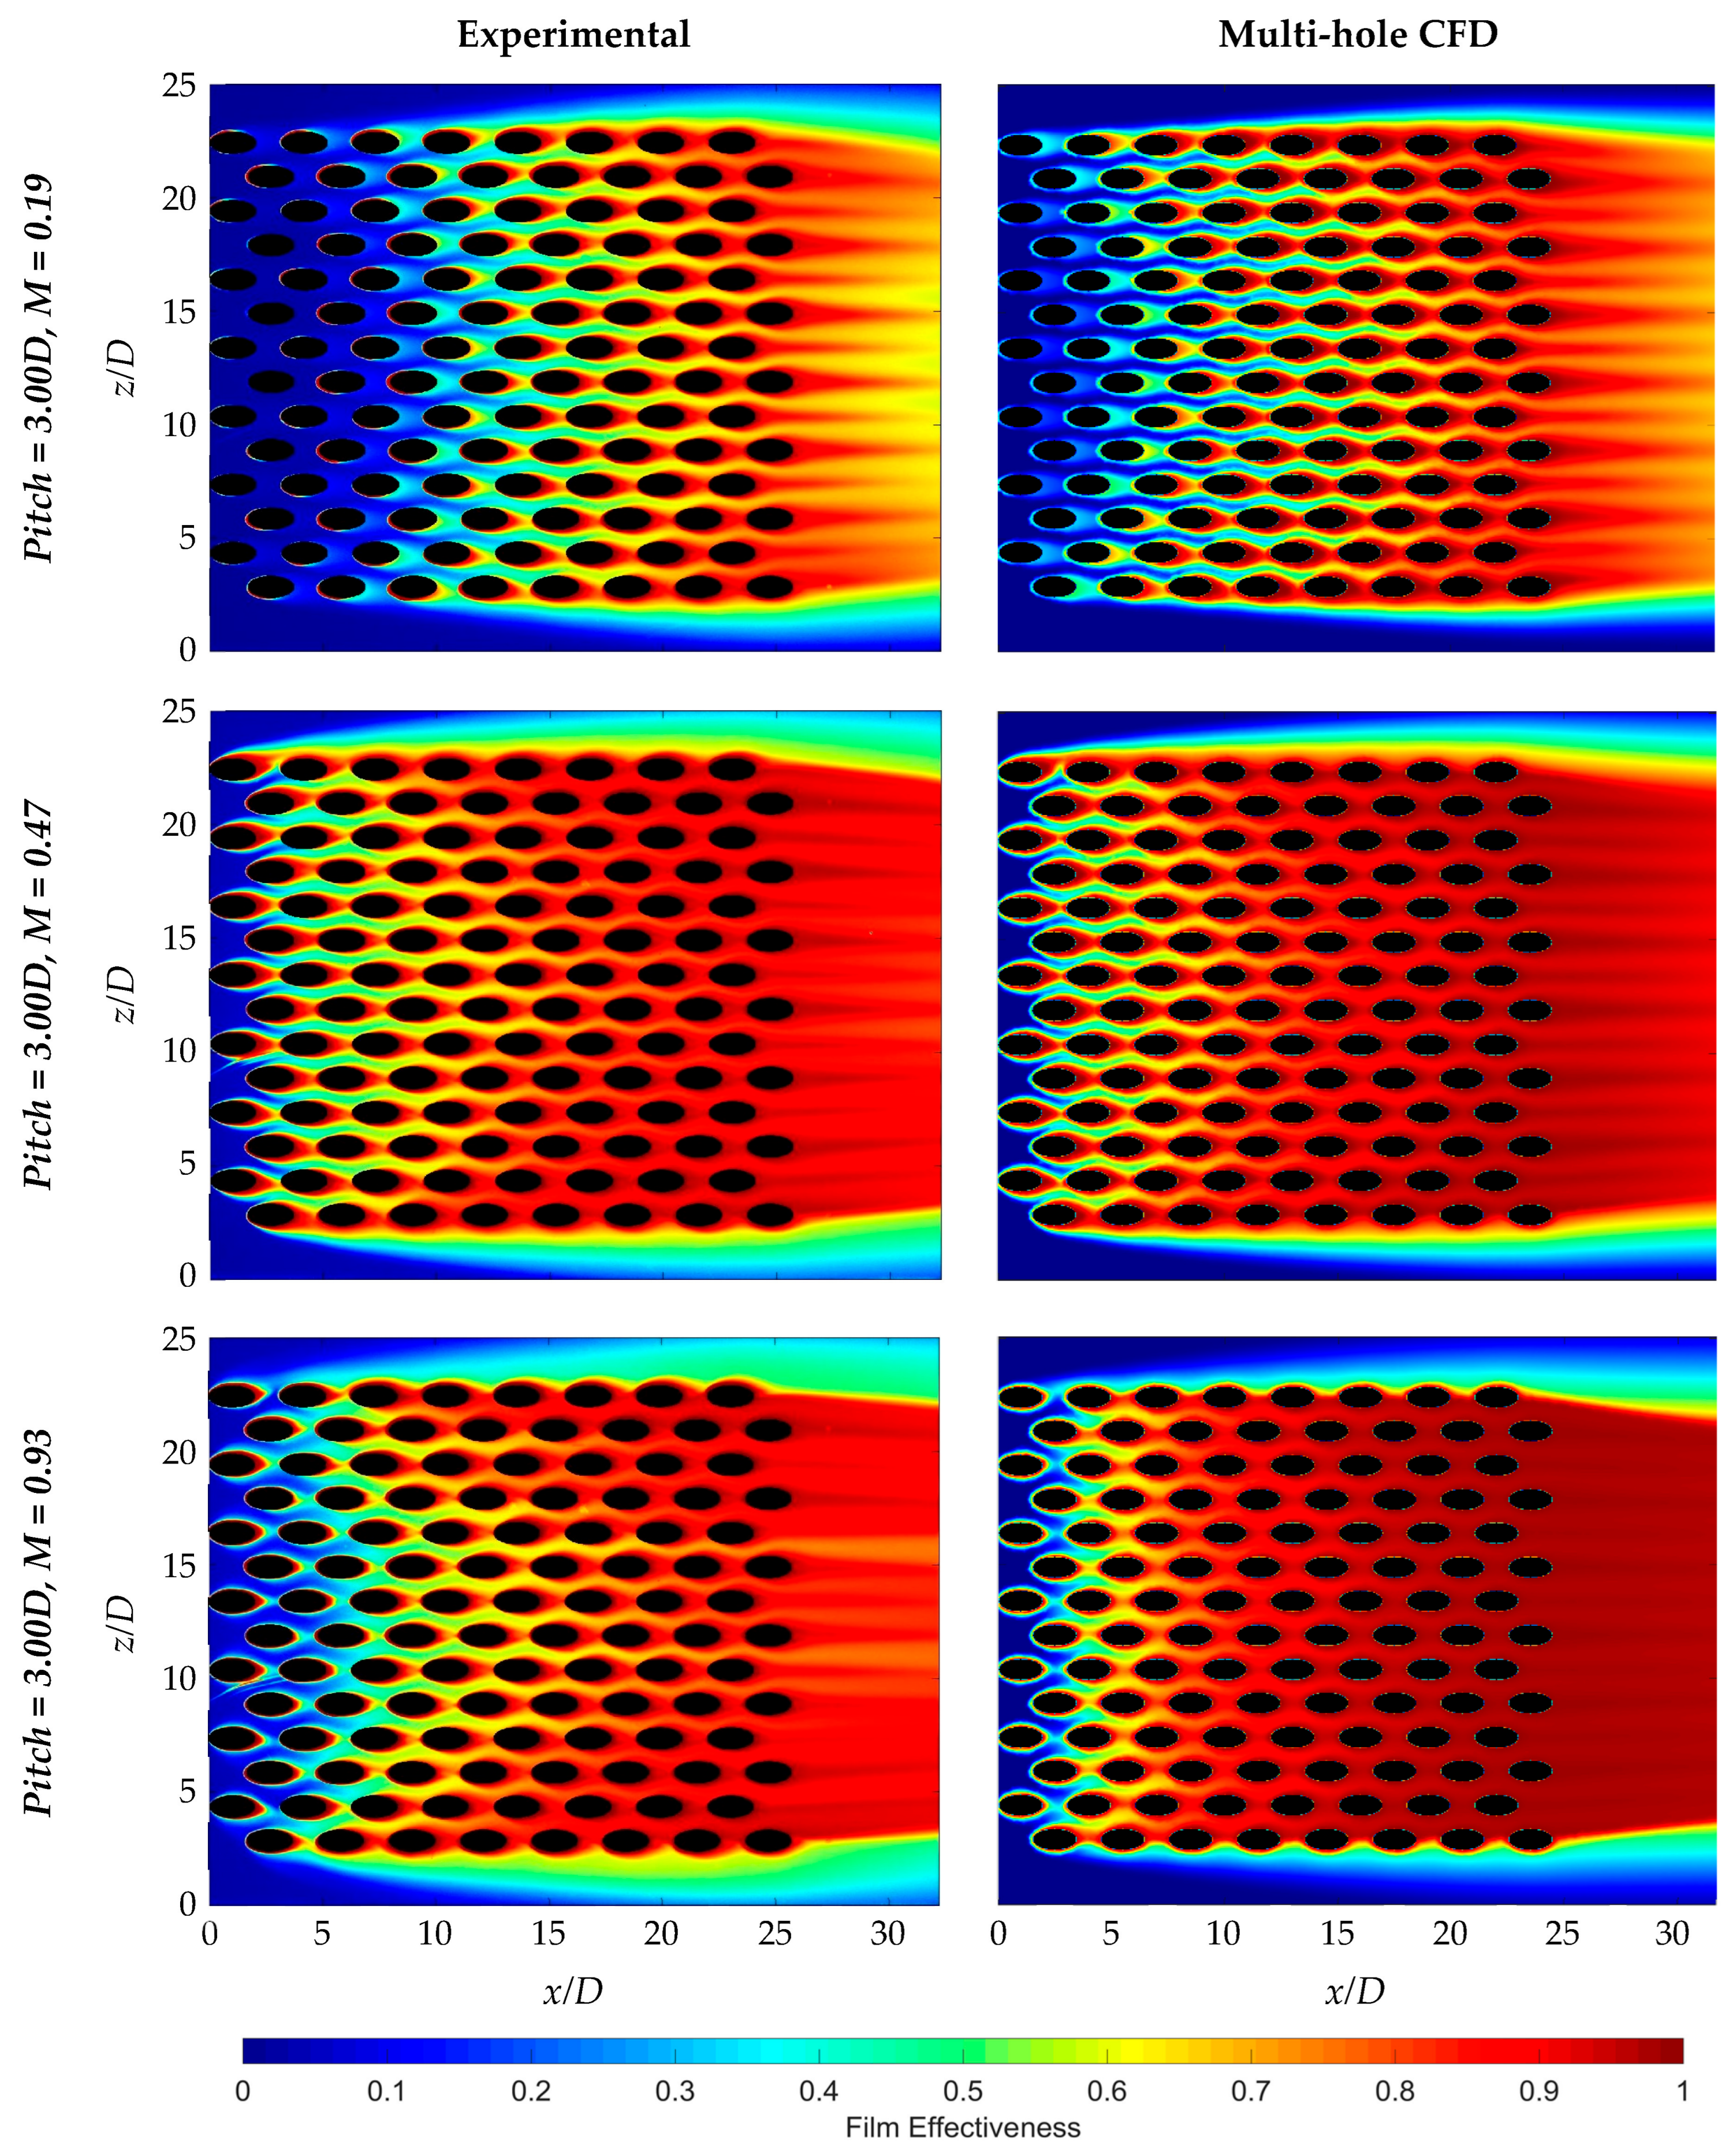
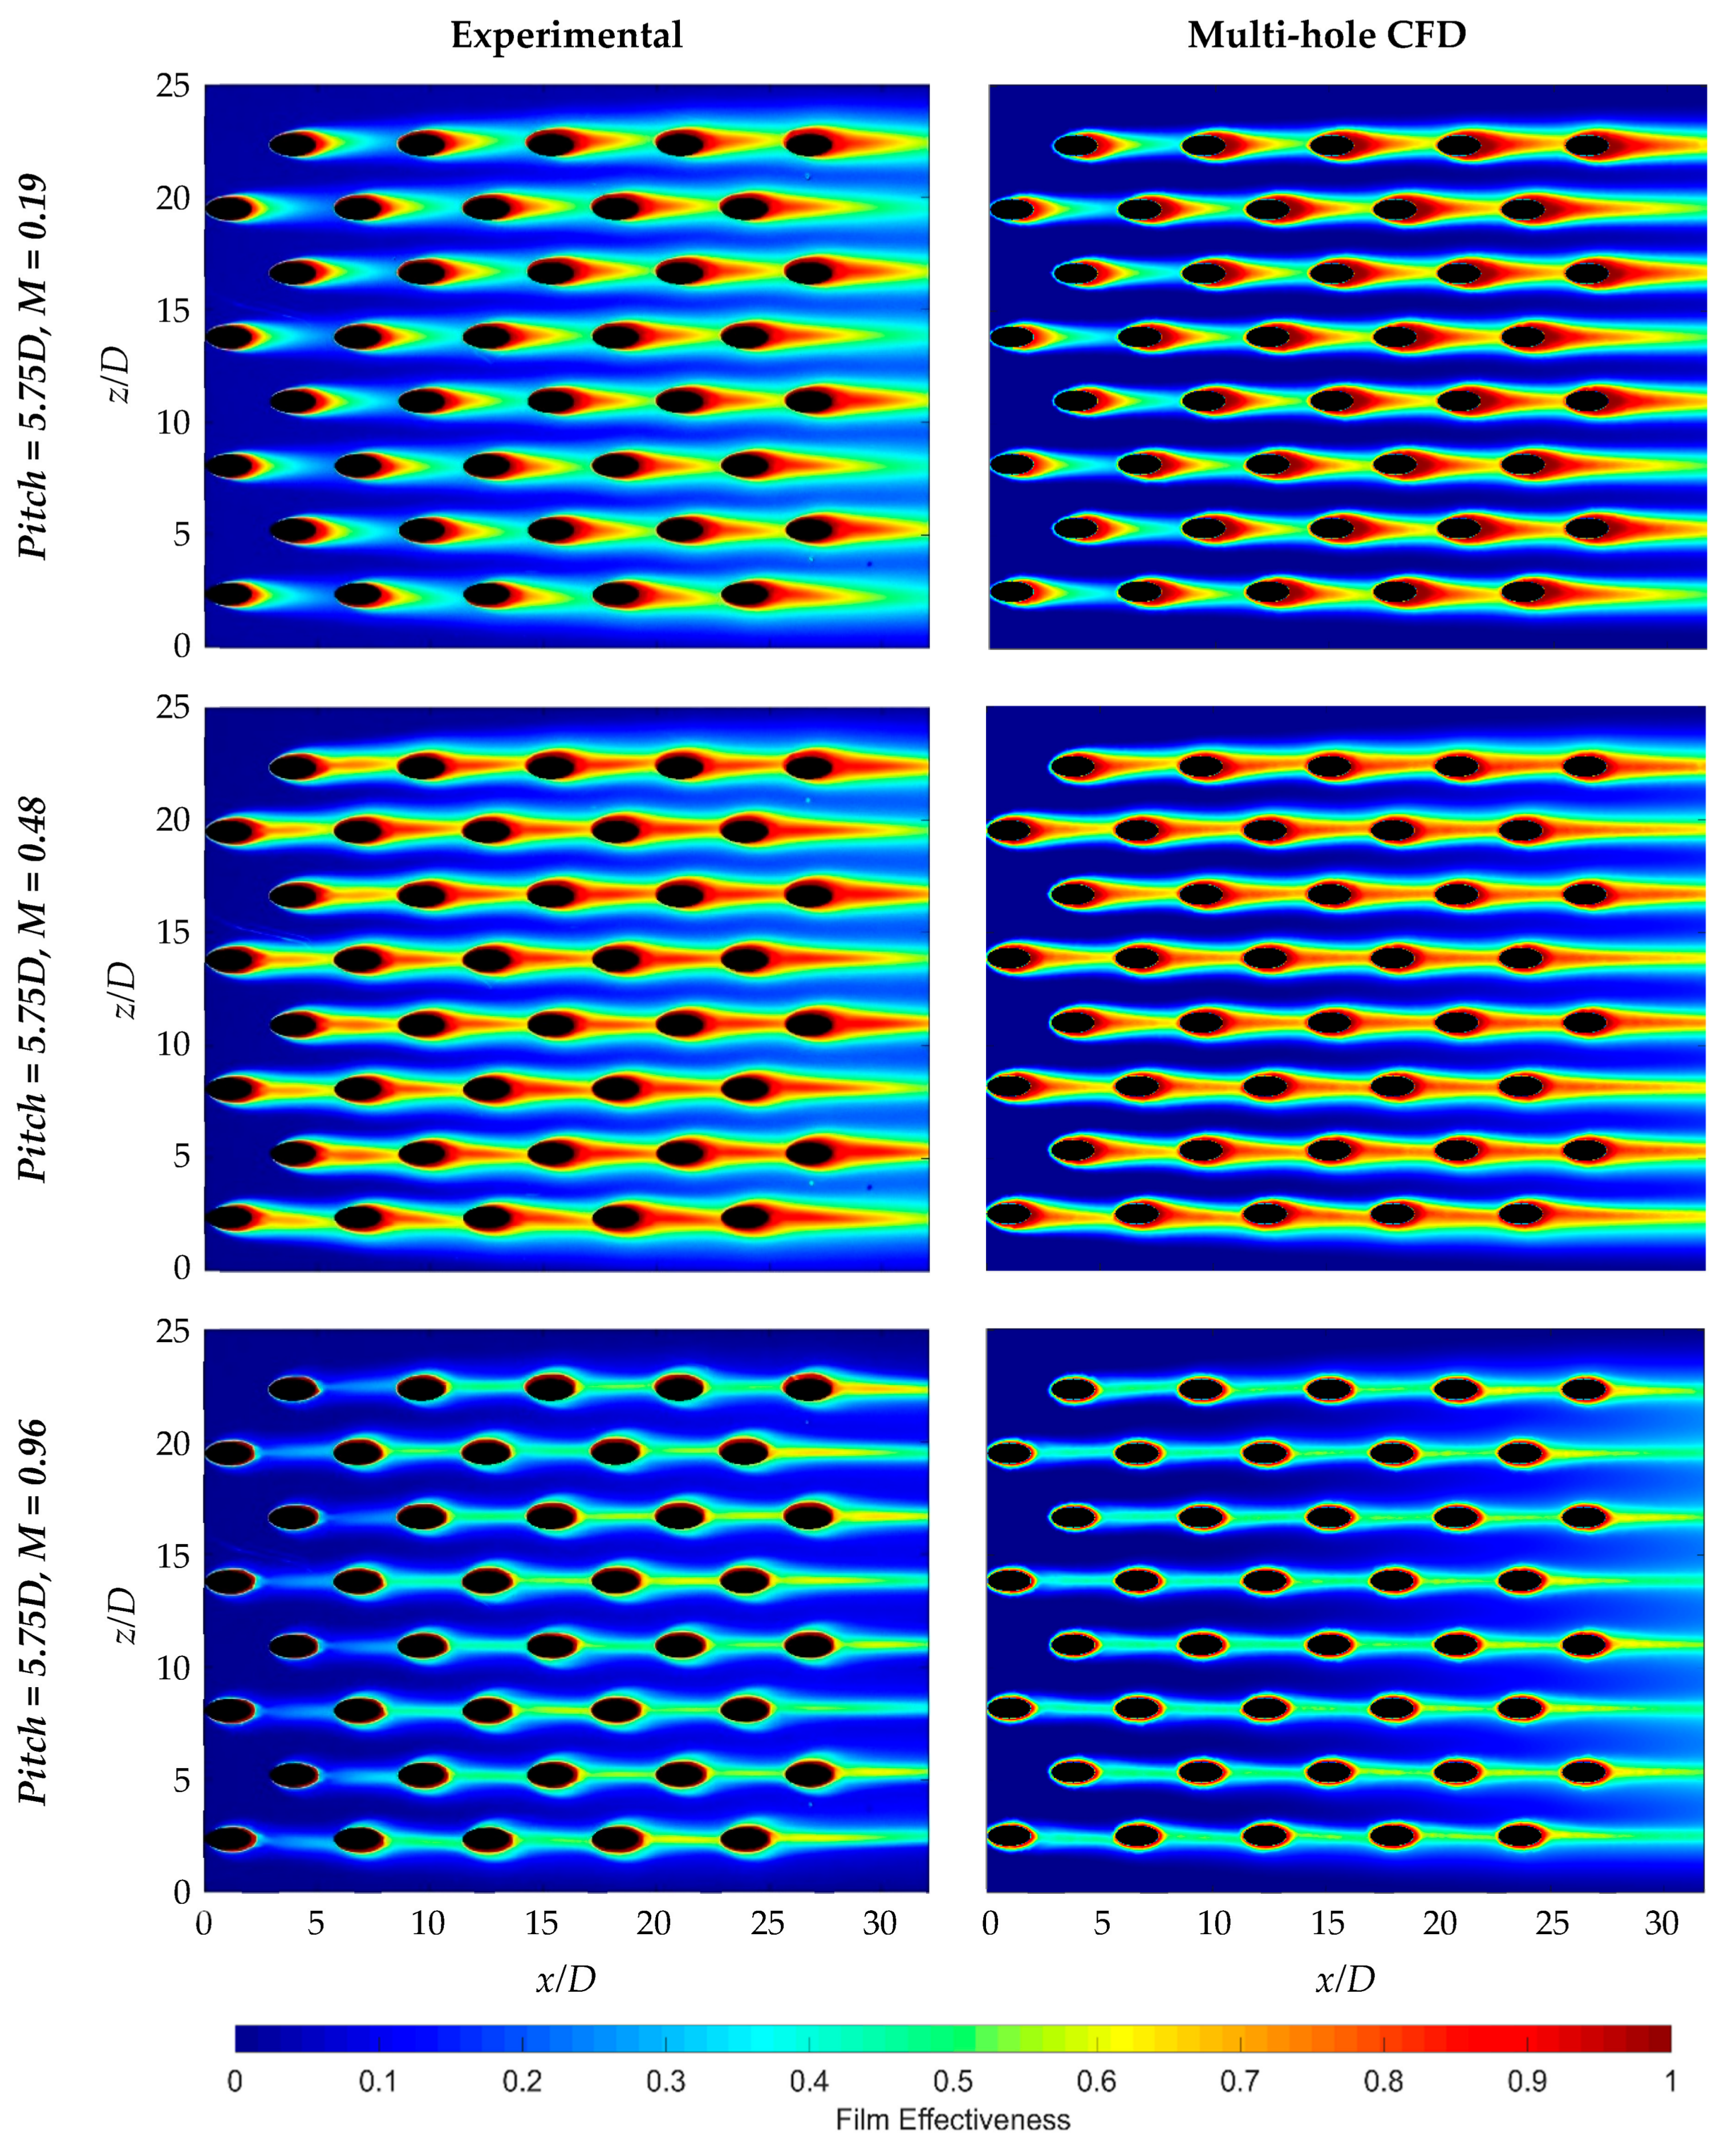
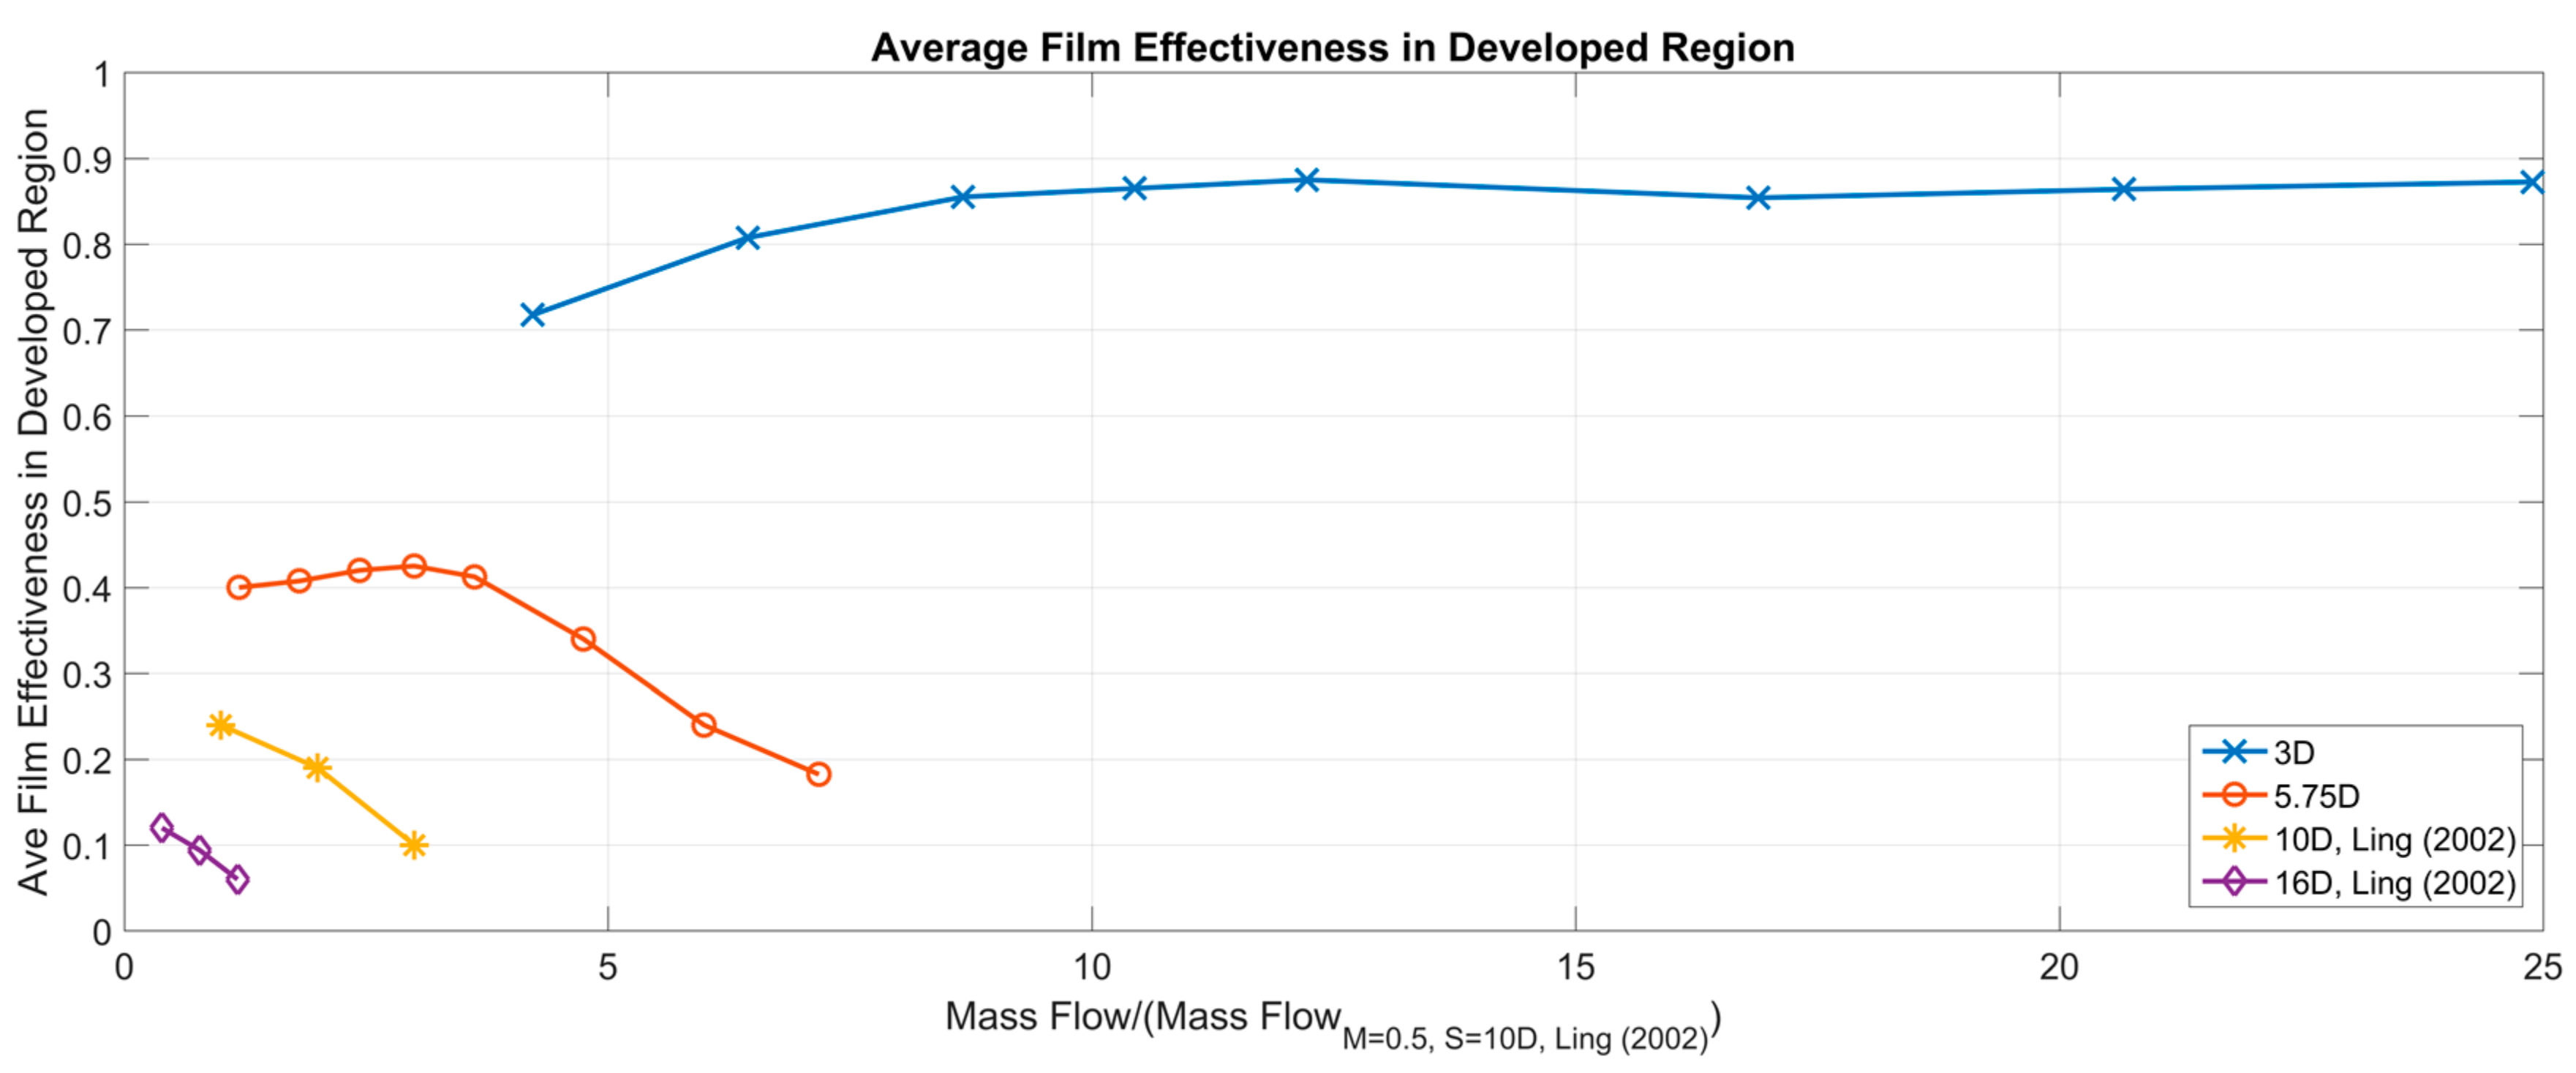
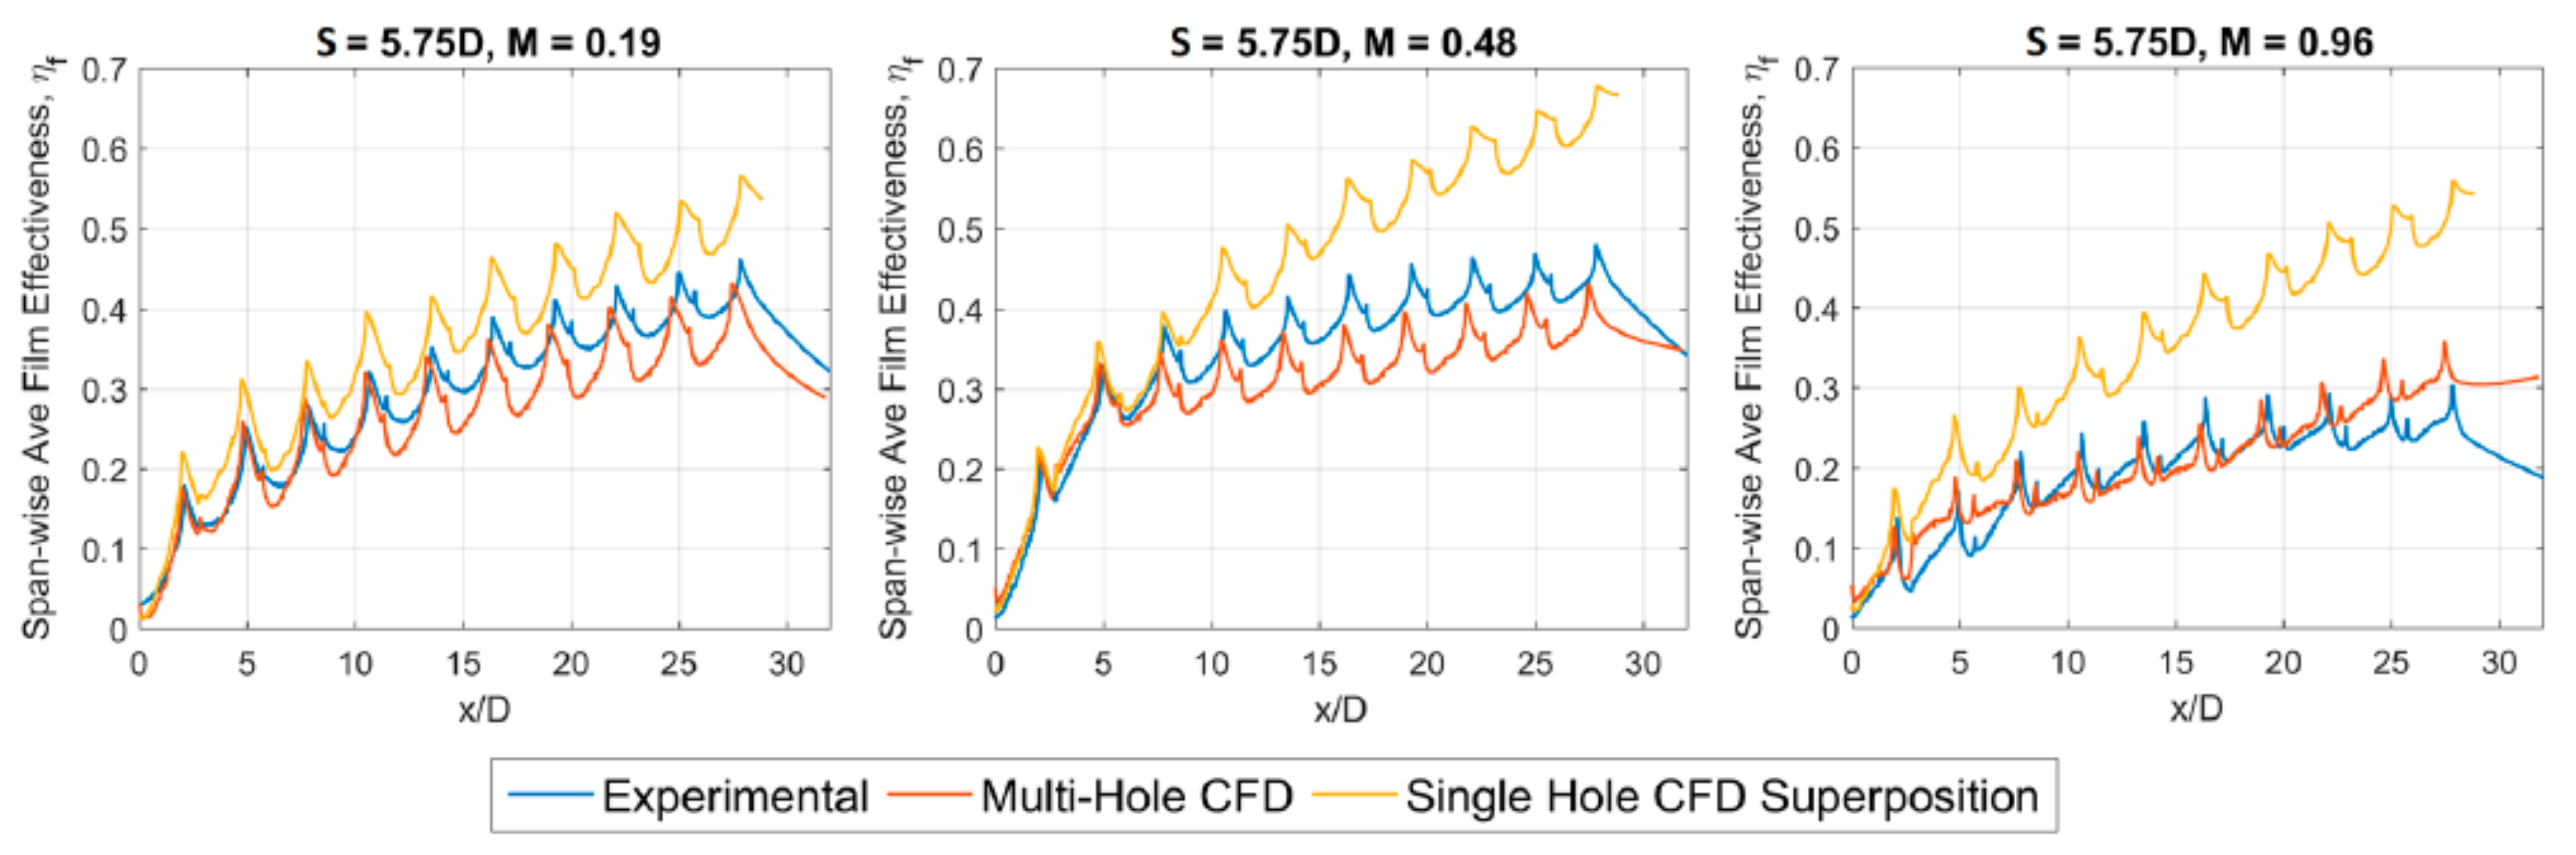
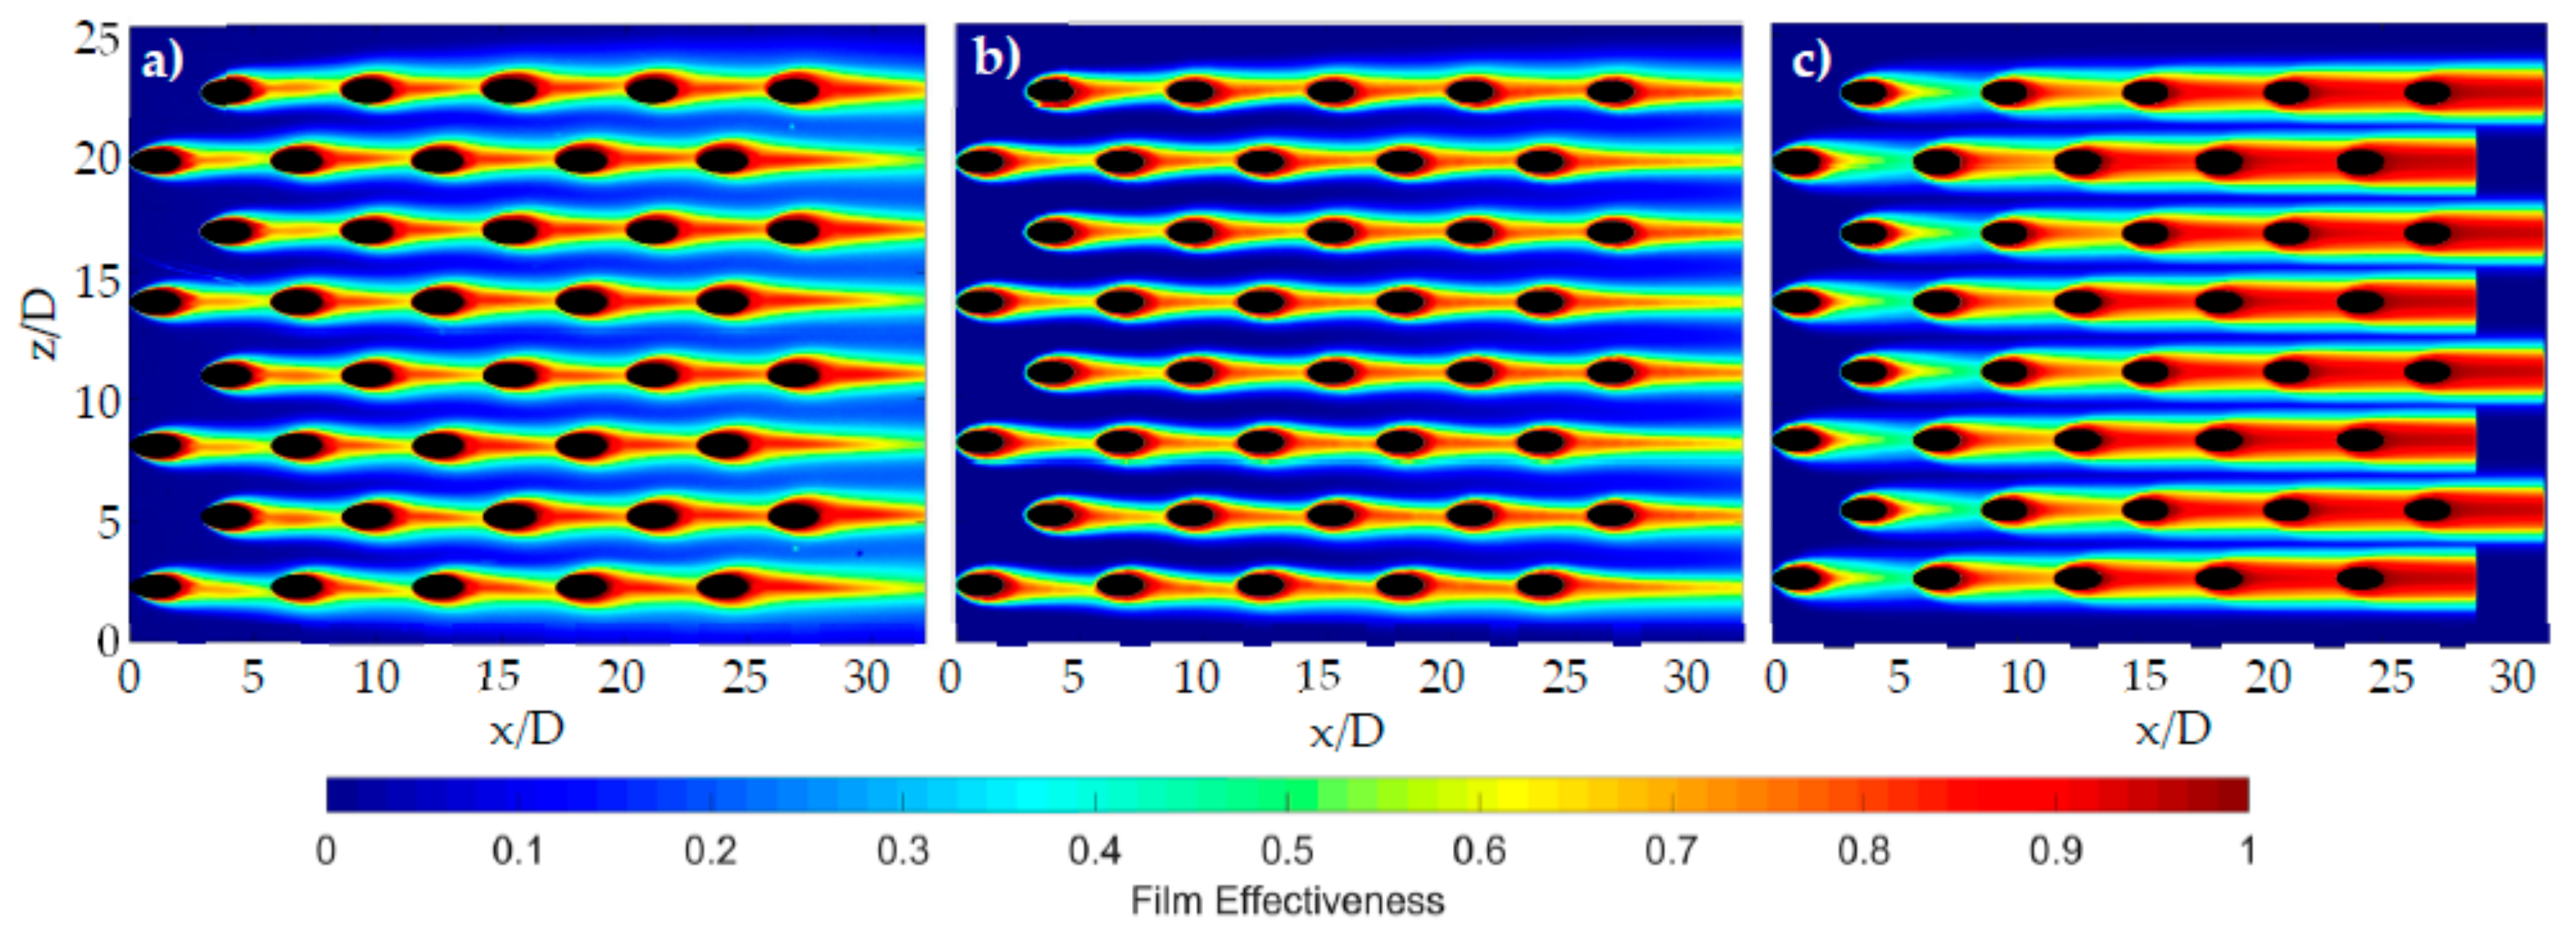
3. Results and Discussion

In the processing of all results, it is noted that data at the location of the film holes were set to NaNs (not a number) and thus contained no data. Additionally, all methods of effusion modelling presented were for a density ratio of approximately unity. Figure 4 and Figure 5 depict 2D adiabatic film effectiveness contours obtained from both the PSP experimental method and multi-hole CFD simulations at a range of blowing ratios for both geometries. Measurements were taken at blowing ratio increments of approximately 0.1 between the range of 0.1–1.2, but for brevity, only a selection of the results are presented here.
Perhaps most striking are the highly effective films developed in the 3.0D pitch geometry. Given the close proximity of the holes, near continuous films are developed in which variations in spanwise effectiveness quickly diminish as blowing ratios are increased above 0.5, an effect that is captured in both the experiments and multi-hole CFD simulations. The results for this geometry also indicate that the number of rows of holes required for fully developed films is a strong function of the blowing ratio. Spanwise averaged results for the multi-hole CFD simulations (not shown here) indicate that for blowing ratios greater than 0.5, approximately seven rows of primary holes are required for fully-developed films, a value in keeping with observations made by Krewinkel [3]. Indeed, for blowing ratios between 0.5 and 1.2, little variation was observed in the spanwise averaged film effectiveness absolute values and trends.
The performance of the multi-hole, heat-mass transfer analogy CFD model for the 3.0D pitch geometry was reasonably satisfactory. Many of the trends captured in the experiments were evident in the CFD. At lower blowing ratios, there is a noticeable variation in film effectiveness across the spanwise holes in each row, and this was observed in both the CFD and PSP experiments. This is believed to result from variations in the blowing ratio across the width of the test plate. Towards the edges of the plate, the development of the side-wall boundary layers acts to reduce mainstream flow velocity; as a consequence, the blowing ratio is increased at these edge film holes, and the extent of the film cooling increased. The CFD over-predicts the performance of the films across all blowing ratios. The mixing of the jets observed in the CFD appears to be less than that shown by the experiments, and this is evidenced by the reduced spreading of the films along with a slower rate of film decay. It is anticipated that the highly complex spanwise interactions between films ejected at the same row are not fully resolved in the simulations, and this accounts for some of the variations observed between the CFD and experiments. The results for the 3.0D pitch geometry also appear to indicate no film development over the first couple of rows of film holes for the lowest blowing ratio shown (M = 0.19) for both the experiments and multi-hole CFD. Pressure contours in the CFD simulation indicate that, to a small extent, at the lowest mass-flows, coolant is not evenly fed to all the holes, with the middle and latter holes being favoured. This is confirmed via velocity vectors, which demonstrate that some ingestion occurs in the first row of film holes. At higher blowing ratios, where total inlet pressure is increased, this behaviour is not observed.
Good agreement was observed between the multi-hole CFD simulations and experimental results for the hole pitch of 5.75D, and this is, in-part, expected to result from the reduced lateral jet interactions. The multi-hole CFD simulations capture the trends observed in the experiments particularly well with a steadily increasing film effectiveness up until a blowing ratio of approximately 0.5, after which the effect of jet lift-off is observed. As with the closer pitch geometry, the CFD does slightly under-predict mixing of the jets, although this effect is relatively minimal. The number of primary hole rows required for fully-developed films also appears to be reduced when compared to the 3.0D geometry, with around five rows of holes being required (similar to observations made by Ling et al. [27]), although once again this is a function of the blowing ratio. Furthermore, the multi-hole CFD model does appear to estimate that a greater number of holes are required for fully-developed films, and this effect increases with blowing ratios greater than one (see Figure 6 which shows spanwise averaged film effectiveness from both the experimental and computational methods). Indeed, the figure shows that, at all three blowing ratios, films in the multi-hole CFD have not reached a fully-developed state by the end of the test piece, but at a blowing ratio of 0.96, the experimental results do seem to indicate fully-developed films at x/D of around 22.
To allow for further benchmarking of the results, the findings were compared to data obtained in a previous study by Ling et al. [27], who attempted to quantify effusion cooling performance via a liquid crystal thermography method. Ling investigated two flat-plate geometries with hole pitches of 10D and 16D and presented the average film effectiveness achieved in the fully-developed film region as a function of normalised coolant mass-flow. The data obtained by Ling et al. have been adapted and are presented along with the data from the current study in Figure 7. The graph demonstrates the considerable increase in film effectiveness achieved with the closer pitched holes, with average film effectiveness in the fully-developed region of the 3D pitch geometry between 0.8 and 0.9 across almost all blowing ratios investigated. At normalised mass-flows of around one, the figure shows how, as the film hole pitch decreases from 16D to 5.75D, effectiveness increases by around a factor of four. Similarly, at normalised mass-flows of around five, average film effectiveness values for the 3D pitch are almost twice that of the 5.75D pitch. The results therefore clearly demonstrate the potential of effusion cooling and the significant increases in cooling performance achieved at very low hole pitches at similar levels of coolant mass-flow.
Sellers’ superposition method applied to a single hole CFD model displayed greater discrepancy when compared to the PSP experimental results, and this is highlighted in Figure 8. The figure displays two-dimensional film effectiveness data obtained from experiments and both the multi-hole and single hole superposition CFD simulations at a blowing ratio of 0.48 on the 5.75D pitch geometry. Apparent is the considerable over-prediction in film development using the superposition method, with much wider and more effective films being developed by the second row of holes. This trend was observed across all blowing ratios tested with the deviation in effectiveness becoming more prominent as the blowing ratio was elevated. This is well shown by Figure 6, which displays spanwise averaged film effectiveness for three of the blowing ratios investigated using the experimental data, along with the results from both computational methods.
Figure 6 demonstrates that, by a blowing ratio of approximately one, spanwise averaged film effectiveness values via the superposition method were around twice those displayed by the multi-hole CFD simulation and PSP experiment. A number of reasons are hypothesised for this discrepancy. As already established, the blowing ratio across the tested multi-hole plate was not constant, and this is inherently disregarded in the superposition method. The effects of uneven flow turning in the coolant plenum that feeds the effusion holes were also evident in the multi-hole CFD model. This will once again affect both the blowing ratio and flow field in each individual hole and is not accounted for in the superposition method. The multi-hole CFD simulations also demonstrate how the upstream jets significantly impact the flow characteristics downstream with notable variations in both the velocity and turbulence profiles at downstream film holes. To further explore this hypothesis, further investigations were performed and are discussed below.

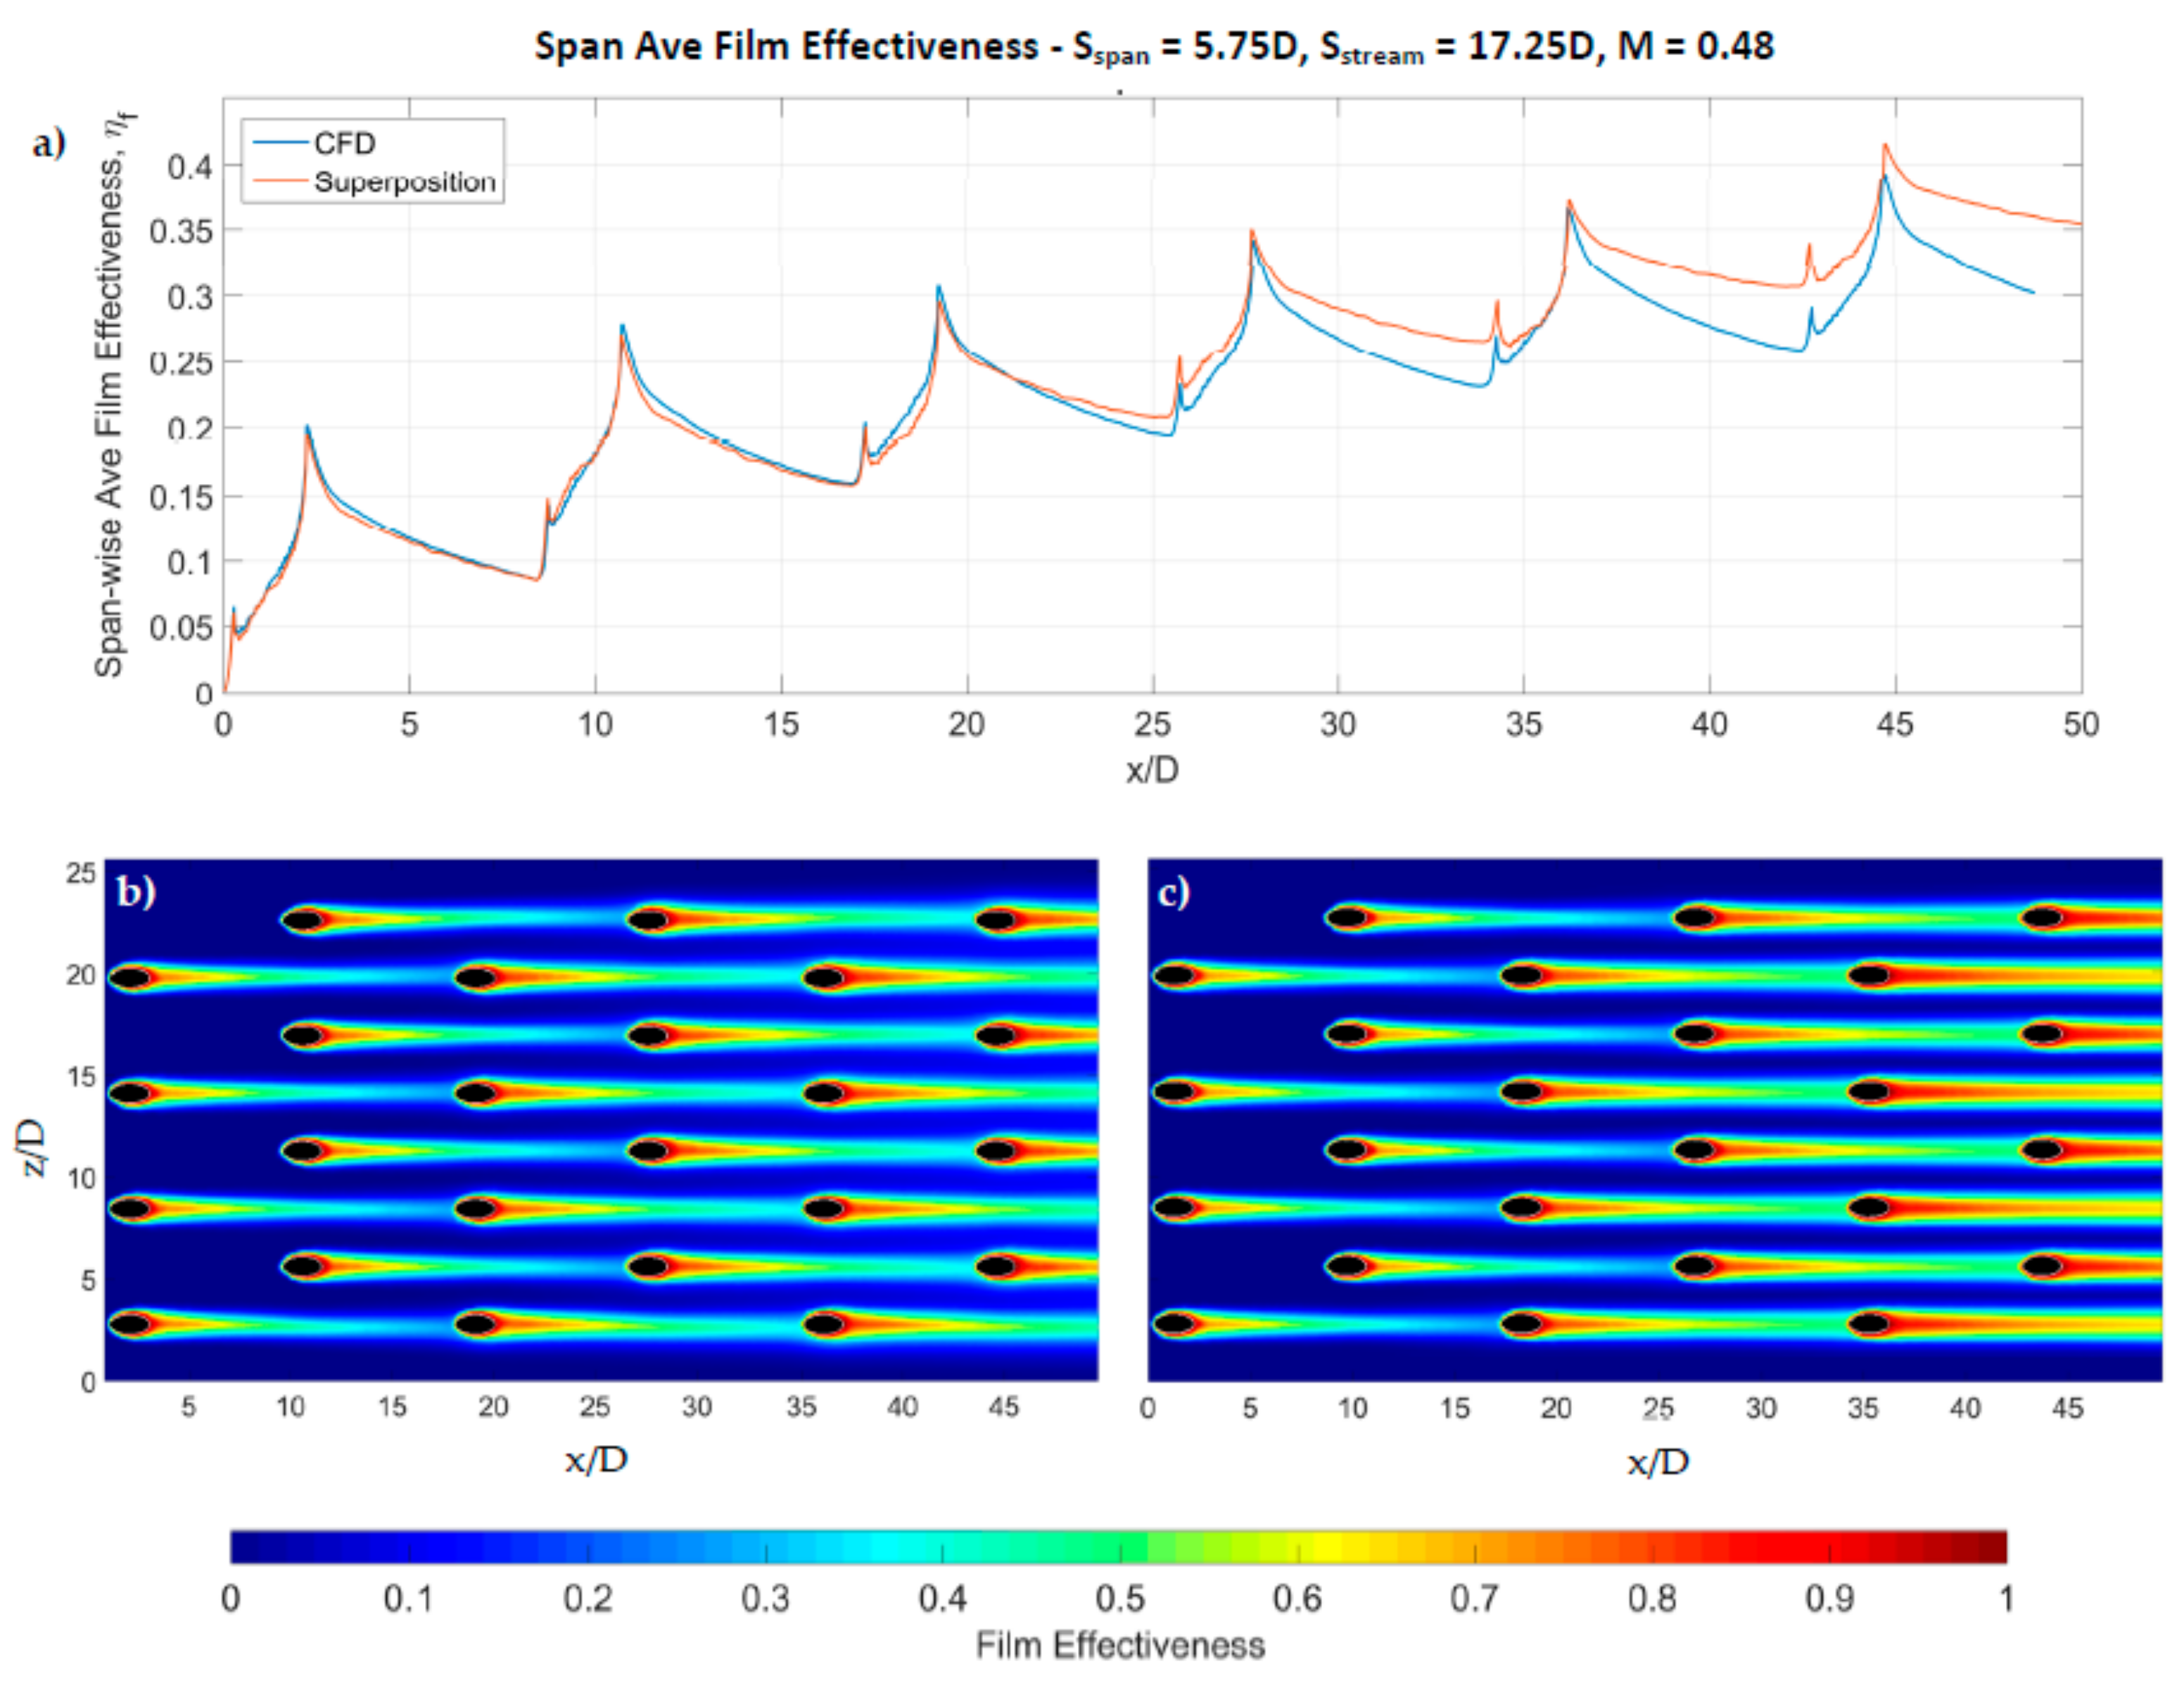
Further Investigation of Superposition in Effusion Cooling Performance Modelling

To further investigate the cause of the significant deviation exhibited by Sellers’ superposition method in the above analysis and to establish the applicability of the superposition method to effusion cooling, a further geometry was examined via the above multi-hole CFD method. Spanwise hole pitching in the geometry was maintained at 5.75D. To test the hypothesis that it is indeed the variations in the flow characteristics at downstream film holes caused by the upstream film jets that are responsible for this deviation, streamwise hole pitching was increased by a factor of three to 17.25D. It was anticipated, based on the previous results, that this hole pitching would allow for the re-establishment of the downstream flow field and consequently minimise the effect of flow variations from upstream jets. It is noted that the CFD domain was extended to allow for three rows of primary holes to be simulated. In addition to the multi-hole CFD simulation, the superposition model was applied to the results from a single hole ejection and a comparison made. It is noted that for both methods of analysis, a blowing ratio of 0.48 was investigated, and the coolant plenum domain adjusted so that each film hole inlet was fed separately allowing a blowing ratio of 0.48 to be maintained across each hole and consequently minimising the effect of small variations in M from each hole.
Figure 9 shows the resulting spanwise averaged film effectiveness plots for the increased hole pitch geometry for both the multi-hole CFD simulation and superposition method, along with the contour plots for each case. Apparent is the considerable improvement in the performance of the superposition method at increased streamwise hole pitching with peak spanwise averaged effectiveness values showing a less than 10% discrepancy by the third row of holes. The contour plots demonstrate that the superposition method still develops slightly stronger stripes of effectiveness; however, it is anticipated that this deviation would reduce as hole pitch is further increased. The results do indicate that at the low values of hole pitching that characterise effusion cooling, there are significant interactions between the film jets that act to reduce film effectiveness, and these need to be accounted for in any superposition method.
To further demonstrate the effect of upstream jet interactions, flow characteristics were compared for both the 5.75D and 17.25D streamwise hole pitch geometries for the case of a constant blowing ratio of 0.48 using the results of the multi-hole CFD simulations. Contour plots depicting normalised velocity and turbulent kinetic energy (TKE) at a height of 0.33D from the plate surface are demonstrated for both geometries in Figure 10 and Figure 11, respectively. For the case of the 5.75D pitch geometry, there are notable interactions between upstream and downstream jets, and these are clearly demonstrated in both the trends for velocity and TKE. Whilst the increased hole pitch still displays some interaction between jets, the effect is significantly reduced, and the flow conditions prior to each hole are approximately the same. Thus, the cooling effect achieved from each hole is similar with little reduction in effectiveness being caused by increased turbulence and flow mixing from upstream jets. Consequently, it is suggested that, without alteration to the superposition method to account for variations in the flow field, its applicability to effusion cooling with closely pitched streamwise holes is somewhat limited.

4. Conclusions

The work presented in this paper has discussed a number of experimental and computational methods investigated for the modelling of multiple, staggered-row, effusion cooling geometries. Two flat-plate effusion cooling geometries were investigated with primary hole pitches of 3.0D and 5.75D, at blowing ratios of between 0.1 and 1.2.
The experimental PSP method developed has provided very high resolution film effectiveness data that have permitted benchmarking of the computational methods. The experimental data have also demonstrated the very high levels of film effectiveness that can be achieved at relatively low blowing ratios when utilising closely-pitched, effusion cooling hole geometries. The 3.0D pitched hole geometry displayed strong spanwise jet interactions with near complete spanwise films being developed at blowing ratios as low as 0.3. Whilst with the 5.75D pitch geometry, complete films were not developed at any of the investigated blowing ratios, the experimental results displayed strong film build-up in the streamwise direction.
The multi-hole, heat-mass transfer analogy CFD method has displayed promising results, particularly at the larger of the two pitches investigated in which both the trends observed and absolute film effectiveness values were very similar to those witnessed in the experiments. It is noted that the jet mixing displayed by the CFD does appear to under-predict those seen in the experiments, although this effect is less prominent at the larger pitching.
The results of the superposition model when applied to two-dimensional film effectiveness distributions obtained from a single hole CFD simulation showed greater discrepancy with the experiments. This was primarily expected to result from the interactions between the jets primarily in the streamwise direction. Given the much closer hole pitching that characterises effusion cooling, these interactions are more significant. To test this hypothesis, a further geometry was analysed, which maintained a spanwise pitch of 5.75D, but increased the streamwise hole pitch by a factor of three to 17.25D. The superposition method displayed much improved performance at this increased streamwise pitch. Indeed, the multi-hole CFD simulations demonstrated that at this greater hole pitch, the general flow field prior to each hole was approximately the same given the increased length over which the flow was able to re-establish after an upstream film ejection. This was displayed via streamwise velocity and turbulent kinetic energy contours that demonstrated the significant reduction in streamwise jet interactions when pitching was increased. Consequently, it is suggested that, in the case of effusion cooling, superposition methods need to take into account the complex jet interactions that result from the upstream film holes. The potential of the method in significantly reducing simulation times, however, is apparent, and indeed, further work by the authors demonstrates this in the application of the method to assessing double-wall effusion cooling geometries (see [28]).

Acknowledgments

The authors wish to express their thanks for the on-going support provided by both Rolls-Royce PLC and the EPSRC. The authors would also like to thank the technicians at the Oxford Thermofluids Institute for their assistance in the manufacturing of the experimental setup.

Author Contributions

Alexander V. Murray, Peter T. Ireland and Anton J. Rawlinson conceived of the experiments and aims of the work. Tsun Holt Wong developed the experimental facility and processing tools, with Shaun W. Tang making some modifications to the experimental facility. Alexander V. Murray, Shaun W. Tang and Tsun Holt Wong performed the experiments. Alexander V. Murray performed the CFD and superposition work, analysed the data and wrote the paper under the supervision of Peter T. Ireland

Conflicts of Interest

Rolls-Royce PLC as the funding sponsor provided input to the general scope of interest in the study and the decision to publish the results. They had no direct role in the collection, analyses or interpretation of the data.

Nomenclature

CMass Fraction
CFDComputational Fluid Dynamics
cpSpecific Heat Capacity (J/K, const. p)
DDiameter (m)
HPHigh Pressure
kThermal Conductivity (W/m.k)
MBlowing Ratio ( ρ c v c / ρ v )
PNon-Dimensional Pitch (-)
p o 2 Partial Pressure of Oxygen
PrPrandtl Number (-)
PSPPressure-Sensitive Paint
SPitch (m)
sSource Term
SpanSpanwise Component
StreamStreamwise Component
TTemperature (K)
tTime (s)
TETTurbine Entry Temperature
TKETurbulent Kinetic Energy (J/kg)
xnDirection Vector
vVelocity (m/s)
Greek Characters
αThermal Diffusivity (m2/s)
ΓDiffusivity (m2/s)
η f Film Effectiveness
μDynamic Viscosity (Pa s)
ρ Density (kg/m3)
φScalar Quantity
Subscripts
awAdiabatic Wall
cCoolant Condition
eExit Condition
inInlet Condition
lLaminar Condition
tTurbulent Condition
wWall
Mainstream Condition

References

  1. Broomfield, R.W.; Ford, D.A.; Bhangu, J.K.; Thomas, M.C.; Frasier, D.J.; Burkholder, P.S.; Harris, K.; Erickson, G.L.; Wahl, J.B. Development and turbine engine performance of three advanced rhenium containing superalloys for single crystal and directionally solidified blades and vanes. J. Eng. Gas Turbines Power 1998, 120, 595–608. [Google Scholar] [CrossRef]
  2. Ireland, P.T. The Potential Impact of Propulsion Technology on Emissions and Energy Security. In Energy, Transport & the Environment: Addressing the Sustainable Mobility Paradigm; Inderwildi, O., King, D.S., Eds.; Springer: London, UK, 2012; pp. 435–448. [Google Scholar]
  3. Krewinkel, R. A review of gas turbine effusion cooling studies. Int. J. Heat Mass Transf. 2013, 66, 706–722. [Google Scholar] [CrossRef]
  4. Andrews, G.E.; Asere, A.A.; Gupta, M.L.; Mkpadi, M.C. Full coverage discrete hole film cooling: The influence of hole size. In Proceedings of the American Society of Mechanical Engineers (ASME) 1985 International Gas Turbine Conference and Exhibit, Houston, TX, USA, 18–21 March 1985; p. V003T09A003. [Google Scholar]
  5. Gustafsson, K.M.B.; Johansson, T.G. An Experimental Study of Surface Temperature Distribution on Effusion-Cooled Plates. J. Eng. Gas Turbines Power 2001, 123, 308–316. [Google Scholar] [CrossRef]
  6. Crawford, M.E.; Kays, W.M.; Moffat, R.J. Full-Coverage Film Cooling on Flat, Isothermal Surfaces: A Summary Report on Data and Predictions; NASA Contractor Report 3219; Stanford University: Stanford, CA, USA, 1980.
  7. Foster, N.W.; Lampard, D. The Flow and Film Cooling Effectiveness Following Injection through a Row of Holes. J. Eng. Power 1980, 102, 584–588. [Google Scholar] [CrossRef]
  8. Gustafsson, B. Experimental Studies of Effusion Cooling. Ph.D. Thesis, Chalmers University of Technology, Goteborg, Sweden, 2001. [Google Scholar]
  9. Baldauf, S.; Schulz, A.; Wittig, S. High-Resolution Measurements of Local Effectiveness From Discrete Hole Film Cooling. J. Turbomach. 2001, 123, 758–765. [Google Scholar] [CrossRef]
  10. Krawciw, J.; Martin, D.; Denman, P. Measurement and Prediction of Adiabatic Film Effectiveness of Combustor Representative Effusion Arrays. In Proceedings of the American Society of Mechanical Engineers (ASME) Turbo Expo 2015: Turbine Technical Conference and Exposition, Montreal, QC, Canada, 15–19 June 2015; p. V05BT12A035. [Google Scholar]
  11. Hu, Y.; Ji, H. Numerical study of the effect of blowing angle on cooling effectiveness of an effusion cooling. In Proceedings of the American Society of Mechanical Engineers (ASME) Turbo Expo 2004: Power for Land, Sea, and Air, Vienna, Austria, 14–17 June 2004; pp. 877–884. [Google Scholar]
  12. Andreini, A.; Facchini, B.; Picchi, A.; Tarchi, L.; Turrini, F. Experimental and theoretical investigation of thermal effectiveness in multiperforated plates for combustor liner effusion cooling. J. Turbomach. 2014, 136, 091003. [Google Scholar] [CrossRef]
  13. Ceccherini, A.; Facchini, B.; Tarchi, L.; Toni, L. Adiabatic and overall effectiveness measurements of an effusion cooling array for turbine endwall application. In Proceedings of the American Society of Mechanical Engineers (ASME) Turbo Expo 2008: Power for Land, Sea, and Air, Berlin, Germany, 9–13 June 2008; pp. 775–788. [Google Scholar]
  14. Andrei, L.; Andreini, A.; Bianchini, C.; Caciolli, G.; Facchini, B.; Mazzei, L.; Picchi, A.; Turrini, F. Effusion Cooling Plates for Combustor Liners: Experimental and Numerical Investigations on the Effect of Density Ratio. Energy Procedia 2014, 45, 1402–1411. [Google Scholar] [CrossRef]
  15. Cerri, G.; Giovannelli, A.; Battisti, L.; Fedrizzi, R. Advances in effusive cooling techniques of gas turbines. Appl. Therm. Eng. 2007, 27, 692–698. [Google Scholar] [CrossRef]
  16. Manzhao, K.; Huiren, Z.; Songling, L.; Hepeng, Y. Internal heat transfer characteristics of Lamilloy configurations. Chin. J. Aeronaut. 2008, 21, 28–34. [Google Scholar] [CrossRef]
  17. Sweeney, P.C.; Rhodes, J.F. An Infrared Technique for Evaluating Turbine Airfoil Cooling Designs. J. Turbomach. 1999, 122, 170–177. [Google Scholar] [CrossRef]
  18. ANSYS. Fluent User Guide (Release 16.2); ANSYS: Pittsburgh, PA, USA, 2015. [Google Scholar]
  19. Wong, T.H.; Ireland, P.T.; Self, K.P. Film Cooling Effectiveness Measurements on Trailing Edge Cutback Surface and Lands Following Novel Cross Corrugated Slot Geometry. In Proceedings of the American Society of Mechanical Engineers (ASME) Turbo Expo 2016, Seoul, Korea, 13–17 June 2016; p. V05CT19A024. [Google Scholar]
  20. Gurram, N.; Ireland, P.T.; Wong, T.H.; Self, K.P. Study of Film Cooling in the Trailing Edge Region of a Turbine Rotor Blade in High Speed Flow Using Pressure Sensitive Paint. In Proceedings of the American Society of Mechanical Engineers (ASME) Turbo Expo 2016, Seoul, Korea, 13–17 June 2016; p. V05CT19A023. [Google Scholar]
  21. Han, J.-C.; Rallabandi, A.P. Turbine Blade Film Cooling Using PSP Technique. Front. Heat Mass Transf. 2010, 1, 013001. [Google Scholar] [CrossRef]
  22. Moffat, R.J. Describing the uncertainties in experimental results. Exp. Therm. Fluid Sci. 1988, 1, 3–17. [Google Scholar] [CrossRef]
  23. Han, J.-C. Fundamental gas turbine heat transfer. J. Therm. Sci. Eng. Appl. 2013, 5, 021007. [Google Scholar] [CrossRef]
  24. Kirollos, B.; Povey, T. An Energy-Based Method for Predicting the Additive Effect of Multiple Film Cooling Rows. J. Eng. Gas. Turbines Power 2015, 137, 122607. [Google Scholar] [CrossRef]
  25. Thomas, M.; Povey, T. A novel scalar tracking method for optimising film cooling systems. Proc. Inst. Mech. Eng. Part J. 2016, 230, 3–15. [Google Scholar] [CrossRef]
  26. Sellers, J.P. Gaseous Film Cooling with Multiple Injection Stations. AIAA J. 1963, 1, 2154–2156. [Google Scholar] [CrossRef]
  27. Ling, J.C.; Ireland, P.T.; Turner, L. Full coverage film cooling for combustor transition sections. In Proceedings of the American Society of Mechanical Engineers (ASME) Turbo Expo 2002: Power for Land, Sea, and Air, Amsterdam, The Netherlands, 3–6 June 2002; pp. 1011–1021. [Google Scholar]
  28. Murray, A.V.; Ireland, P.T.; Rawlinson, A.J. An Integrated Conjugate Computational Approach for Evaluating the Aerothermal and Thermomechanical Performance of Double-Wall Effusion Cooled Systems. In Proceedings of the American Society of Mechanical Engineers (ASME) Turbo Expo 2017, Charlotte, NC, USA, 26–30 June 2017; p. V05BT22A015. [Google Scholar]
Figure 1. Schematic of the experimental setup.
Ijtpp 03 00004 g001
Figure 2. Schematic showing the dimensions of the two flat-plate test geometries as a function of the film hole diameter.
Ijtpp 03 00004 g002
Figure 3. Graphical demonstration of the developed two-dimensional superposition method (the contour demonstrates film effectiveness).
Ijtpp 03 00004 g003
Figure 4. PSP experimental and multi-hole CFD film effectiveness contours for three of the tested blowing ratios for a non-dimensional hole pitch of 3.0.
Ijtpp 03 00004 g004
Figure 5. PSP experimental and multi-hole CFD film effectiveness contours for three of the tested blowing ratios for a non-dimensional hole pitch of 5.75.
Ijtpp 03 00004 g005
Figure 6. Comparison of the spanwise averaged film effectiveness results for the PSP experiment, multi-hole CFD and single hole superposition CFD model at three blowing ratios.
Ijtpp 03 00004 g006
Figure 7. Average film effectiveness in the developed film region against normalised mass-flow for both the 3D and 5.75D pitch geometries, along with a comparison against data obtained by Ling et al. [21] for pitches of 10D and 16D.
Ijtpp 03 00004 g007
Figure 8. Film effectiveness contours for a pitch of 5.75D and an average blowing ratio of 0.48 from: (a) the PSP experimental rig; (b) multi-hole CFD simulation; and (c) Sellers’ superposition method applied to a single-hole CFD simulation using the two-dimensional film data.
Ijtpp 03 00004 g008
Figure 9. (a) Comparison of the spanwise averaged film effectiveness results from both the multi-hole CFD simulations and superposition method for the increased streamwise hole pitching of 17.25D (and spanwise of 5.75D) at a blowing ratio of 0.48, along with contour plots showing the film effectiveness trends from the (b) multi-hole CFD simulation and (c) superposition model.
Ijtpp 03 00004 g009
Figure 10. Normalised streamwise velocity contours at a height of 0.33D from the plate surface for the streamwise hole pitches of (a) 5.75D and (b) 17.25D based on the results of the multi-hole CFD simulations.
Ijtpp 03 00004 g010
Figure 11. Normalised turbulent kinetic energy contours at a height of 0.33D from the plate surface for the streamwise hole pitches of (a) 5.75D and (b) 17.25D based on the results of the multi-hole CFD simulations.
Ijtpp 03 00004 g011

